Shoto is an app that lets you automatically share your favourite moments with friends who are at the same location. Shoto's vision is to connect the world using the power of shared moments and memories, allowing everyone to share experiences, recommendations and find new places. With shoto, you can share your special moments with friends and family everywhere.
Pulkit Agrawal, Biz Development & Operations, and Sachin Duggal, Co-founder & Chief Wizard, told us how shoto uses data to take their business to the next level and design their growth engine.
What’s shoto and what are your roles?
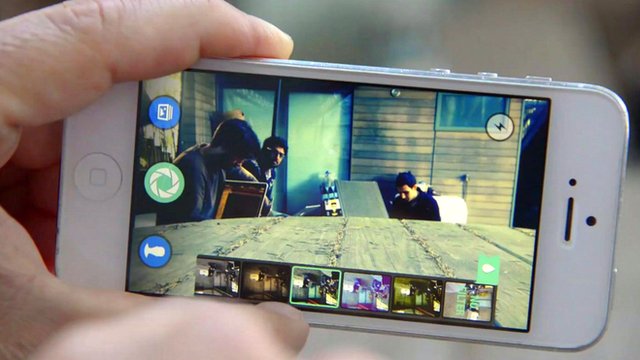
Sachin: What shoto does is bring together the pictures that you and your friends have taken when you were together. It does this automatically using your location and your phonebook. You simply take the picture, and we create the albums. We even invite the right people - you just choose the privacy you want. This could be just yourself or the friends you’re meeting, and then everybody can see the photos.
I wear many hats within my role. Among those are acquisition and product, operations and analytics.
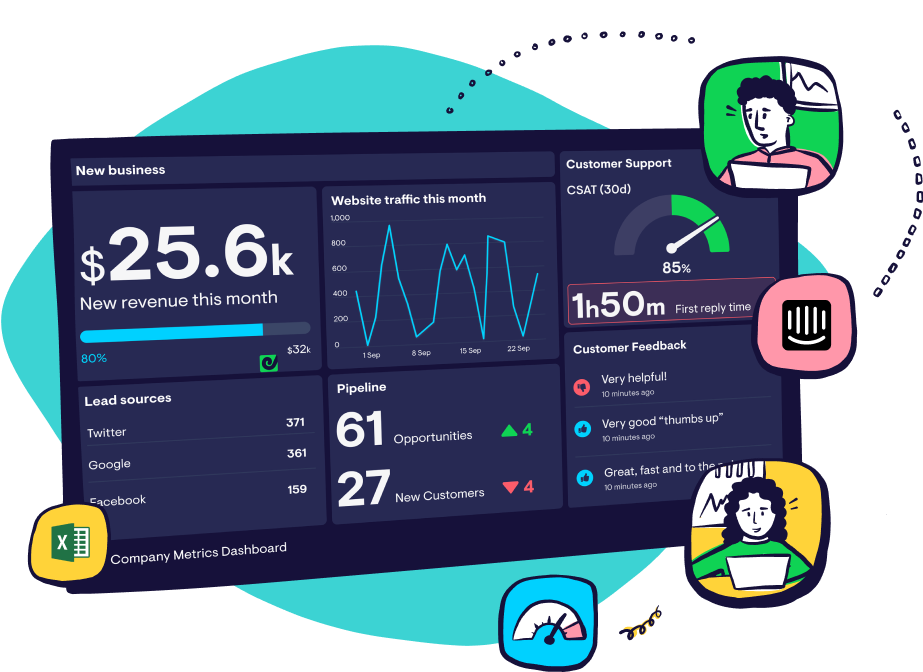
Pulkit: Essentially what we realised was that there's so much data being collected that we needed to highlight the most important things very clearly for the whole team to see. So we identified Geckoboard as a very good option to effectively display some of the key metrics, so that everyone in the team could be aware of what’s going on rather than things getting bottlenecked through me. Also, we wouldn’t need to use an analytics service, right?
We use Geckoboard as a combination of our key metrics, both from a lag and lead perspective. We have daily reports and then weekly reports that are far more detailed and focus much more on lead indication. But you can't be looking at lead indication all day long, so you look at those in moments in time on the dashboard.
I think one of the things we wanted to do was to make sure that the right data surfaced. We think having the visual aspect is important because it allows people to passively look at it. We have daily meetings in which we have a component where we discuss key metrics, keeping everyone up to speed. Then we have a weekly review where we also have updates, but more detailed updates where we dig into some of the lead indicators and try to figure out what we want to focus on and which metric we want to test. So I guess part of it, process-wise, is that we built it into our communication as well as making sure that it's visual, making sure it's at the front of the mind of the entire team.
Sachin: Ultimately when you're building a consumer product it's about getting the product fit as fast as possible. You have a gut intuition as to when you think you've reached that fit, but when you haven't reached it, you need to know where the potential problem is, where the potential problem could be, or where an upcoming problem could be - and that's exactly what data helps us with. We realised that velocity of certain data affects different decisions, so suddenly seeing CPU usage go up affects a certain decision right now, but seeing a low number of A delta and an increase in photos overnight doesn't affect a ‘now’ decision; it's more of a mid-term decision or a weekly decision. The way that pockets and how we look at the events data, we've designed it to look at the velocity of the data and the velocity of the reaction, where there is a reaction and where it’s proactive. Lastly, we feed data into Geckoboard via a number of sources, but we actually track every single event in the system; every button clicked, every time a photo is viewed, every time you scroll across. We've designed it in a way so that we start with a lot of data, and then we filter out the noise to get the insight. This helps us in our situation, as it's better to have every single source of data if you need to do a query of some complex format, and then you can do that on a weekly basis or maybe every two weeks. At least you’ll have important velocity data that you'd have lost otherwise.
How do you work with a data that comes from different customer acquisition related initiatives?
Sachin: Let's talk a bit about acquisition first. The way we do this is quite well linked to our product, and the way any general product is thought about is you acquire a user, that user goes through an onboarding process, they become engaged, and then they become regularly engaged. That's the epiphany everyone wants to experience. We track each of those stages using the data sources we have and then, ideally, we win them into a single flow. What we want to do is track the user right from where he came from to, say, is a Facebook campaign getting us more engaged users? Or is word of mouth getting us more engaged users? To a certain extent we can track some of this, but obviously some of it we can't track. Generally, because there is a drop off in the relationship between what happens from the starting point and the app store, and what happens once you get the app. But because we do more than one activity at a time, we have a good confidence in our ability to extrapolate because we did this, this happened. And this is when the data that’s generated throughout the three stages becomes valuable, because when you're doing marketing you usually see almost immediate results, especially if it's a high velocity channel.
How do you go about understanding what really matters?
Pulkit: The way we think about this is that before increasing the funnel, before increasing the market and getting more users, we need to have a solid product that allows good retention in engagement. If you've got people getting into the funnel and dropping off at different stages it's wasted effort, so our early focus is on tightening up user flow and mapping out what we think the different stages of users and their engagement within the app are. When they first open the app they complete the onboarding process and take actions within the app. The idea for us is to put the primary and initial focus on ensuring that the flow of the user from first getting the app to becoming an engaged user is tied. We need to make sure that we have a good version across all of these stages, and as we develop that we gradually shift our focus earlier and earlier in the process, increasing the follow up and doing more marketing so that our app will get more people in the door.
What would be your advice for non-tech organisations that are looking to initiate the journey to become more data-driven?
Sachin: There are a couple of things you can try to do. I think the most important thing to realise is that it's kind of like dating. You don't date someone without knowing ‘Why should I date them?’ You don't just date them because they're an adult. You date because you have questions or curiosity, or it's easy to know more about the person. That's actually why dating is the prerequisite to a relationship or getting married. Similarly, you don't collect data and just magically come up with your KPIs - whether you're tech or non-tech, you have questions that you’re asking and those questions are everything from ‘When is it going to fall over?’ to ‘Did the marketing campaign I just conducted do well?’ All the way to ‘How is the business doing overall?’ Each of these questions will drive out a set of sub questions, and I think it pays a lot of dividend to do your home work upfront and not use technology; a piece of paper, an excel book etc. It's important that you bring those pieces together and then you can create your dashboard.
Pulkit: I think it's important for every business to understand its user or customer funnel. So even if it's a brick and mortar business or a service business or any other kind of business, always ask what are the stages of your customer or user? Then choose to prioritise one of the more risky stages in order to uncover at which stage your users or customers are struck back or do not proceed to the next stage. Start with laying out the stages, then identify which are the most risky stages. Once you’ve done that, you can start digging into and iterating on those. First, identify the problems you want to solve, then start changing one thing at a time - look at the data and fix it. Once that stage is solved, you move on to the next riskiest stage. I think that's a learning experience that we've had with these funnels, and I think that's something that can be applied to a non-technology business as well.
Find out more about shoto by visiting their website or download the app here.
![]()
Looking for inspiration? Check out some more case studies:
Rhys Taylor, CMO at Saasu, on why data visibility is everything