New Relic dashboards
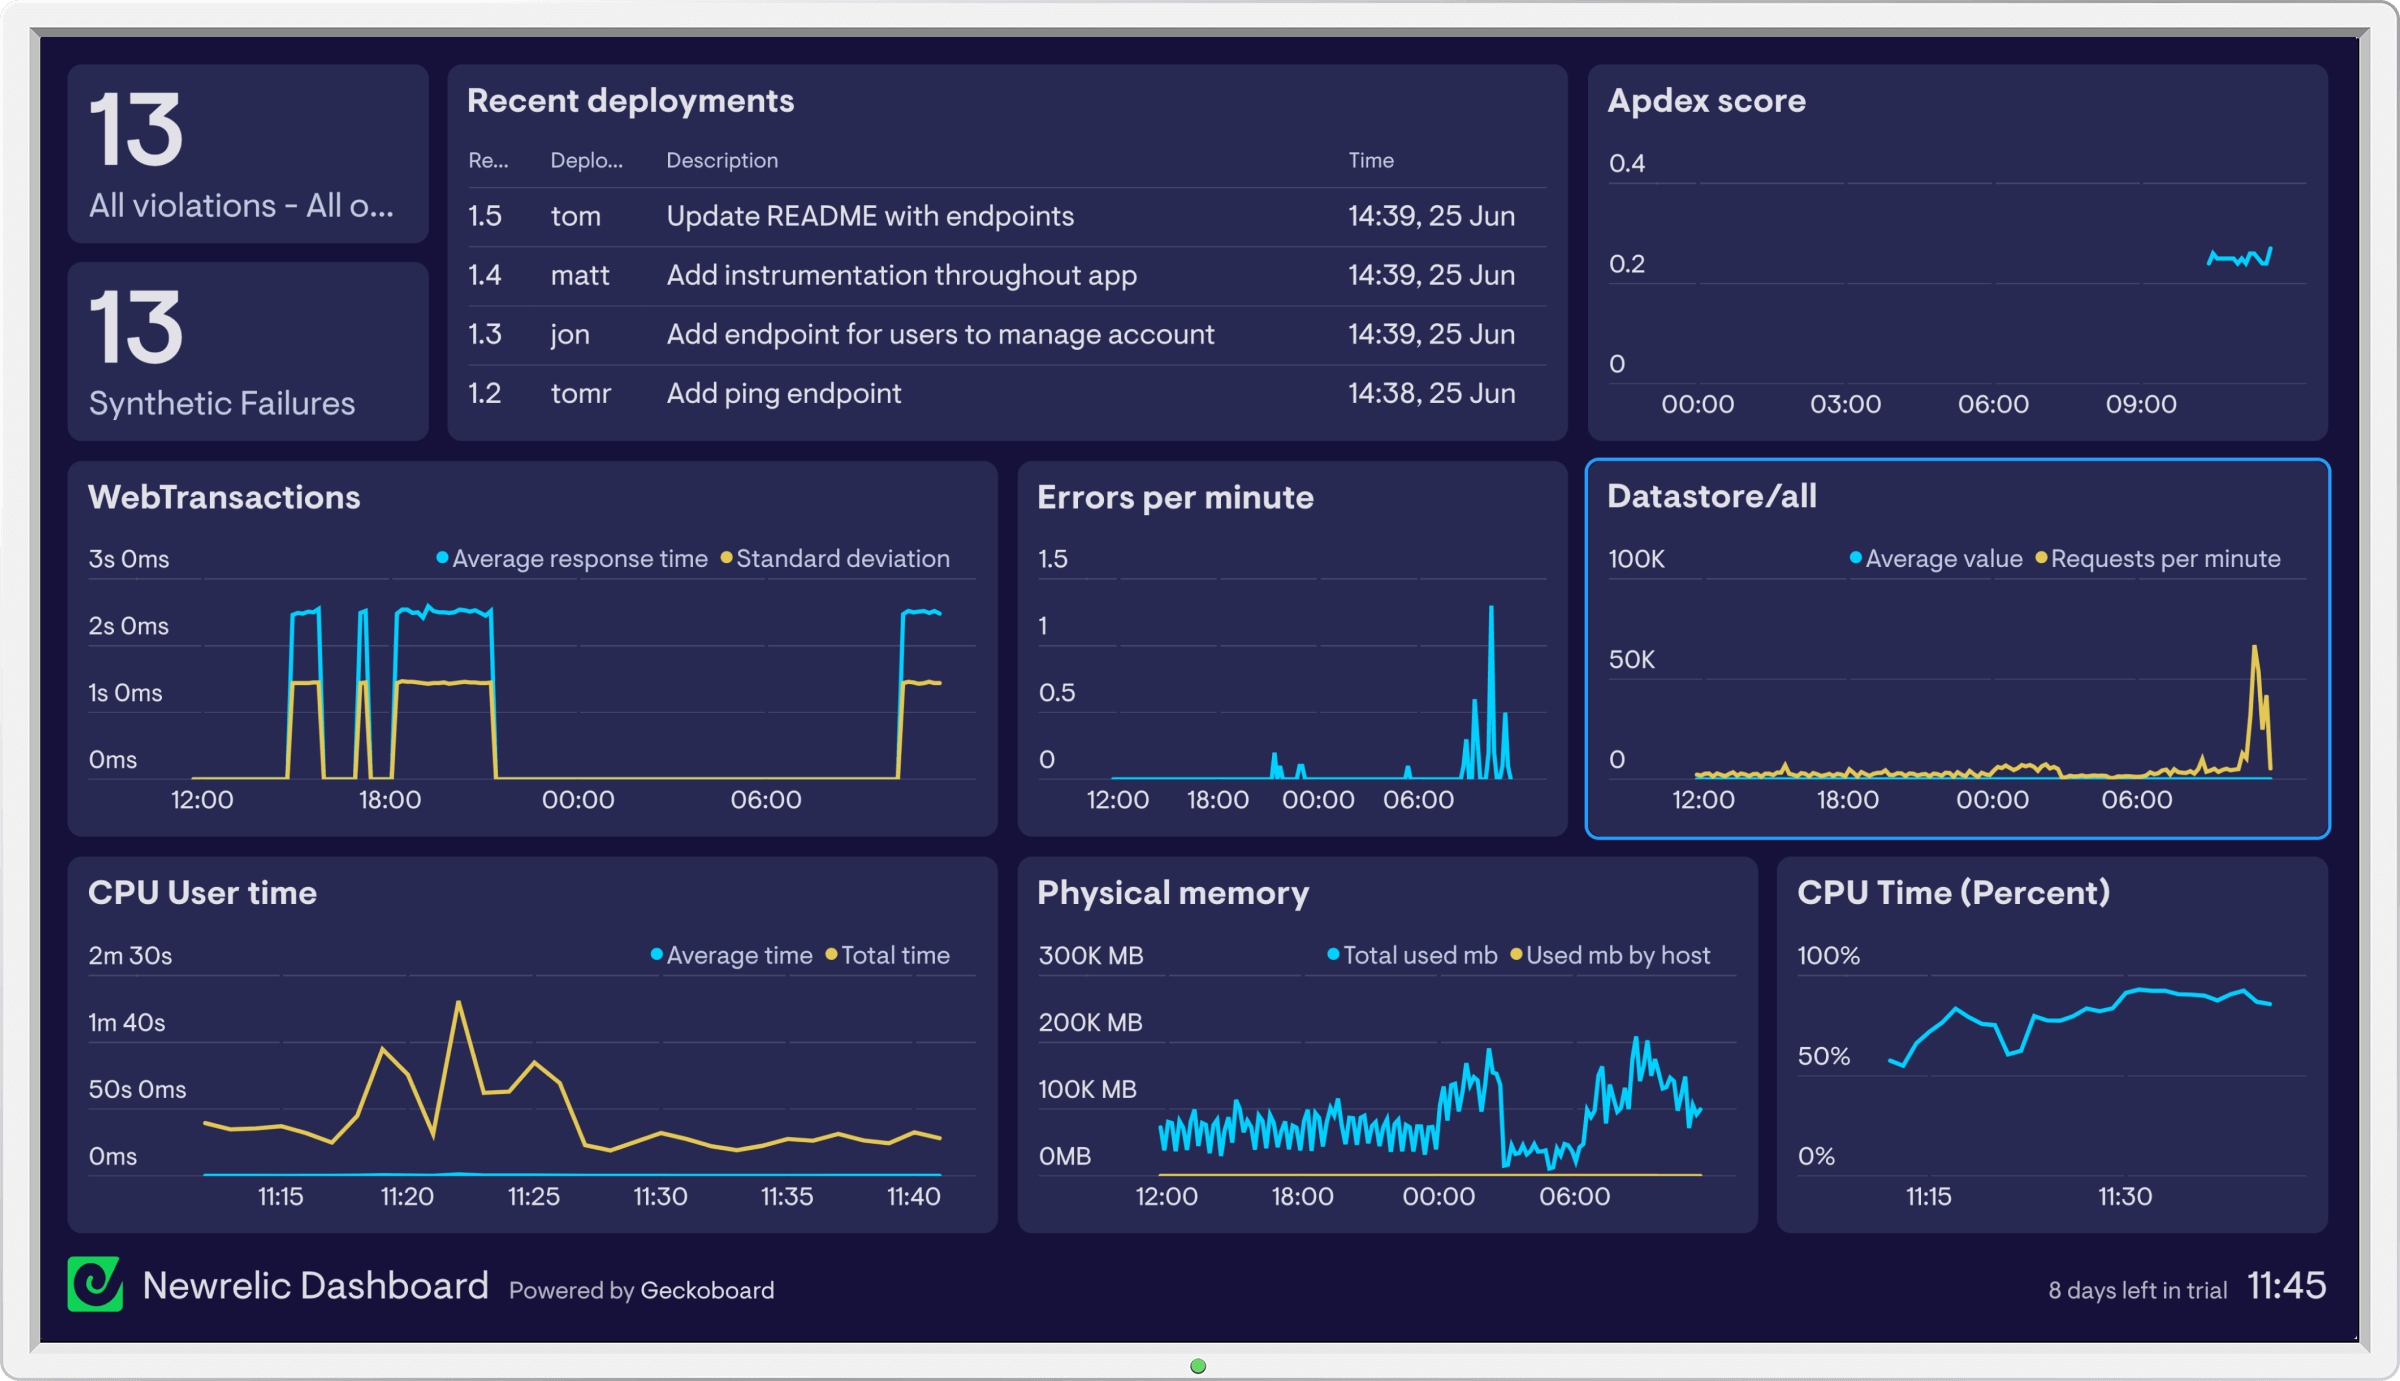
Geckoboard connects securely to your New Relic account, allowing you to create a TV dashboard for your team and make key performance metrics visible and understandable.
Supports both US and EU data regions
 Display important metrics on large screens for peace of mind and speedier response times when issues need addressing
- Full coverage of metrics for your web and mobile applications, including the ability to compare multiple metrics on one chart
- Also add metrics from other data sources to give your team a holistic view of your systems’ performance
Get the exact metrics you need with powerful filters
Geckoboard supports a range of important metrics, including:
Key metrics
 Apdex
Apdex- CPU
- Memory
- Response Time
- Errors
- And more...
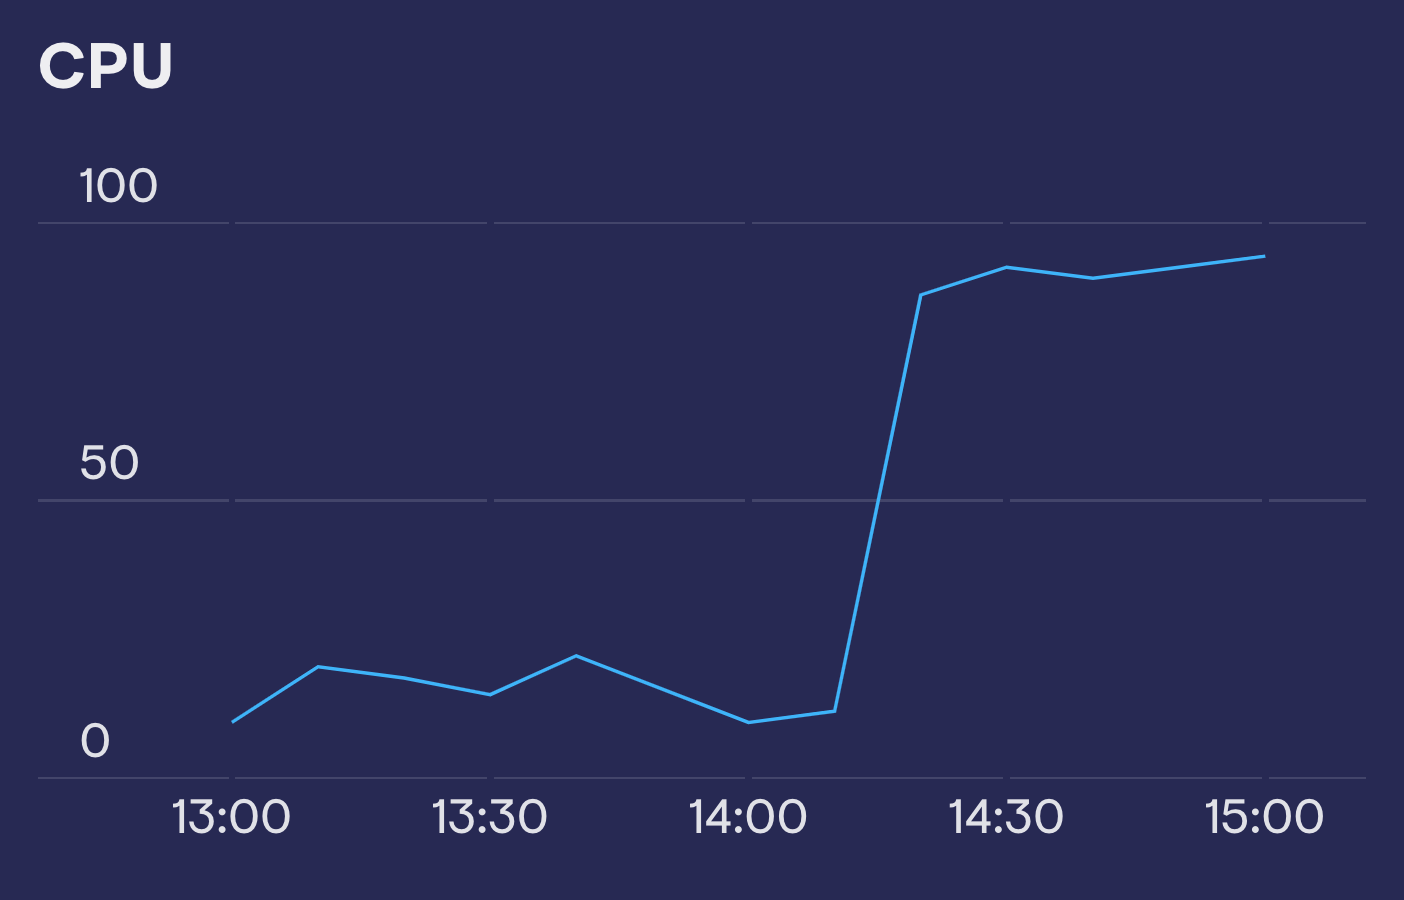
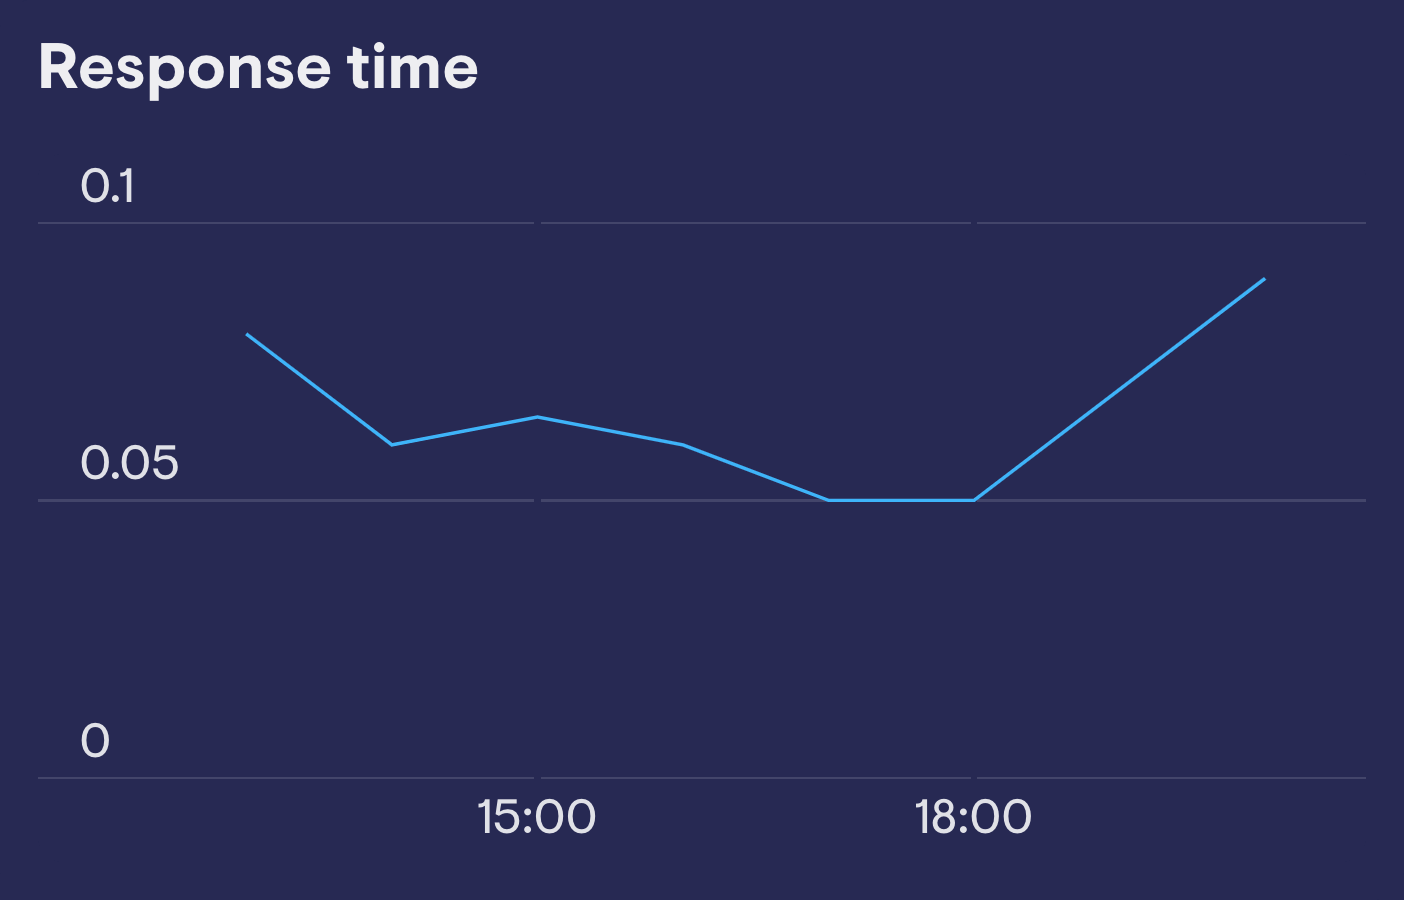
Choose from beautiful visualizations, like these:
CPU
Response Time
Add data from other sources to complete the picture