What is a sales opportunities dashboard?
A sales opportunities dashboard is designed to provide a quick snapshot of your prospective customers. An ‘opportunity’ generally refers to a customer who is more qualified than a ‘lead’ or a ‘prospect’ (but these terms do differ, place to place). As such, they tend to be used in more ‘high-touch’ sales roles where the sales team have a good sense of how well opportunities are progressing. These types of dashboards can cover a number of areas including how many opportunities you have, how you acquired them, how valuable they are, and at what stage they sit within the sales pipeline.
Sales Opportunities
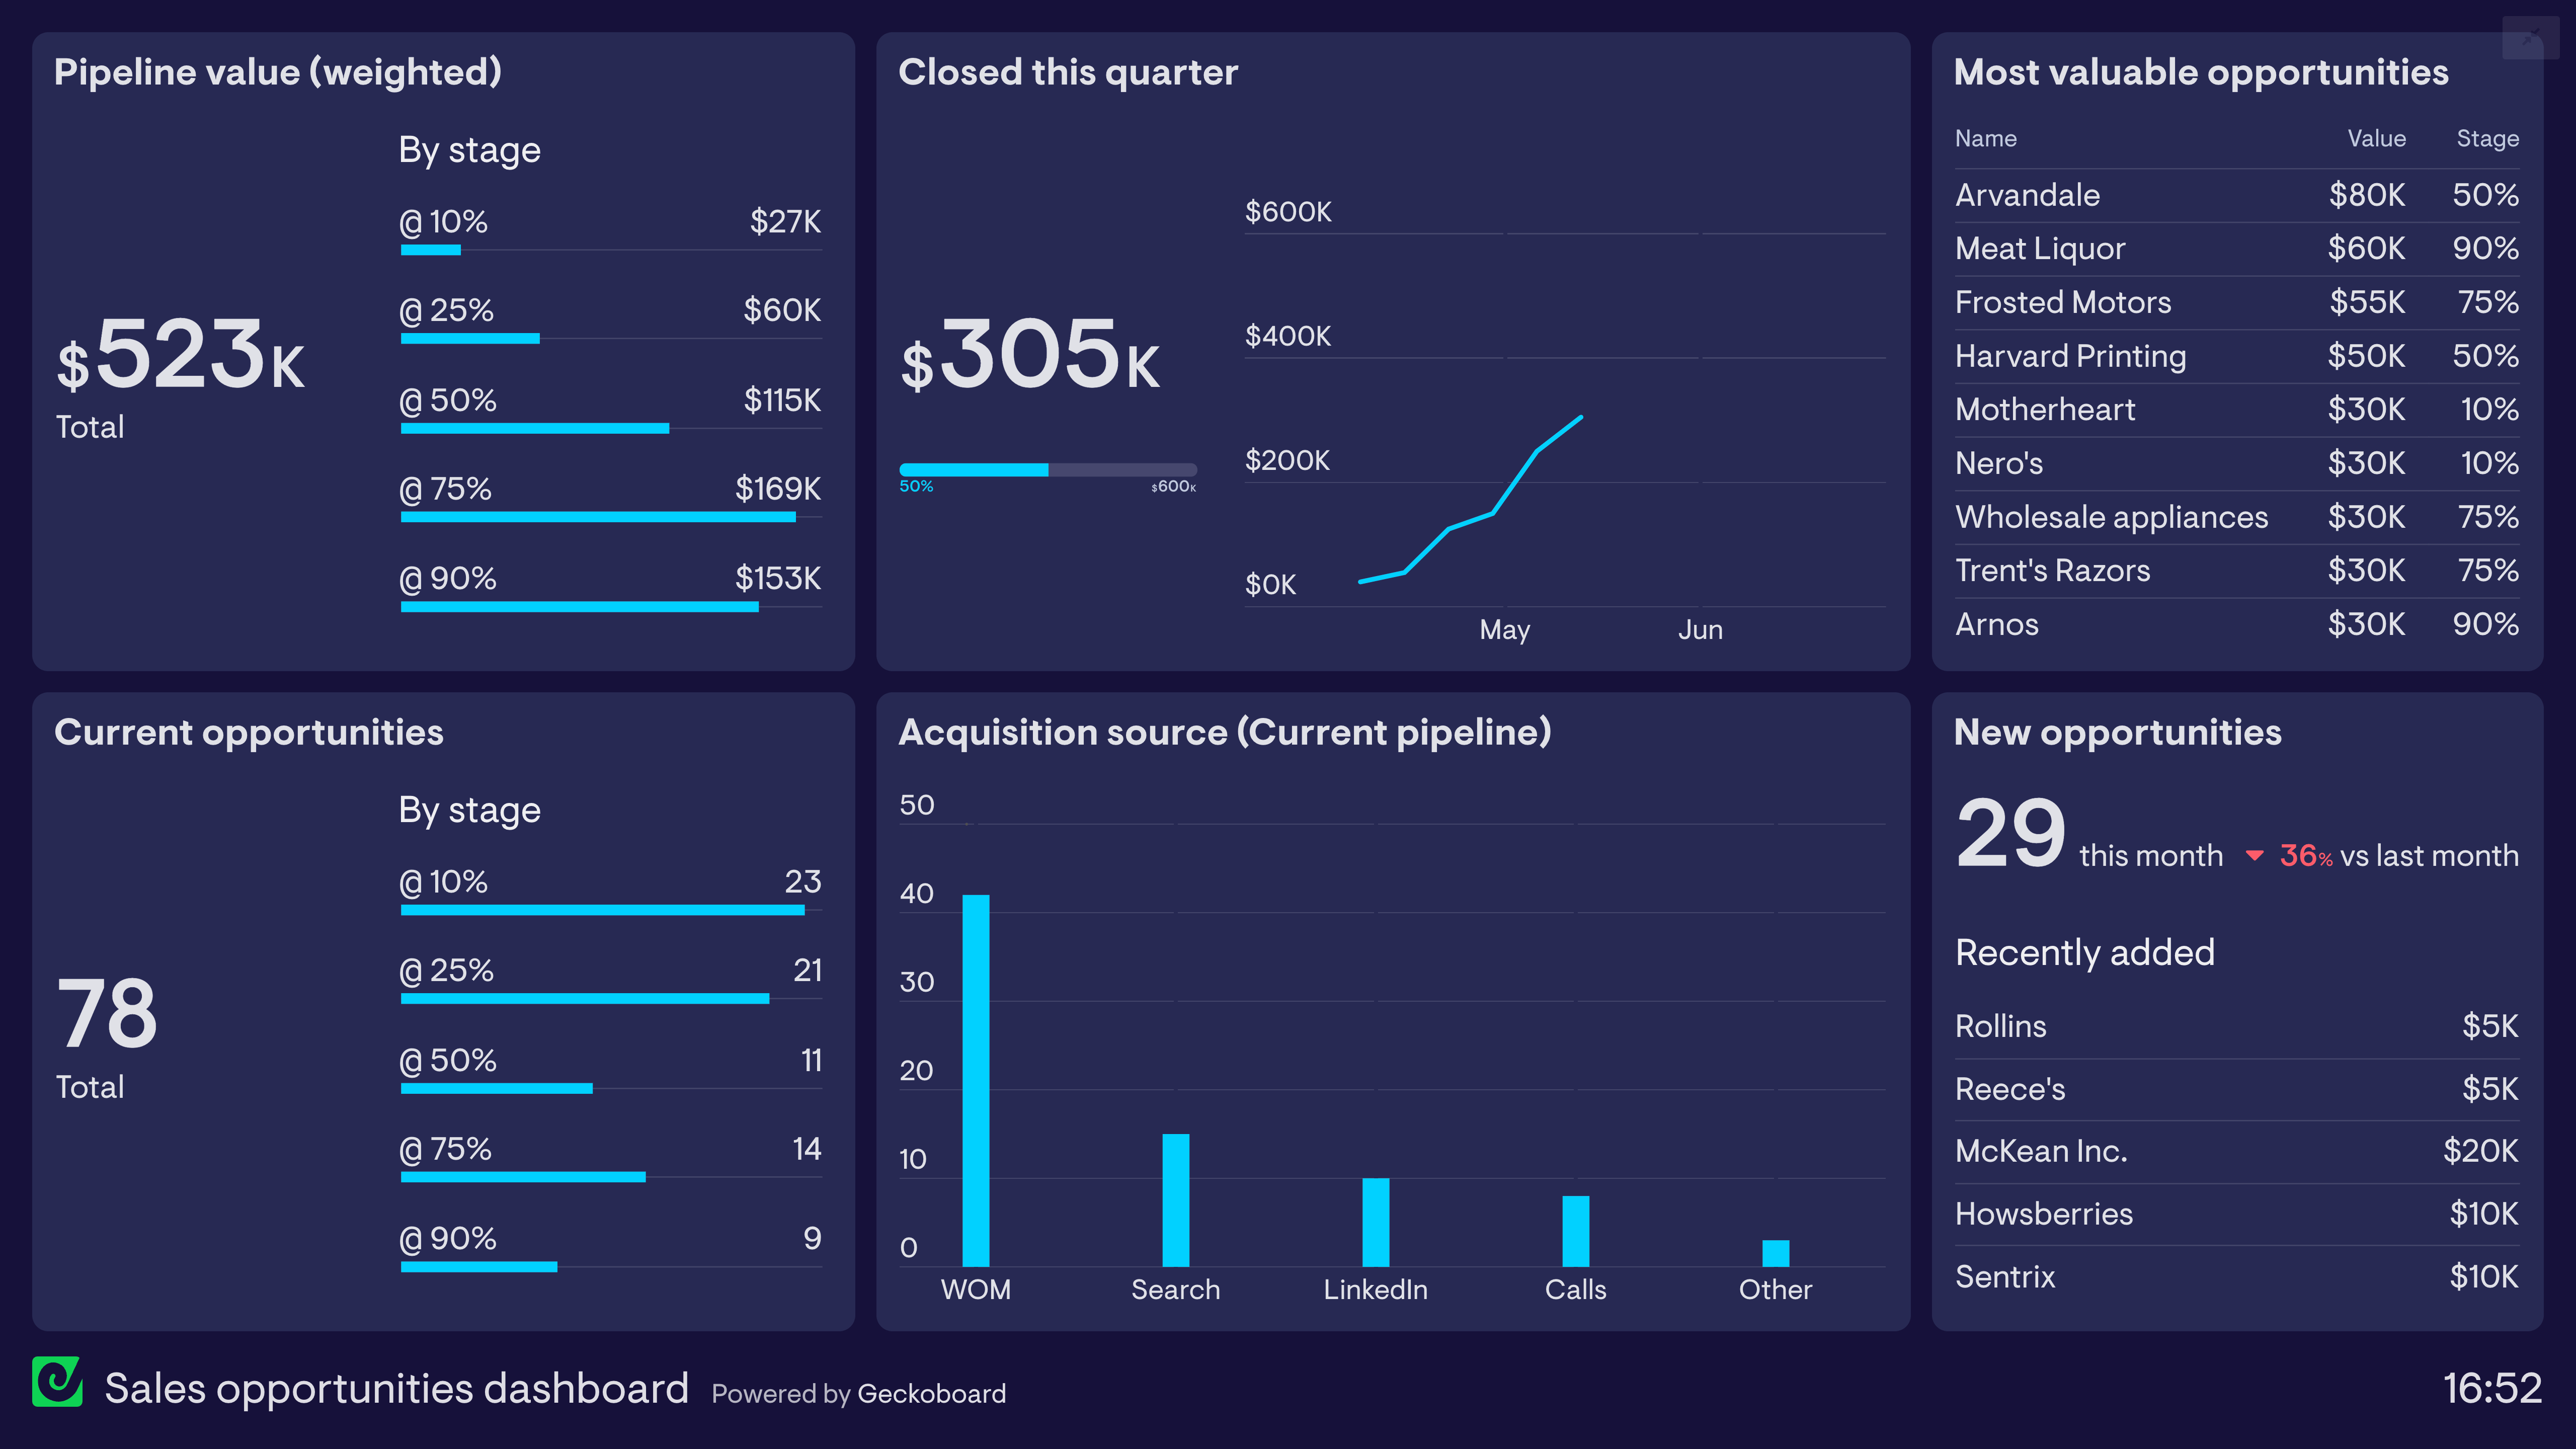
This dashboard focuses on the movement of sales opportunities through the pipeline. The members of the sales team will no doubt use a CRM system to record and keep track of their own opportunities. But they also use this live dashboard to make sure the entire team is regularly up to date on the full picture.
This dashboard uses pipeline weighting to give a more accurate picture of how much revenue the team can expect to convert. For example, $230k worth of opportunities at the 50% stage will be weighted at $115k, because there is a 50% chance they will convert.
In this example, it’s looking likely they will hit their quarterly target based on the value of late-stage opportunities in the pipeline (at 75% and 90%). But the lack of opportunities at the beginning of the pipeline will be more concerning. At least they’ll now be aware they need to prioritize this area, so they don’t run into trouble in the next quarter.
Focus area
Sales pipeline
Who looks at it?
Sales Director
How often?
At least once a week
- SalesforceSpreadsheetsSQL Database