Product updates

Revamped Aircall data source

We’re very excited to have shipped a new, revamped Aircall data source, bringing faster updates, new metrics and filters and the addition of Interactive View, making it even easier to keep on top of live queues using Geckoboard.

Read on for more detail, or check out this quick video summarising what’s new!


Really real-time updates

Aircall widgets built with our new integration now update the instant a call is made or when a user’s availability changes. This upgrade means teams can now see a truly real-time view of activity across their queues on desktop, mobile and TV.

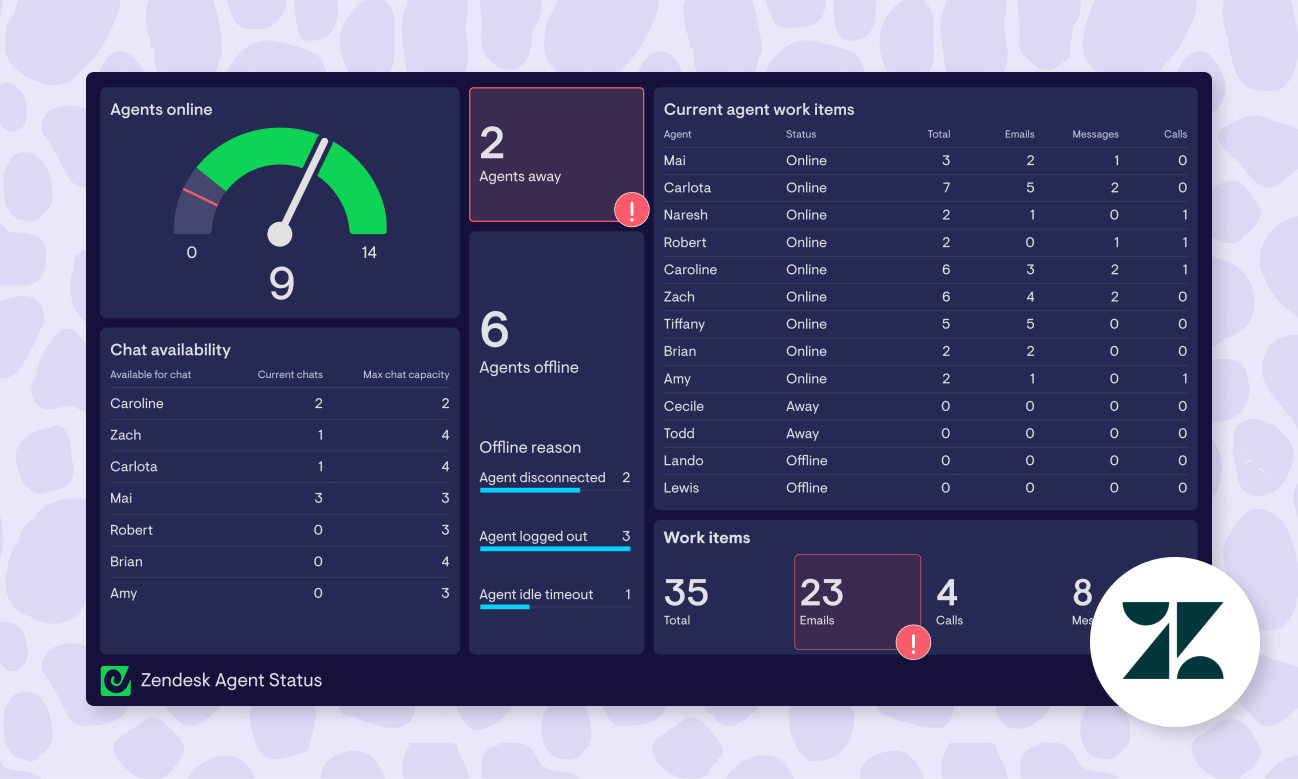
New live queue metrics

To make the most of this speed upgrade, our integration now supports several new metrics to help you monitor live queue activity: active calls, calls waiting, connected rate, longest call waiting and answer rate. We’ve also expanded the range of user statuses so you can now instantly see which specific users are online, offline, currently on a call, engaged in after-call work or set to do not disturb.

Filter by tag and team

Visualize more specific numbers with these two new filters, available on most metrics.

Improved widget-building experience

Building an Aircall widget now feels a lot more intuitive, and takes fewer clicks, with metrics now organized into categories spanning all calls, inbound calls, outbound calls, queue and agent metrics.

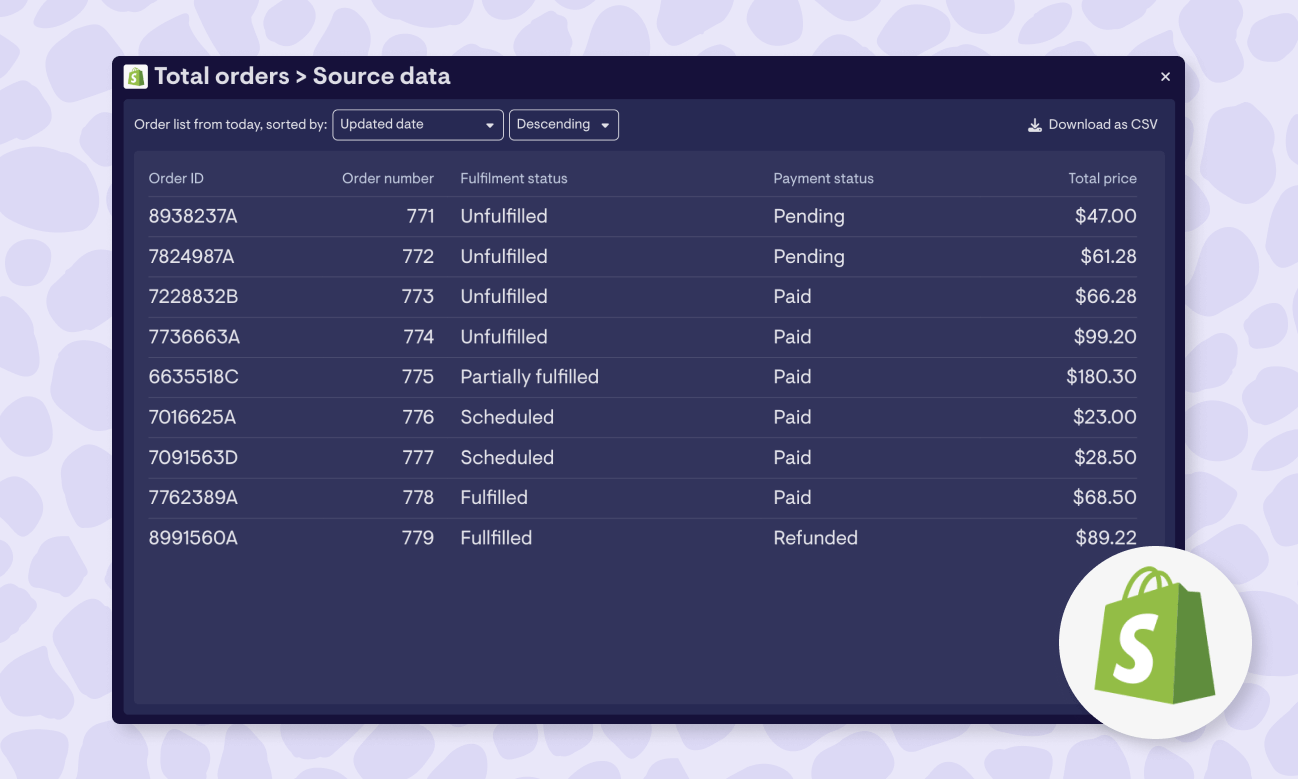
Drill down using Interactive View and see source data

Our revamped integration now supports Interactive View and Source data, allowing dashboard Admins to quickly investigate changes to an Aircall metric by drilling in to different dimensions and time periods, and seeing which calls have impacted the data. You can export call lists for further analysis as a .CSV file too.

How to access the new version

If you are already using Geckoboard’s Aircall data source we encourage you to migrate existing Aircall widgets over to the new version as soon as possible for the best experience going forwards.

If you’re new to Geckoboard, sign up for a free 14 day trial here, select the Aircall integration and follow the instructions to set up a connection.

Shopify data source improvements

We’ve shipped a range of improvements to our Shopify data source, including a new metric, a more useful Interactive View, and improved accuracy of some metrics.

Whats changed?

New Gross Sales metric: our integration now allows you to keep track of Gross Sales using a range of different visualizations. These can be broken down in a number of ways by filtering by specific product names, SKUs, locations, sales channels, tags and more.

See specific orders in Interactive View: dashboard admins can now use Interactive View to see which specific orders have impacted a metric. Click the new table icon on a Shopify widget, or ‘Source data’ whilst using Interactive View, and you can now see a list of orders associated with that metric. To make further investigation easier, you can click directly into those orders in Shopify itself, and download the raw data as a .CSV too.

shopify-orders-geckoboard.png

Faster updates: Shopify widgets now benefit from faster refresh rates, with some metrics updating the instant orders come in.

Improved data accuracy: We’ve fixed an issue that affected the accuracy of sales metrics broken out by product for some users.

Instagram Business data source

We’ve shipped a whole new Instagram Business data source, opening up a range of possibilities for tracking the growth and reach of your Instagram account with Geckoboard.

Connect your Instagram Business account and you can now visualize live metrics relating to the performance of your account, as well as individual posts, stories and reels. These include:

  • Current total followers
  • New followers for a given time period
  • Profile views
  • Total number of posts
  • Post reach (a specific post, or set to most recent)
  • Story impressions (specific story, or most recent)
  • Average watch time for a specific or most recent reel
  • Number of comments on specific or recent posts and reels
  • A feed of comments from posts and reels
  • …and many more.

instagram-data-source-geckoboard.png

The new data source also now takes advantage of many of the other features we’ve rolled out across Geckoboard in recent months, including:

  • A more intuitive widget-building experience, allowing you to preview your widget before adding it
  • Support for more visualization types
  • Presets for popular metric and visualization combinations
  • Support for Slack notifications when your Instagram metrics improve or drop-off

Log in to your Geckoboard account and select Instagram Business to give it spin!

NB: This data source supports Instagram Business accounts only.

Zendesk Agent Status metrics

We’ve added support for a range of real-time agent status metrics from Zendesk, with a new integration called Zendesk Agent Status.

For Zendesk setups with omnichannel routing rules at their core, this opens up many possibilities for accurately monitoring real-time agent workloads across Support, Talk, Messaging, and in some cases Chat, and agent availability to pick up additional work items.

live-zendesk-agent-status-dashboard.png

Some of the metrics now supported include:

  • Current agent status (online, offline, away, in transfer…)

  • Agents’ status broken out by channel

  • Total work items owned by each agent

  • Agent capacity, broken out by channel

…and more.

To access these new metrics, select Zendesk Agent Status from our list of data sources whilst logged into Geckoboard, and set up a connection to your Zendesk account.

Note: as this uses a specific API supplied by Zendesk, you’ll need to set this up as a new connection even if you’ve already connected via our Support, Chat, Talk or Sell data sources.

KPI notifications (Beta)

Never miss an important change to your key metrics, with our new, highly-requested feature: KPI notifications!

Get notified in Slack the minute your data hits a ‘success’ or ‘warning’ value, even if you don’t have your dashboard open. Perfect for letting everyone know when targets have been achieved, when a KPI is doing particularly well, or if performance has dropped off in a particular area.

How it works

  1. On a number or gauge widget*, set up a status indicator.

  2. Connect your Slack account if you haven’t already, and select the channel you’d like to push notifications to when success or warning values are triggered.

  3. You’ll now receive a notification in Slack when your metric enters or exits a success or warning state.

KPI-notifications-product-update.png

Got feedback? We’d love to hear what you like or don’t like about this early version of KPI notifications, so send your comments to our team using the ‘Help’ button in the top right of your account.

*Currently available on the following data sources: Activecampaign, Aircall, Airtable, Amplitude, Asana, Baremetrics. Campaign Monitor, ClickUp, Close, Copper, Databases, Datasets API, Delighted, Dixa. Dotdigital, Facebook Ads, Freshdesk, Freshservice, Google Analytics, Google Search Console, Gorgias, Help Scout, HubSpot, Intercom, Klaus, Klaviyo, Linear, Matomo, Monday, Nicereply, Orbit, Pipedrive, ProfitWell, QuickBooks, Redash, RringCentral, Satismeter, SendGrid, ShipStation, Shopify, Stripe, TikTok, Wistia, YouTube, Zendesk Support, Zendesk Chat, Zendesk Sell.

Updated Campaign Monitor data source

We’ve updated our Campaign Monitor data source to provide a more streamlined workflow when building or editing Campaign Monitor widgets. Re-written from the ground up, our integration now lets you visualize Active Subscriber Count for specific segments, and supports oAuth as a connection method too.

User activity metrics added to our Close data source

Our Close data source now supports user activity metrics, allowing you to break performance out for specific sales reps. This includes:

  • Number of meetings completed, declined or canceled for specific sales reps

  • Leads created and contacted

  • Opportunities created, won and lost

  • Value of opportunities won or lost

  • Call duration

  • …and more

More Zendesk SLA metrics for improved SLA monitoring

We’ve added a range of new SLA-related metrics to our Zendesk Support data source, aimed at helping support teams meet and exceed their SLA targets through better real-time monitoring.

Get an up-to-date overview of the current state of play with a live list of Tickets nearing SLA breach, as well as metrics like:

  • Number of active SLA tickets
  • Number of active unbreached SLA tickets
  • Number of active breached SLA tickets

Monitor how effectively your team is meeting expectations, with:

  • % of SLA targets achieved
  • % of SLA targets breached
  • Number of SLA targets achieved
  • Number of SLA targets breached

…and keep an eye on specific SLA policies, with a list of SLA targets too.

zd-sla-dashboard.png