Salesforce table visualization
Enrich your Salesforce dashboards with our brand new Salesforce table visualization!
Our new table visualization gives you the power to display columns from a tabular Salesforce report on your dashboard, just as they appear in Salesforce. Perfect for communicating more detail such as the names of accounts recently won, the names of opportunity owners, the value of individual deals or any other information or metric that’s set up in your Salesforce reports.
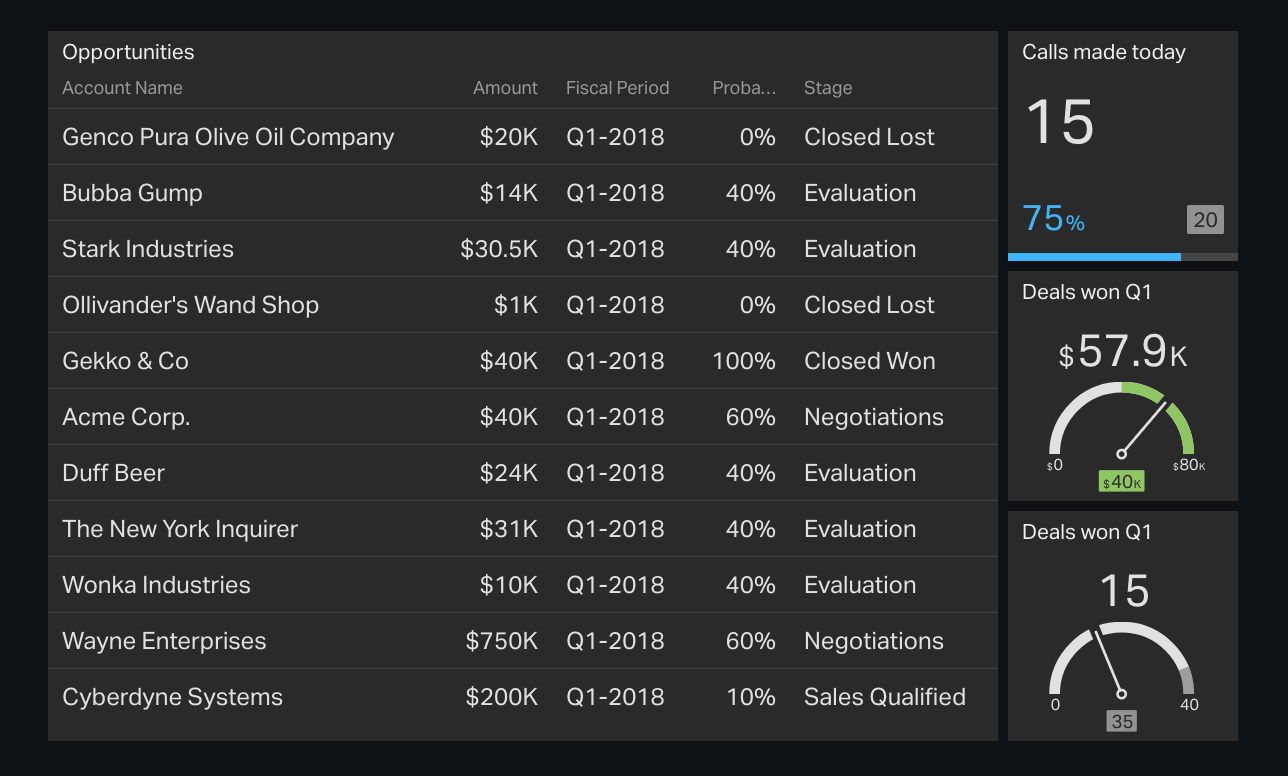
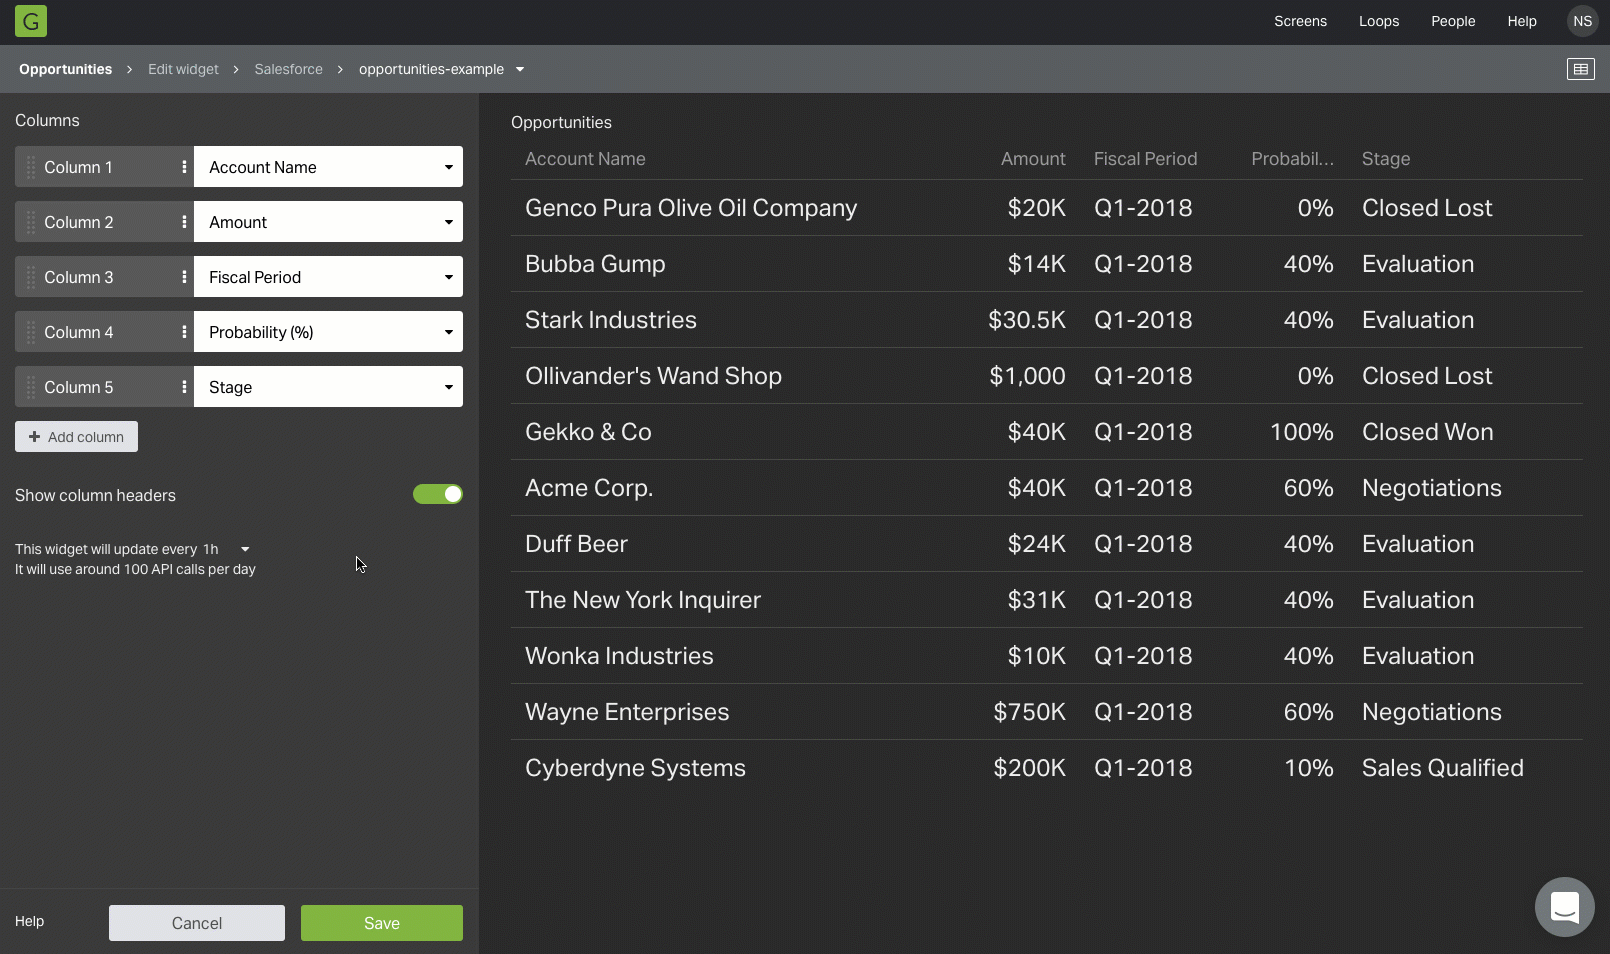
With this power comes responsibility, however. After all, adding whole tabular reports to your dashboard could introduce unnecessary distractions and cause a team to focus on the wrong things. That’s why we’ve made it easy to pick and choose which columns from your report are displayed in a table.
Need to reorder those columns? Just like in our Spreadsheets and Datasets table visualizations you can simply drag and drop them into the order you prefer right within Geckoboard, without affecting your original report.
We’re excited to know what you think!