
Since Snowflake launched as a company in 2012, it’s had a seismic impact on the data warehouse market, revolutionizing how businesses handle and analyze large volumes of data. Its cloud-native architecture offers scalability and flexibility – distinguishing it from traditional on-premise solutions.
This article will explore how you can quickly and easily visualize your Snowflake data in the form of a KPI dashboard.
Why create a KPI dashboard?
Unlike more in-depth business reporting, KPI dashboards are designed to help businesses keep track of their most important high-level metrics in real time.
They’re popular with senior managers who want to build a data-driven culture. That’s because not only does the dashboard help surface important changes, it also creates more awareness and buy-in within the company as a whole. Especially if the dashboard is very visible.
This can be a great source of engagement with team members who gain a better understanding of how important business metrics change over time.
The options
Naturally, like any data warehouse, there are several data visualization options available. These include established BI tools like Tableau, as well as highly customizable data visualization tools such as Grafana.
Today however, we’re going to explore a solution that will take the legwork out of creating dashboards, and save you time – Geckoboard.
Why use Geckoboard?
Geckoboard was originally designed as a no-code solution, connecting to business tools like Salesforce and Zendesk. However, it does have a very useful database integration, which connects to SQL databases such as MySQL, Amazon Redshift and Snowflake.
Geckoboard isn’t a BI tool, so if you’re looking for a solution where you can conduct deep dives and analysis, then you’re better off using a tool like Power BI.
Where Geckoboard excels is if you need to create a real-time dashboard that can be shared with team members via a link, or permanently displayed on a TV.
It’s easy to connect Snowflake to Geckoboard and quickly design a dashboard in around 15 minutes.
It’s also very useful for businesses who want to display Snowflake metrics alongside metrics from other data sources like Google Analytics, Salesforce and Zendesk. (Just imagine having to connect these additional business tools to your data warehouse with an API for the sake of a few metrics. It can hardly seem worth the hassle!)
With Geckoboard however, you can display Snowflake data alongside metrics from over 90 data sources, without virtually any setup time required.
How to create a Snowflake dashboard
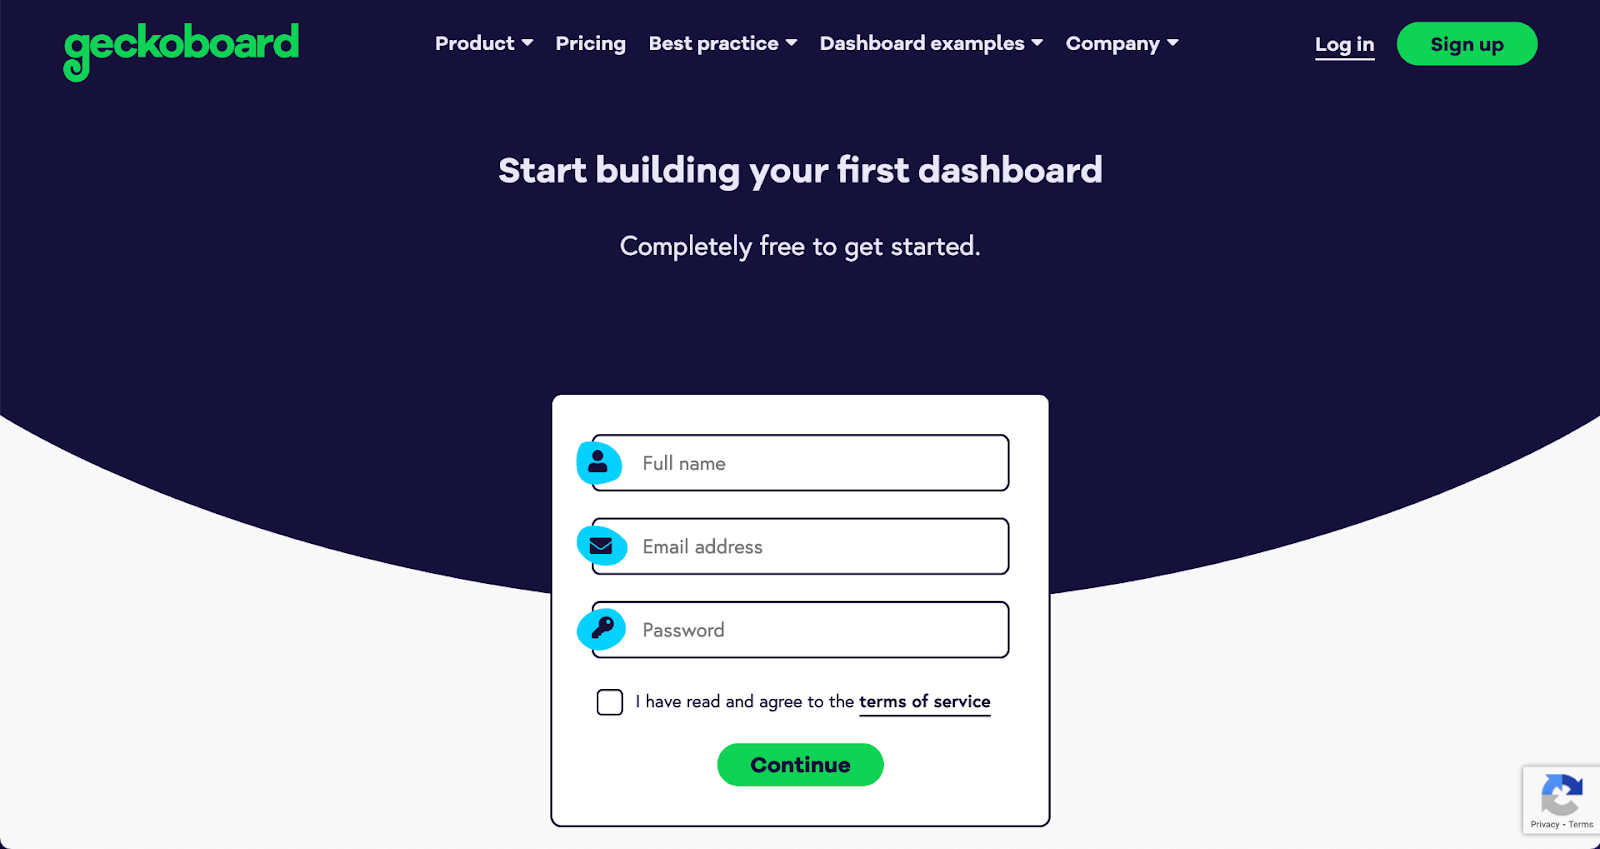
Step 1: Signup to Geckoboard
Sign up for a 14-day free trial – no credit card required.
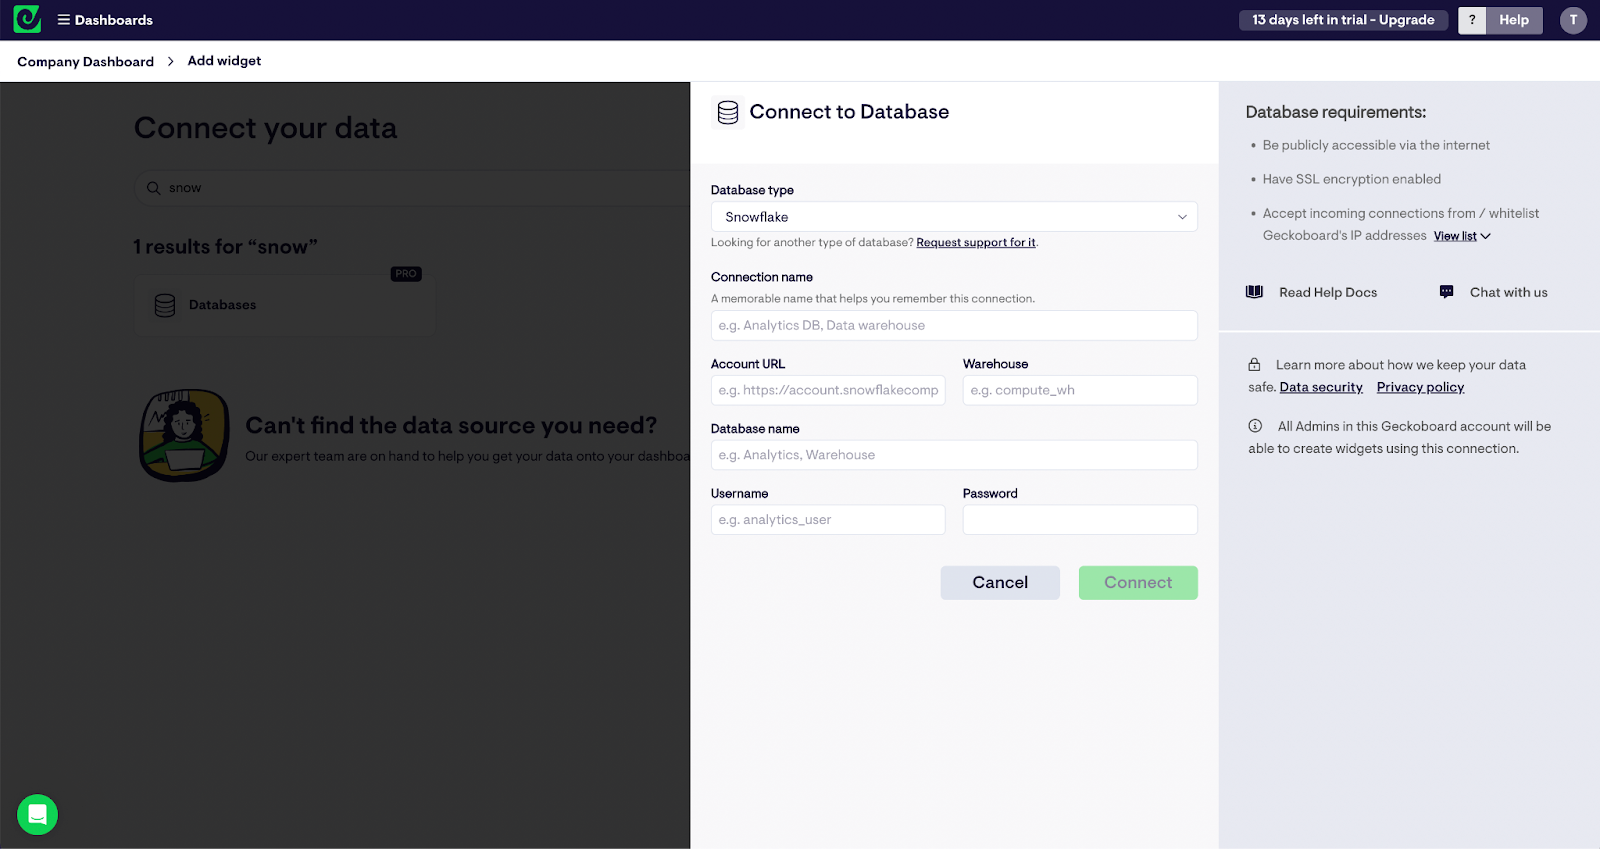
Step 2: Connect your Snowflake account
Next you will be presented with a series of data sources. Select 'databases' then select Snowflake. Here you’ll have the opportunity to connect your Snowflake database.
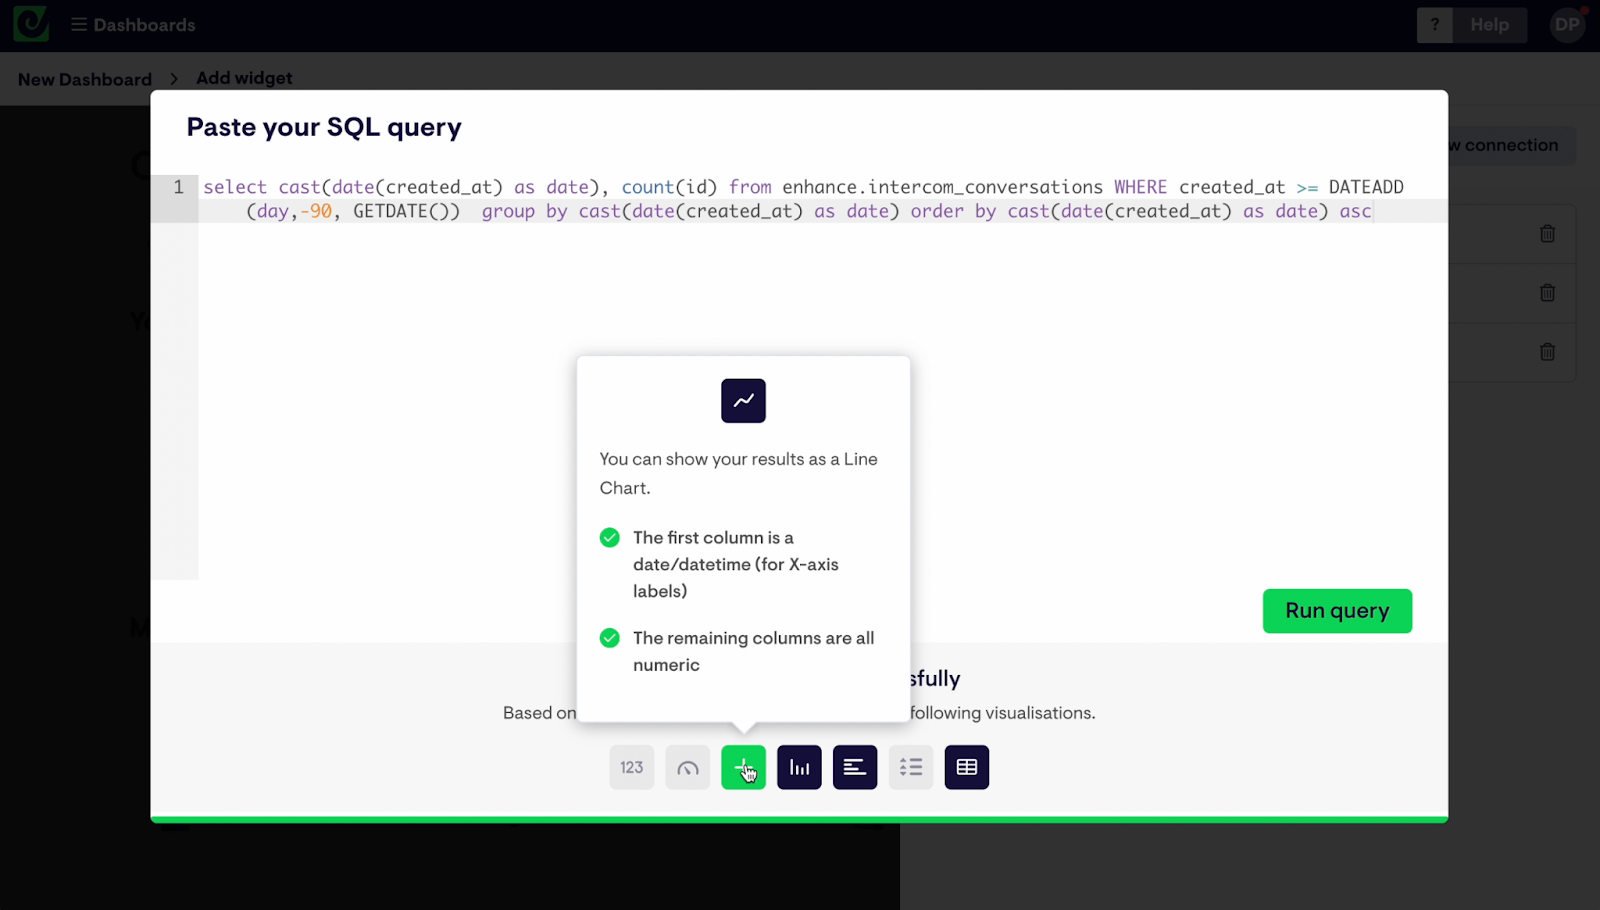
Step 3: Add a widget to your dashboard
Once a connection to your database has been created, you can start creating visualizations, or ‘widgets’ – these include numbers, bar charts, line charts, and leaderboards.
To build a widget you just need to paste a SQL query, then select the visualization type you want.
You can then rename, resize and move your widget where you want on the dashboard by simply dragging and dropping.
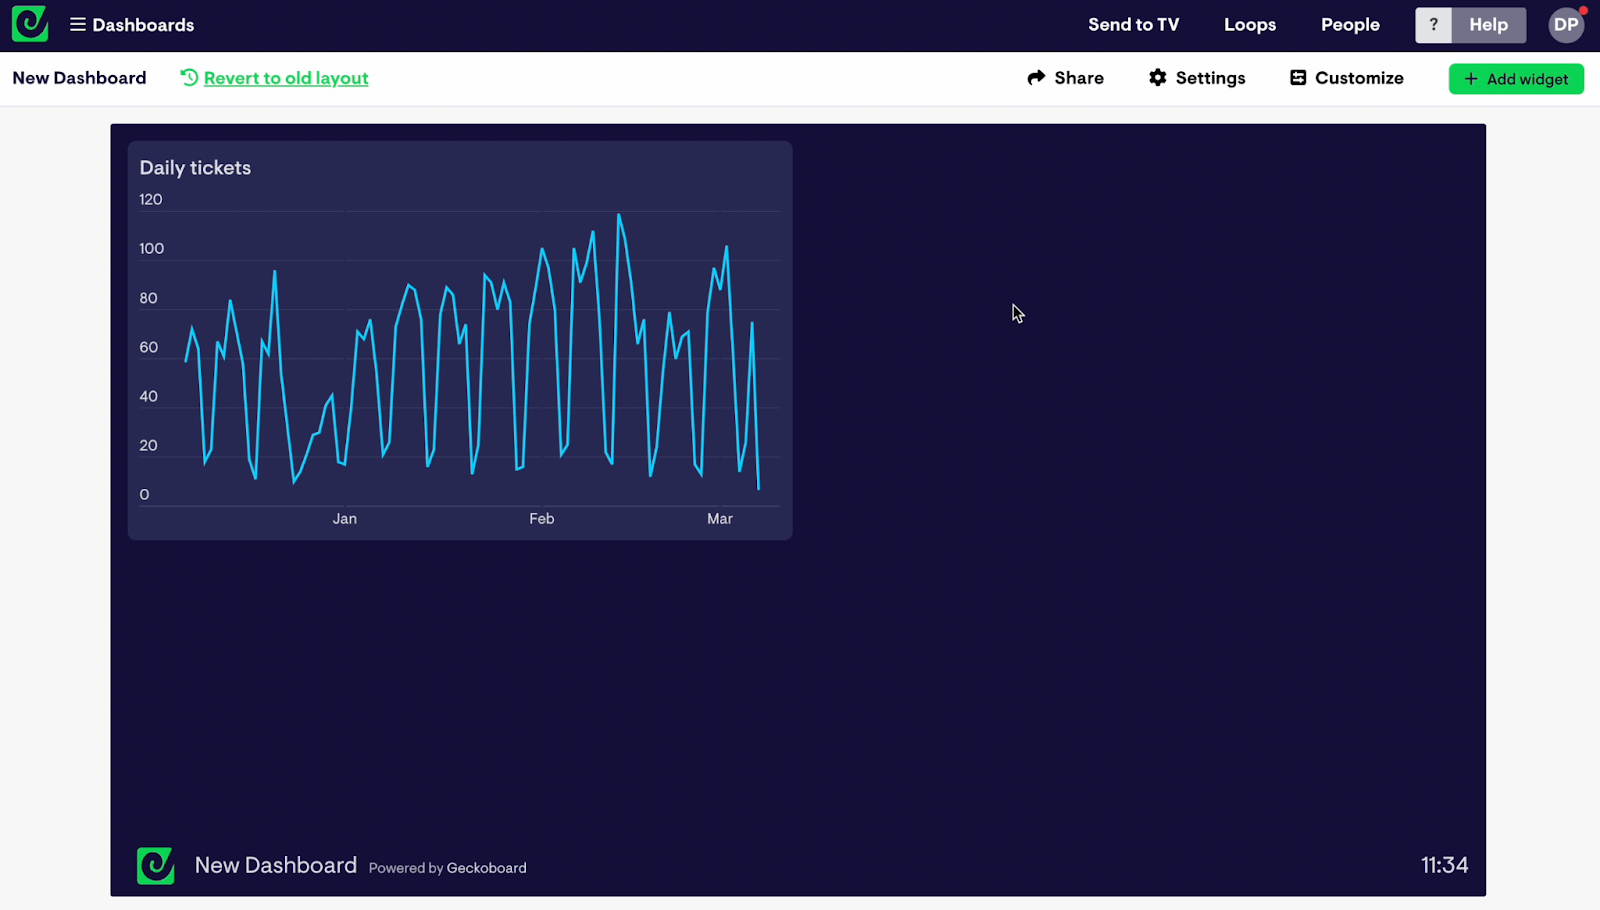
Step 4: Build up your dashboard by adding more widgets
Once you’ve built your first widget, you can start to add more, building up a dashboard that shows your company KPIs in a layout that makes sense to you. You can complete the picture by adding widgets which visualize data from over 90 other data sources including Google Analytics, Shopify, or even other SQL databases.
Step 5: Share your dashboard
The best part about Geckoboard is how easy it is to share your dashboard. You can display it on a TV using our Send to TV feature. You can create a sharing link. Or you can schedule snapshots and reports to be sent to email and Slack.
This can be incredibly effective at breaking down the barriers in how the wider company gains access data and KPIs.

Try Geckoboard
Try Geckoboard for free by signing up a 14 day free trial.
