
With AI assistants like Claude and ChatGPT becoming more deeply integrated into knowledge work I wanted to run a like-for-like comparison in a competency close to my heart: data analysis. I was specifically interested in benchmarking how Claude and ChatGPT natively performed and compared against each other on a realistic support analysis problem; the sort of task a customer support or operations manager might do on any given day.
For the test, both AI assistants had access to the same Geckoboard Metrics MCP server with the same live dataset of Zendesk tickets from a fictional sporting goods retailer. Both models were tested identically against a seven stage brief designed to reflect the process from broad discovery through focused investigation and asset production, ending with a reflective self-audit of their own process. Here are the exact prompts I used.
- Orientation: What can I analyse in our Zendesk connection through Geckoboard?
- Broad review: Review support performance in the past 4 weeks against the previous 4 weeks. What deserves attention?
- Focused investigation: Investigate the reopened tickets. Check where it was concentrated by time and supported dimensions. Compare volume and a relevant outcome metric
- Interpretation: Separate what the data establishes from plausible explanations. What should the support leader check next?
- A visual: Create the clearest visual explanation for a weekly operating review. Choose the format.
- A sharable artifact: Turn this into the most useful shareable artifact for tomorrow’s review. Choose the format.
- Self-audit: Audit the analysis. List the queried metrics, scope, returned values, calculations, assumptions and limitations. Correct any unsupported claim.
Test process
I ran the same prompts in the same sequence against both services three times each for a total of six runs. It was important that the runs were conducted in isolation so there was no chance of prompts or responses leaking between runs. For Claude I used incognito chats that don’t create any memories in an account that had no prior related chats or memories. I couldn’t get private chats in ChatGPT to use the MCP connection so I ran the prompts on a fresh account with memories turned off and deleted each run before starting the next.
Some limitations:
- Exact model and reasoning mode used were Claude: Opus 5 Medium, ChatGPT: 5.6 Sol Medium
- 3 runs per product, so this is not an exhaustive test and the findings should be viewed as descriptive.
- It tested native behaviour only. No skills, memories of similar tasks, or additional prompts were given.
- I overwrote one artifact each from ChatGPT and Claude and couldn’t recover them because I’d deleted the chats before I realised.
I took the full chat plus any charts or artifacts from each run and split it into two files: the first containing steps 1-6 and the second just step 7. This would allow the pre- and post-self-audit steps to be assessed separately later on.
Now, I’ll be the first to admit that I went a little overboard for what was supposed to be a simple exercise designed to probe the approach, competency and general feel of AI assistants. But there was a textual analysis component needed in evaluating this test so, yup, I threw another AI assistant into the mix.
The files were blinded and handed to a new Claude account (model: Opus 5 High) which first extracted the claims made in the chat and visualisations from each run, then accessed the Geckoboard Metrics MCP server to recreate and log the exact response returned and compare it to the data that each run had reported was returned. It also extracted 30 metric definition records to establish what the returned fields actually mean. This second part turned out to be important because not checking metric definitions caused several defects in the real runs. For example, the denominator for the metric “% rated tickets” is “number of surveys offered,” not “number of tickets solved,” as one of the runs assumed.
Each claim was assessed based on how well it could be verified by the data returned from a directly reproduced query. The scores were broken down by data accuracy, analytical depth, thoroughness, visualisation, artifact quality and reliability. I told you it was over the top but by now I was already committed!
The last task of each run was a self-audit; the claims produced by this were assessed separately in the same way.
Results
Let’s start with the headline
Pre-audit shared analytical score: ChatGPT 82.9%, Claude 83.7%.
Post-audit: ChatGPT 83.7%, Claude 91.3%
The detailed results are as follows.
Colour-coded scoring table for six benchmark runs across six categories, before and after the self-audit stage. Cells are tinted blue where the score is a high share of the category maximum and red where it is low.
Before audit
| Run | Data /30 |
Depth /20 |
Thor. /15 |
Visual /15 |
Artifact /15 |
Rel. /4 |
Shared /84 |
Total |
|---|---|---|---|---|---|---|---|---|
| ChatGPT 1 B-05 |
22 | 17 | 14 | 12 | 13 | 4 | 69 | 82/99 |
| ChatGPT 2 B-02 |
24 | 18 | 14 | 12 | NC | 4 | 72 | 72/84 |
| ChatGPT 3 B-01 |
26 | 15 | 11 | 12 | 14 | 4 | 68 | 82/99 |
| Claude 1 B-03 |
22 | 18 | 12 | 12 | NC | 4 | 68 | 68/84 |
| Claude 2 B-06 |
20 | 18 | 14 | 14 | 9 | 3 | 69 | 78/99 |
| Claude 3 B-04 |
26 | 17 | 14 | 13 | 12 | 4 | 74 | 86/99 |
After audit
| Run | Data /30 |
Depth /20 |
Thor. /15 |
Visual /15 |
Artifact /15 |
Rel. /4 |
Shared /84 |
Total |
|---|---|---|---|---|---|---|---|---|
| ChatGPT 1 B-05 |
26 | 18 | 14 | 12 | 13 | 4 | 74 | 87/99 |
| ChatGPT 2 B-02 |
20 | 18 | 14 | 12 | NC | 4 | 68 | 68/84 |
| ChatGPT 3 B-01 |
22 | 18 | 13 | 12 | 14 | 4 | 69 | 83/99 |
| Claude 1 B-03 |
30 | 20 | 14 | 12 | 15 | 4 | 80 | 95/99 |
| Claude 2 B-06 |
26 | 19 | 14 | 13 | 4 | 3 | 75 | 79/99 |
| Claude 3 B-04 |
26 | 18 | 14 | 13 | 8 | 4 | 75 | 83/99 |
NC is not scoreable and excluded from the denominator, not zero. Efficiency is NC for all six runs, so reliability is out of 4. Totals are shown uncoloured because their denominators differ.
Of the 417 claims made, both models were close to flawless on the one thing everyone is concerned about with these tools: they did not hallucinate numbers or mess up arithmetic (except for Claude’s 3rd run which reported 188 additional ticket reopens when the correct difference was 148 due to a basic calculation error). The reason for this is simple: in almost all cases they simply returned the number given to them by the Geckoboard Metrics MCP which extracts the granular data from the APIs it connects to and transforms it into business metrics ready to be queried. This division of responsibilities, where the Geckoboard metrics engine handles the data pipeline and metric preparation and the AI assistant focuses on analysis, is faster, more token efficient and most importantly more trustworthy than tasking the AI assistant to extract (in this case) tens of thousands of tickets, updates and ratings and then calculate metrics.
Neither model returned incorrect numbers and nothing was hidden, but both tended to make mistakes in framing or interpretation. This includes the example above where it made assumptions about the denominator used in metric calculations or allowed ambiguities around time periods. For example, they were prompted to compare metrics from the past 4 weeks to the previous 4. All runs asked for two things separately:
- A week-by-week series showing the totals for each week.
- A total value for “the last 4 weeks,” which returns as one number with no dates.
The analysis was conducted on a Thursday so the most recent week was incomplete. Every run correctly left the short week off their charts or explicitly called it out as a partial week but several runs did not do the same for the total values. They ended up comparing 3.5 weeks with the previous four weeks, which made the output look like it had fallen by 10%; however, based on complete weeks only it had actually risen by about 7%.
These framing and interpretation issues were the most common issue with all of the analysis carried out. Both models were reliable at retrieving results but unreliable at properly contextualizing them. In other words, the numbers were correct but the meaning of the numbers was sometimes incorrect. They then proceeded to make statements which looked very plausible but risked overstating the causal effects. As usual with AI assistants, the confidence and composure of the claim is often the same whether it’s rooted in evidence or assumption.
Natively, both models were keen to get on with the more dynamic work of interrogating the data, slicing and dicing and less inclined to do the underlying drudge work of analysis: clarifying the question, understanding what analysis would help answer it, naming the denominator behind a rate, and separating out zero, null, missing and unsupported values.
To me, both models resembled a colleague who is fast and has a good understanding of theory but has no skin in the game, no real ownership. The purpose seems to be output vs adequate process. They’ll give you what you ask for and it’s often very polished but without the care and attention needed to instill confidence.
Thankfully, this category of problem doesn't depend on model advancements to be fixed; it can be eliminated with a good process using explicit instructions. This can take the form of a well-crafted prompt, instructions in a project folder or skills. I’ve included some examples below that essentially eliminated this category of error across this analysis.
Model differences
Claude tended to over-reach more but then corrected itself more readily. All four critical defects across all runs came from Claude. It also tended to self-correct before the self-audit. The overreach tended to happen at stage 3 (focused investigation) and was withdrawn in the next stage (interpretation). It builds a plausible sounding story and then takes it apart at the next stage.
Claude’s first run illustrates this perfectly: it put forward six overstatements including its main conclusion only to withdraw every one of them with the correct reason given in the next stage. It got there by itself in the end but if you had stopped the process at stage 3 you would’ve been badly misled.
ChatGPT didn’t overreach but also tended not to self-correct as often. There was only one overclaim across all 3 runs and its first attempts at producing artifacts were consistently strong if a little uninspiring. That said, it didn’t surface as much in the self-audit, in fact it even went further in a couple of cases saying it had checked and verified an incorrect comparison.
Model persona
In terms of persona, to my mind Claude’s seemed keener, more narrative driven, more compelling in its justifications, livelier, more open to deeper self-correction, and less stuck in its ways. This is totally subjective of course, but its character seemed somehow younger.
ChatGPT on the other hand came across as drier, more procedural and steadier. It was less likely to go all-in on a narrative early doors in a cavalier fashion. It tended to take a fixed approach but was less inclined to step back and see the bigger picture. It came across as cautious in its approach even when it came to self-auditing where it seemed more concerned with defending the process it had used than questioning any assumptions it had made about metric definitions and framing.
Visualisations
This is a purely personal preference because both tools produced visualisations that were easy to understand. I preferred the style of Claude’s artifacts and charts but ChatGPT’s were solid and provided in formats easier to modify and share.
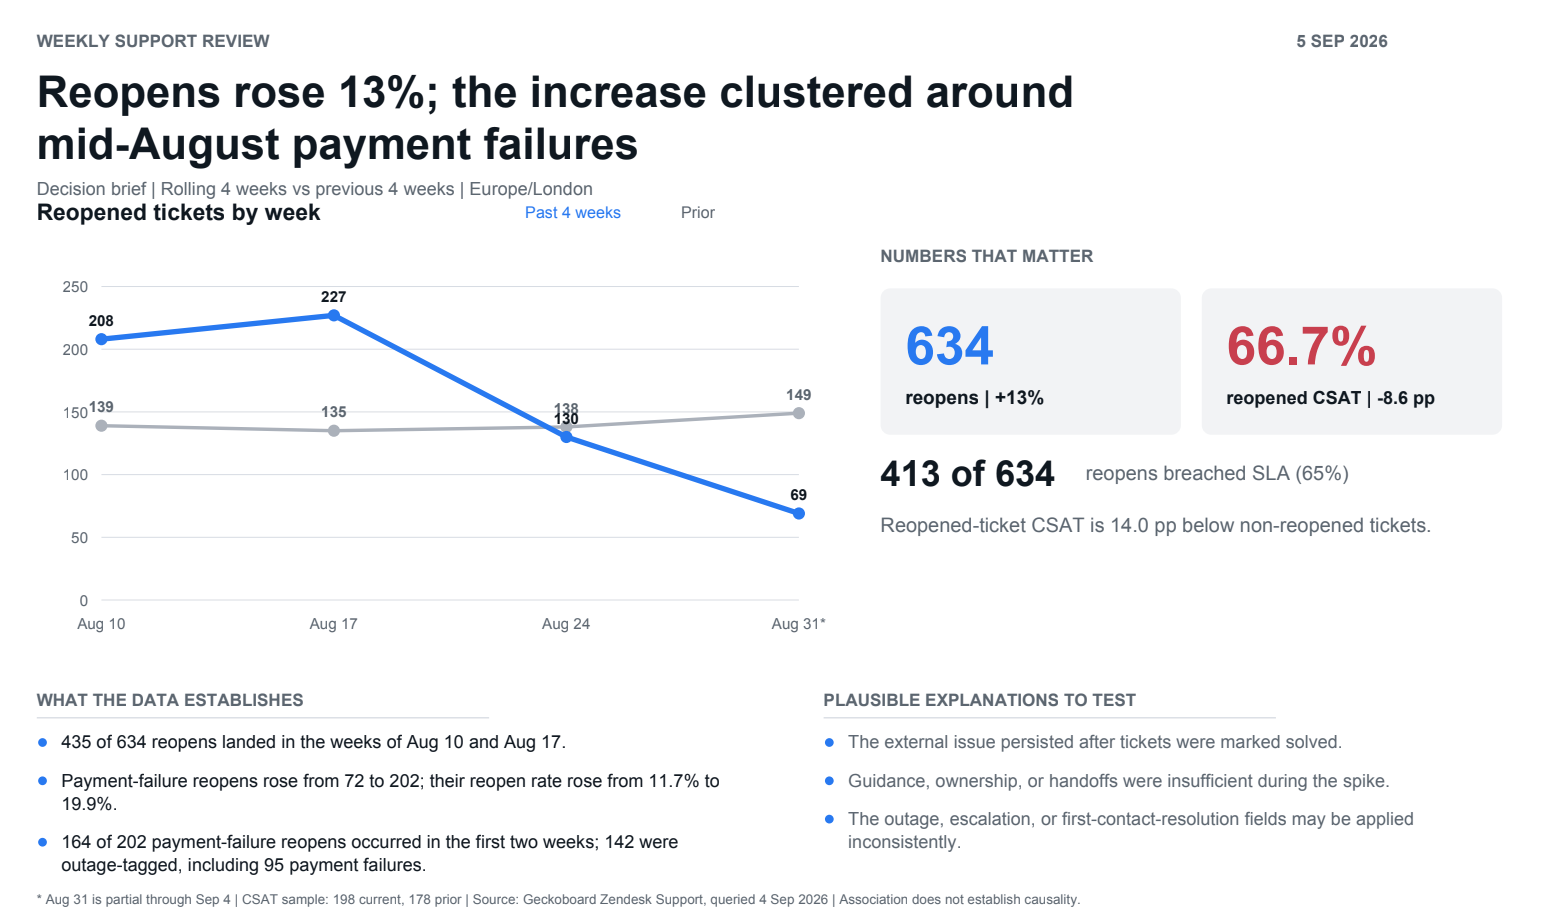
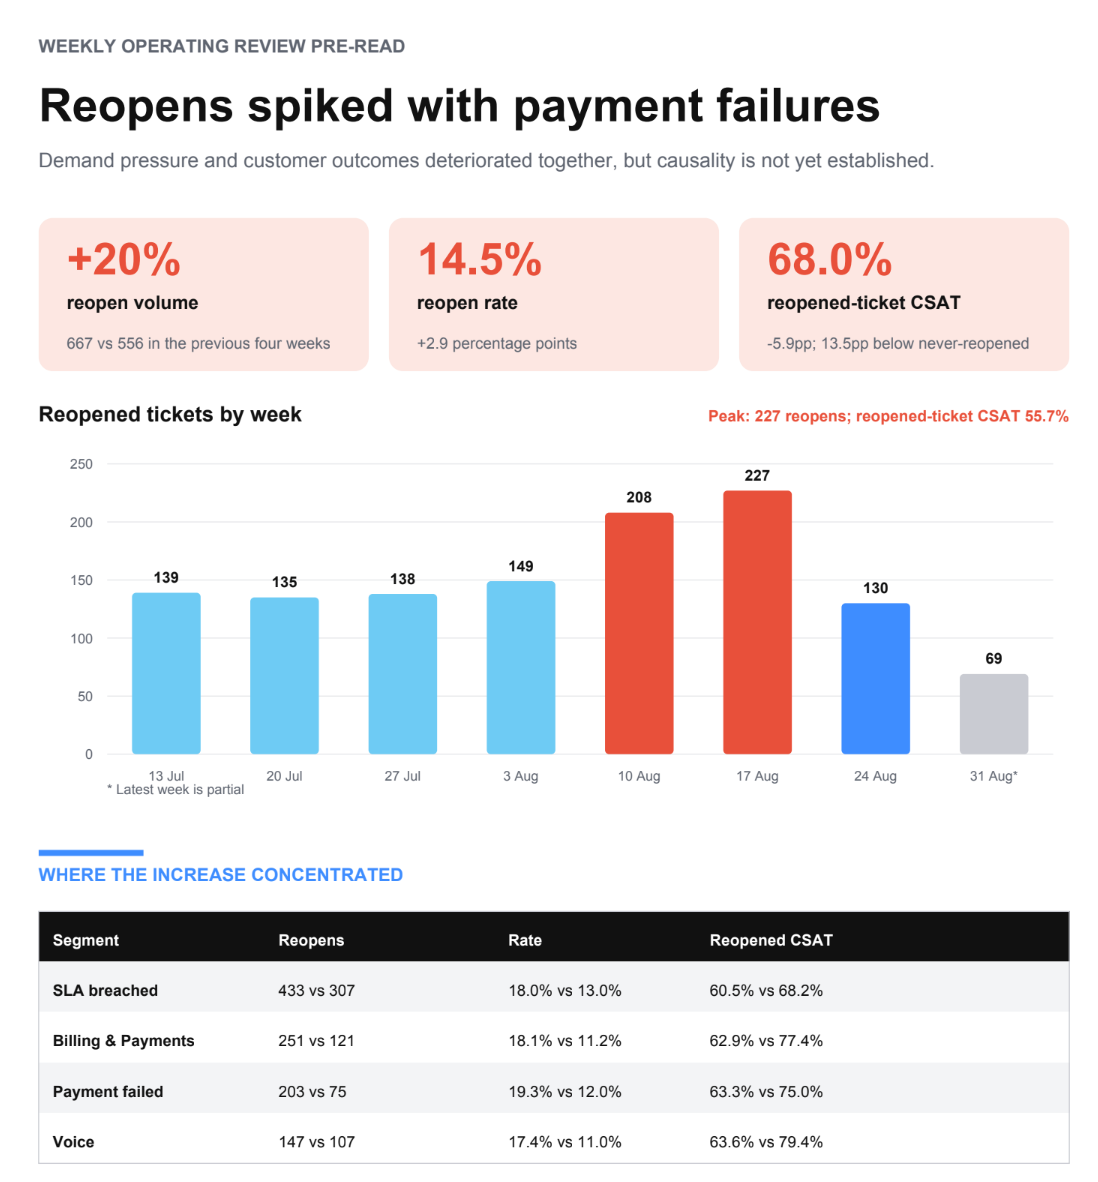
Visualisations produced by ChatGPT
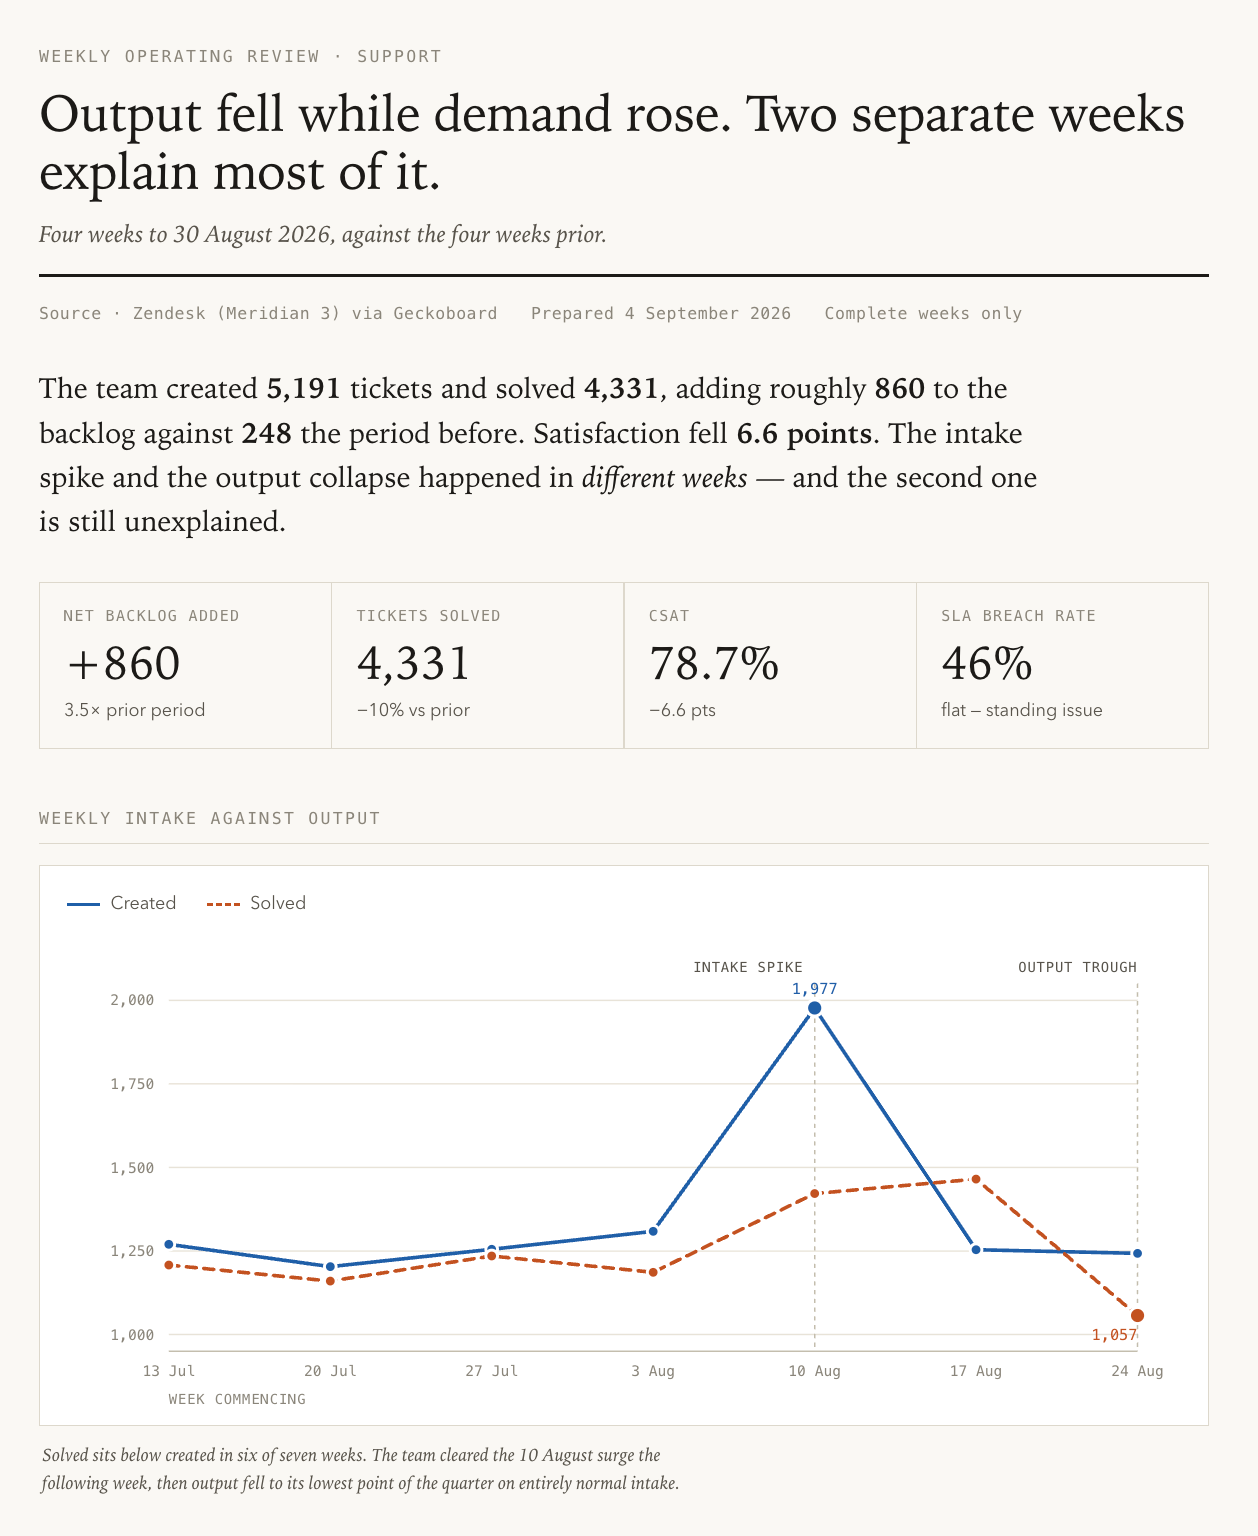
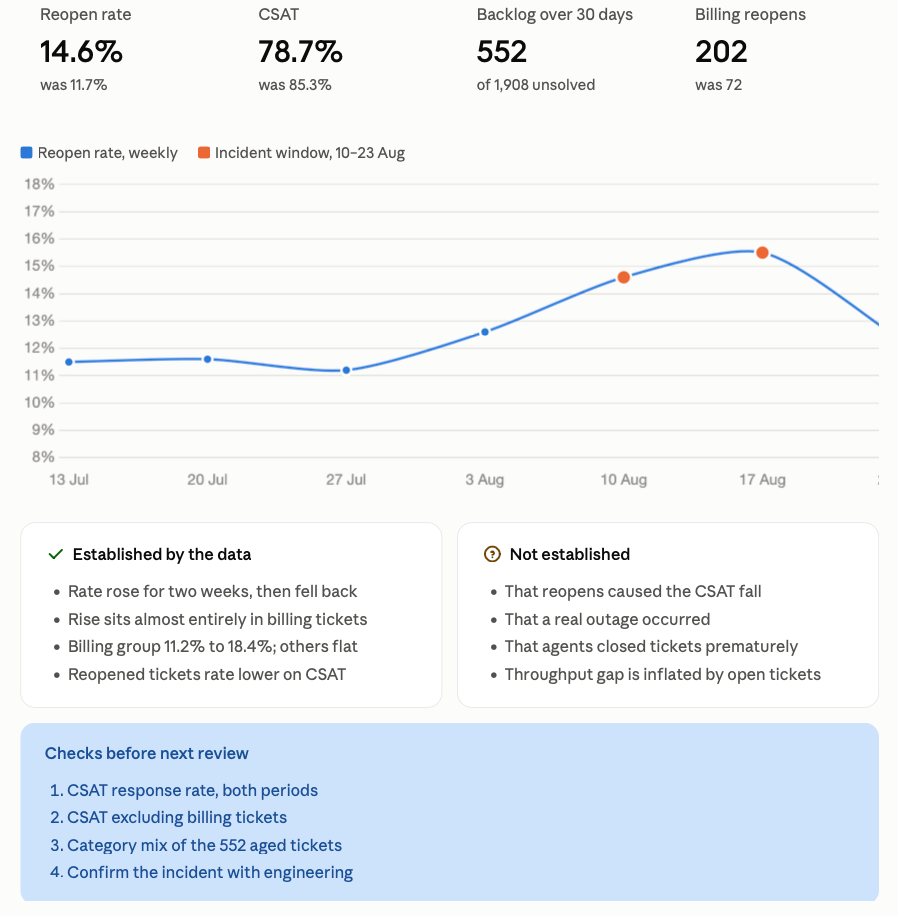
Visualisations produced by Claude
Conclusion
Both models proved excellent in speed, breadth of analysis and communication when given access to high quality, pre-computed metrics. Both tools have far more in common than not and share the same blind spots. Although there were flashes of excellence, neither reliably applied the rigour and discipline around evidence that a good human analyst would without being explicitly prompted.
Thankfully, we don’t have to wait for better models to fix the shortcomings that surfaced. Knowing their blind spots and having run a few post analysis trials I’m confident that all issues can be resolved by explicitly instructing the AI assistant to fix its analysis process and explicitly state terms.
Below is an example prompt that, although not tested as thoroughly as above (I’m tokenmaxxed!) has proven effective in both Claude and ChatGPT at remedying the identified problems and, interestingly, achieving a usable analysis faster using the same prompt sequence as in the test. It is perfect for ad-hoc questions and occasional analysis.
If you find yourself using it often, I’ve attached a skill for each tool below, which will be more convenient than copying and pasting the prompt each time. The skill has the advantage of applying increasing rigour depending on the task: Light (one or two metrics, low-risk decisions, concise answers), Medium (more complex metrics with multiple dimensions and time periods) and Audited (causal analysis, multiple sources, creating sharable artifacts).
Analyse this question using the connected data:
[INSERT QUESTION]
Before interpreting the results:
- Resolve relative dates into exact periods and state the timezone.
- Confirm the metric definitions, population, filters, aggregation and denominator.
- Check whether the comparison periods have equal exposure and whether any period is incomplete.
- Keep counts, rates, populations and metric event dates distinct.
- Reconcile headline totals with any time-series or breakdown results. Flag non-additive dimensions, missing data, small samples and failed queries.
- Do not infer intersections, causes or missing values that were not directly tested.
- Recalculate every derived figure.

In the answer, separate:
1. What the source returned.
2. What you calculated.
3. What the evidence reasonably suggests.
4. What remains unknown.
5. What should be checked next.

If you create a chart or file, verify its values, dates, labels and scope against the source. If you correct the analysis, update the file too.
Prefer a few well-supported findings over a confident but weak story.Skill installation:
- ChatGPT: upload the ChatGPT ZIP through Plugins → Skills → Create → Upload, where Skills are available. See OpenAI’s Skills documentation.
- Claude: go to Customize → Skills, create or add a skill, then upload the Claude ZIP. See Claude’s custom-skill documentation.

