It’s nearly the most wonderful time of the year! This means ecommerce businesses everywhere are revving up for their busiest (and hopefully most profitable) season - the Christmas holidays. To aid in your preparation for Black Friday, Cyber Monday, and the shopping days leading up to Christmas, we’ve put together a list of essential metrics for every ecommerce company to track.
These metrics will keep you and your team informed on overall performance, potential opportunities, and trouble spots so you can take action immediately. Give your customers the best experience and grow your company by tracking these eight key ecommerce metrics throughout the holiday season.
1. Website Uptime
What is it?
Website Uptime measures your website’s performance and reliability. It highlights whenever the site crashes or underperforms due to high volumes of traffic.
Why track this metric throughout the holiday season?
Website Uptime is critical because if your site is down, you can’t generate revenue. Time is money, especially on Cyber Monday. Ecommerce sites are more prone to crash throughout the holiday season due to significantly increased traffic from special promotions and discounts. By tracking Website Uptime, you can monitor and quickly fix any issues that may arise.
“To prevent Cyber Monday-inflicted disasters, your current hosting platform needs to handle periods of high demand and implement the right tools, so visiting and shopping on your site is a great experience for customers.” - Kenna Paulos, Director of Marketing at BlackMesh
How to calculate it
The best way to monitor Website Uptime is to use a site monitoring service (like Pingdom or something similar). For a DIY option, you can use Google Sheets and Google Analytics to track uptime.

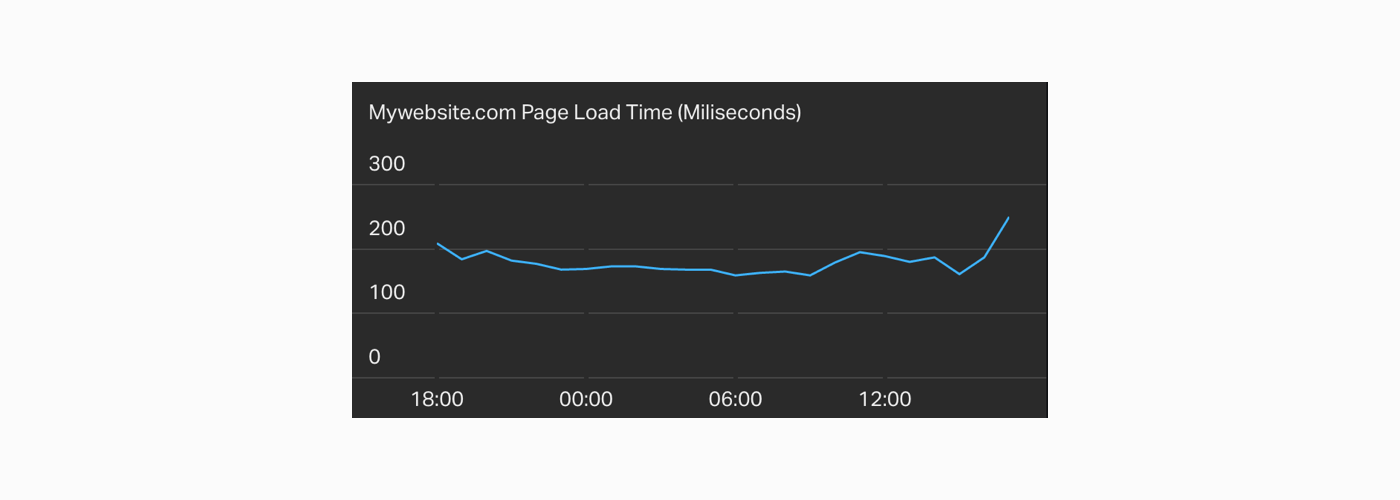
2. Page Load Time
What is it?
The Page Load Time is the amount of time it takes for your website to load for a visitor.
Why track this metric over the holiday season?
Having a short Page Load Time is a fundamental expectation for online shoppers. Tracking this metric ensures you can fix any issues immediately before losing traffic, and ultimately, revenue. This is particularly essential for high-traffic days like Black Friday and Cyber Monday. If your site is down or loading slowly for just 30 minutes, you could lose a significant amount of revenue.
“A 1-second delay in page response can result in a 7% reduction in conversions. If an ecommerce site is making $100,000 per day, a 1 second page delay could potentially cost you $2.5 million in lost sales every year.” - Sean Work, VP of Inbound Marketing at Crazy Egg
“According to surveys done by Akamai and Gomez.com, nearly half of web users expect a site to load in 2 seconds or less, and they tend to abandon a site that isn’t loaded within 3 seconds. 79% of web shoppers who have trouble with website performance say they won’t return to the site to buy again and around 44% of them would tell a friend if they had a poor experience shopping online.” - Sherice Jacob, Founder of iElectrify
How to calculate it
In order to track Page Load Time, you’ll need to use an analytics tool (such as Google Analytics or something like Pingdom). See here and here for more detailed information on how to track this.
3. On-site Search Terms
What is it?
On-site Search Terms are the words or phrases that visitors or customers type into your site search. These terms are an indication of what customers are looking for or perhaps what they can’t easily find on your site.
Why track this metric over the holiday season?
Tracking On-site Search Terms can help you increase your conversion rate. It gives you incredible data on what your customers want and what products might perform well in a social or email campaign during the holiday season. It also helps you refine your website copy and improve your search feature to show more relevant products.
“Website visitors that engage with on-site search are more likely to convert because they know what they are looking for.” - Allison Howen, Content Marketing Specialist at Athletico
“Site search optimization is an excellent way to increase conversions, gain market share, and make your customers happy. Site search is a big deal. Changing it, studying the metrics, and taking action on what you learn will definitely boost your conversion rates.” - Jeremy Smith, Conversion Expert and Digital Marketing Consultant
How to calculate it
Similar to Page Load Time, you’ll need to use an analytics tool (such as Google Analytics or something similar) to track the On-site Search Terms. See here and here for step-by-step instructions on how to set this up.

4. Total Revenue
What is it?
Total Revenue is simply the dollar amount of all completed purchases on your site.
Why track this metric throughout the holiday season?
This metric is an obvious no-brainer. Total Revenue is generally the number one focus for every ecommerce business throughout the holiday season. This metric is particularly motivating when everyone can see it update live throughout the day, showing current revenue compared to your daily or weekly goal.
"An essential ecommerce metric for retailers to track is total revenue because it's an overall indicator of the health of the business on a daily basis." - Catalin Zorzini, Owner of Ecommerce-Platforms.com and Founder of Mostash.com
How to calculate it
Total revenue is calculated by adding the total of all completed purchases.
[ Sum of all ($) purchases ] = ($) Total Revenue

5. Average Order Value
What is it?
Average Order Value (AOV) is the average dollar amount customers spend when they make a purchase from your website. This metric helps online retailers better understand customer purchasing behavior.
Why track this metric throughout the holiday season?
This metric correlates very closely with total profit. Increasing AOV is one of the most effective (and usually cheapest) ways to increase revenue since no additional costs are incurred via transactions.
However, with heavy discounting during the Christmas season, the AOV can decline rapidly due to the frenzied nature of ecommerce discounts throughout the holidays. It’s worth keeping an eye on AOV to ensure you’re not just attracting low value single purchase customers to your site with heavy discounting that could dent profitability.
In a Wall Street Journal article, Suzanne Kapner shares how AOV dropped last year during the Black Friday / Cyber Monday weekend last year.
“The average amount Americans spent in some key product categories declined on Thanksgiving and Black Friday, as mobile shopping drove smaller orders and aggressive discounts pushed down prices. Consumer electronics was the hardest hit, with the average order size falling 18% on Thursday and Friday compared with a year ago… Justin Norwood, an IBM product strategist, said shoppers tend to make fewer multi-item purchases on their phones, compared with purchases made on their laptops, tablets or desktop computers. As such, he said, average order value was down on Friday and Monday, when mobile phone orders spiked.” - Suzanne Kapner
How to calculate it
The Average Order Value is calculated by dividing the total revenue by the number of orders placed. You can calculate this metric monthly (i.e. total revenue from the month divided by total orders placed that month), weekly or even daily.
($) total revenue / (#) orders placed = ($) Average Order Value

6. Shopping Cart Abandonment Rate
What is it?
The Shopping Cart Abandonment Rate is the percentage of online shoppers who add items to a virtual shopping cart but then abandon it before completing the purchase.
Why track this metric throughout the holiday season?
Abandoned virtual carts means money is walking out of your virtual door. You’ll want to keep an eye on this metric throughout the holiday season so you can address potential hangups in the checkout process and retarget these customers to help them complete their purchase.
“Poor usability is a known factor in cart abandonment. The top 23 sites all gross over $1 billion per year but have a 44% worse checkout user experience. At the average abandonment rate of 68% each of these sites could be losing $3 billion, if not more.” - Hazel Bolton, Optimization Consultant at User Conversion
A significant amount of that $3 billion is likely lost during the holidays, so this is a key period to ensure you catch any shopping cart abandonment issues early.
How to calculate it
The Shopping Cart Abandonment Rate is calculated by dividing the total number of completed purchases by the number of shopping carts created. Subtract the result from one and then multiply by 100 for the abandonment rate.
1 - [ (#) completed purchases / (#) shopping carts created ] / 100 = (%) Shopping Cart Abandonment Rate

7. Conversion Rate
What is it?
Broadly defined, the Conversion Rate shows the percentage of website visitors that take a desired action on your site. For ecommerce sites, this means making a purchase. So your ecommerce conversion rate shows the percentage of visitors that convert to customers.
Why track this metric throughout the holiday season?
While you should be tracking your Conversion Rate year-round, the holiday season is especially important because it’s one of the first indicators of whether you’re attracting the right audience and making the buying experience easy, intuitive, and compelling.
If your conversion rate drops, it could be caused by a variety of issues including a slow page load time, a broken form, irrelevant or boring copy, attracting the wrong audience, more competitive discounts from other sites or not enough perceived value in your offer.
“Of course you need to optimize your conversion rates to sale. But understanding conversion rate is more complex than simply visitors/sales. You need to understand traffic sources, return buyers and average order values.” - Giles Thomas, Founder of AcquireConvert and CEO of Whole Design Studios
How to calculate it
Calculate your Conversion Rate by dividing the number of website sessions by the number of completed purchases to determine your ecommerce conversion rate. This can be applied to any time period - daily, weekly, or monthly.
(#) of website sessions / (#) completed purchases = (%) Ecommerce Conversion Rate

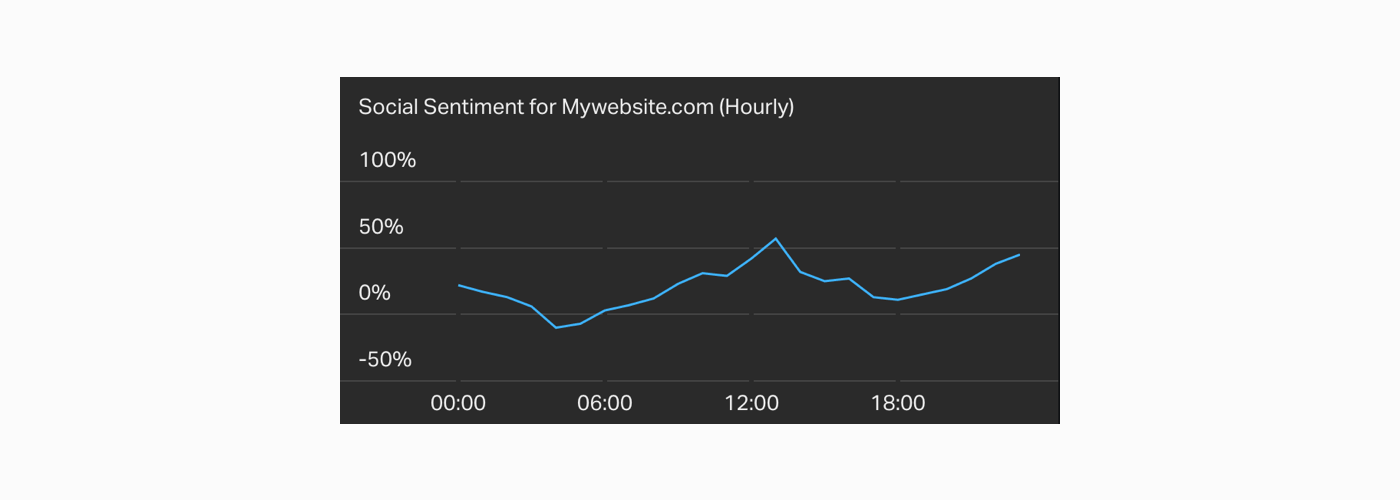
8. Social Sentiment
What is it?
Social Sentiment tells you how people are talking about your brand on social media. This is usually categorized as either neutral, positive, or negative.
Why track this metric over the holiday season?
Consumer expectations are at an all-time high during the holiday season, making it more critical to keep a pulse on how people are engaging with your brand. Are customers delighted with their purchase? Are they disappointed with your actual sale compared to what was advertised? Is the post-sale experience presenting issues?
Tracking Social Sentiment allows you to quickly flag a negative experience and respond immediately. This gives you the opportunity to turn a critic into an advocate during the busy holiday shopping period.
How to calculate it
Social Sentiment can be calculated using a social monitoring service, such as Mention or something similar. This metric can range from 100% to -100%. To calculate this manually, begin by subtracting the number of negative mentions from the number of positive mentions. Then divide this by the sum of positive and negative mentions and multiple by 100 to get the Social Sentiment percent.
[ (#) Positive Mentions - (#) Negative Mentions ] / [ (#) Positive Mentions + (#) Negative Mentions ] x 100 = (%) Social Sentiment
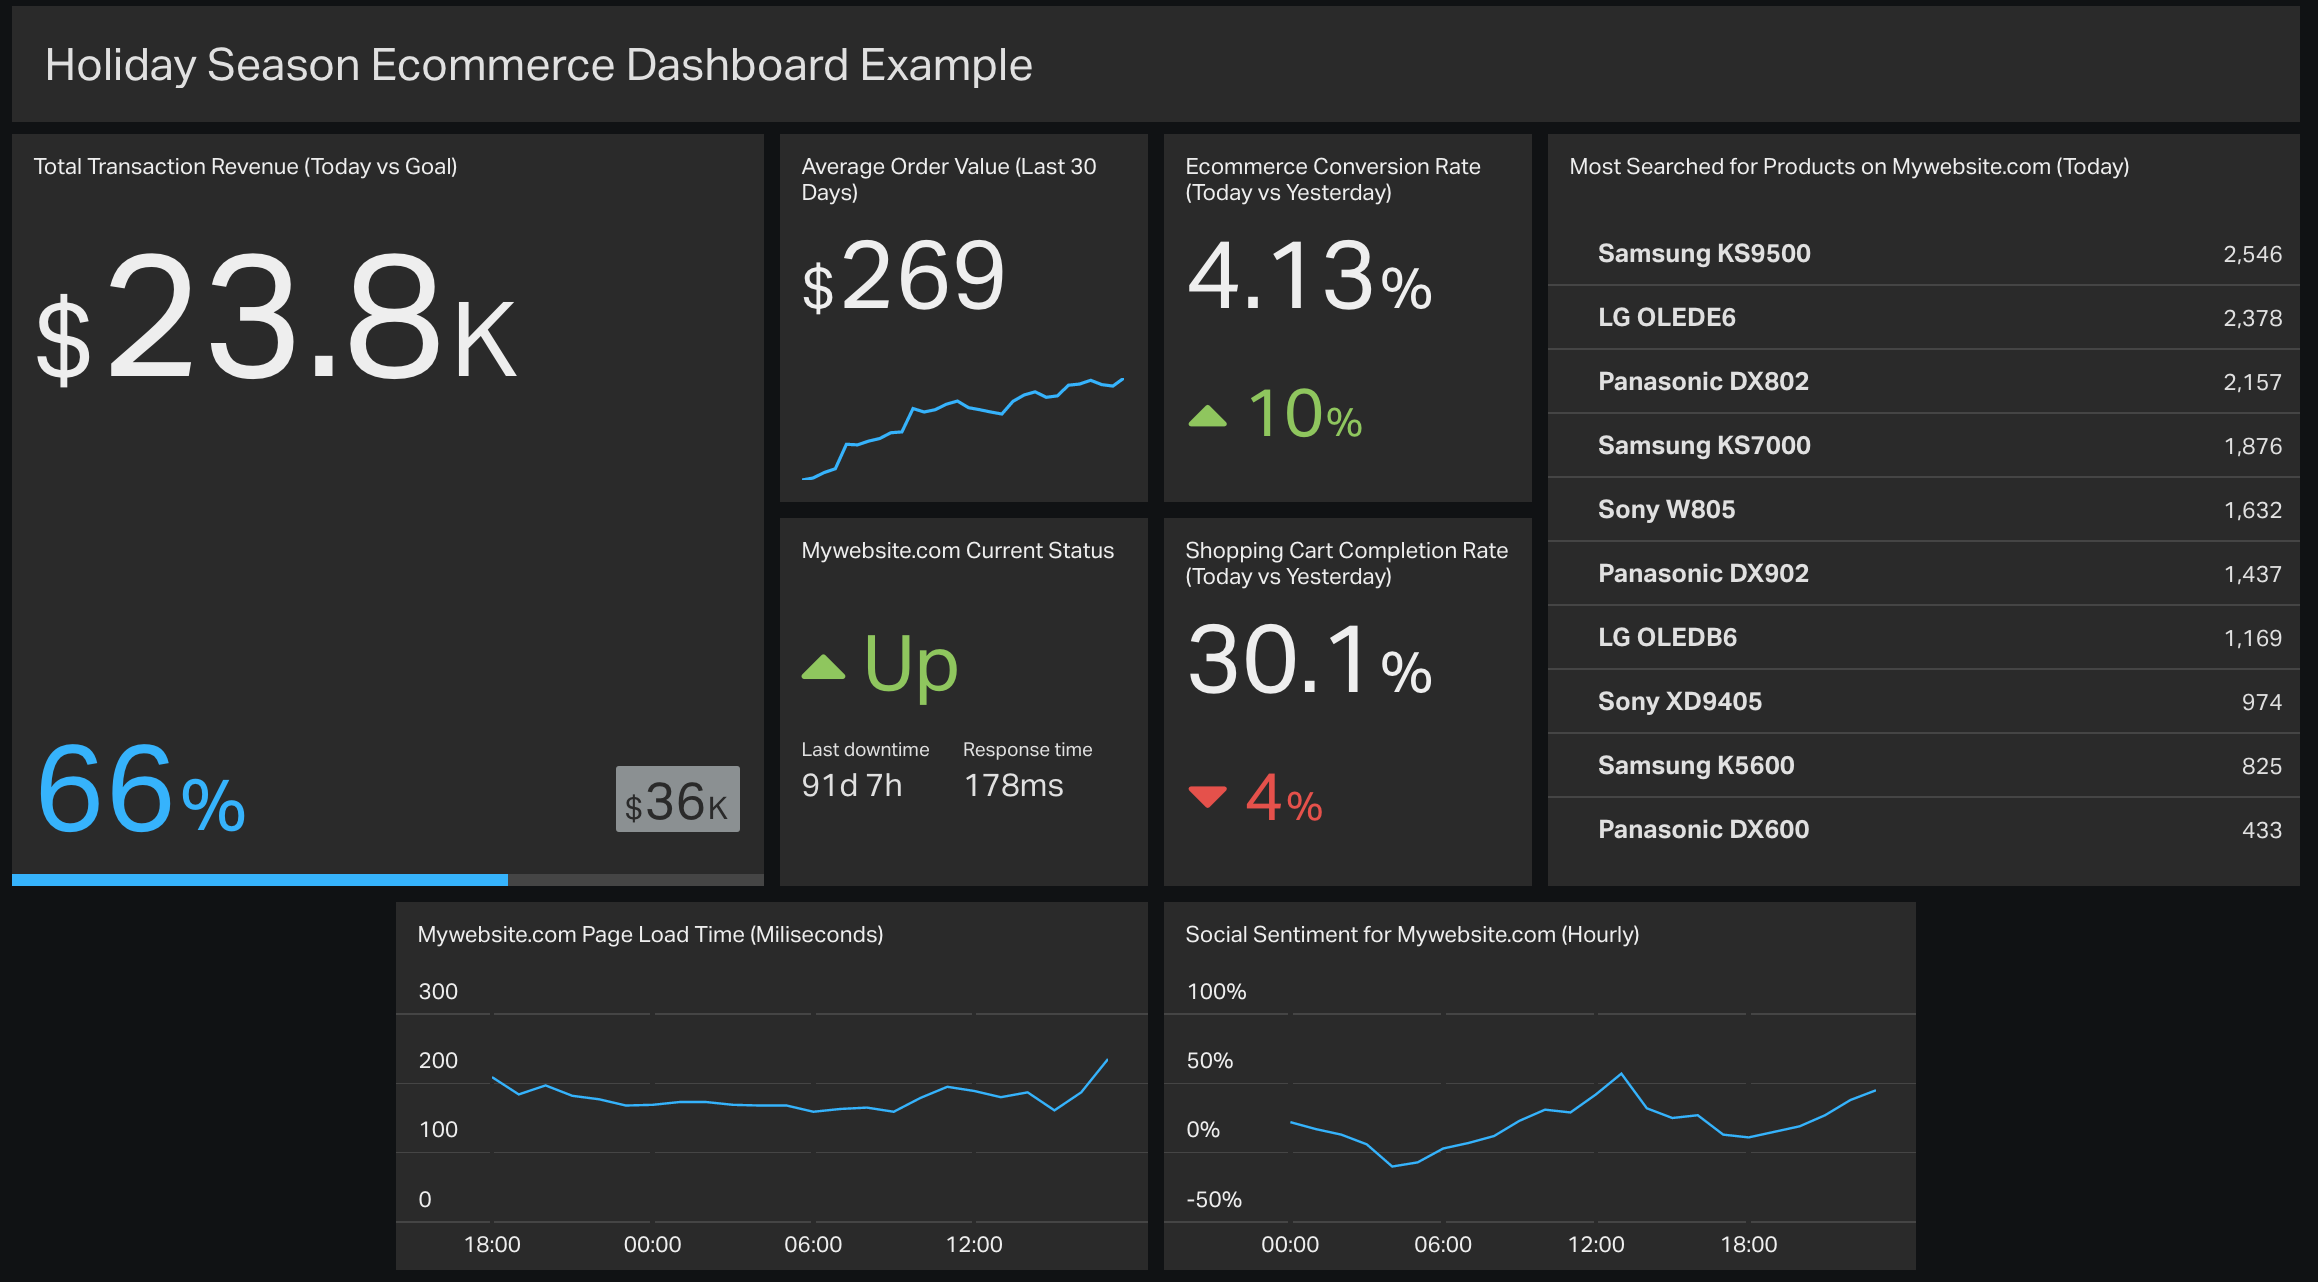
Putting it all together
Thanksgiving and Black Friday are just three weeks away. Start monitoring these metrics now so you have a baseline to compare with holiday spikes. An easy way to track your ecommerce metrics throughout the holiday season is to set up a live TV dashboard like this example.