Great designs rarely come about by accident.
Behind almost every successful product or piece of software, a large amount of work goes into prototyping, testing, gathering feedback and optimising in an effort to make the end product deliver as much value as possible to the end user.
Creating a useful dashboard for your team is no different.
At Geckoboard we’ve seen countless examples of business dashboards made by our customers over the years, and one thing we’ve realised is that great dashboards are an ongoing collaboration between whoever decides what the objectives are for a team, and the team themselves.
Whether you’re thinking about refreshing the dashboards your company uses already, or you’re just starting to plan what metrics to track, here’s how bringing an iterative design mindset to the process can ensure the dashboard you and your team are looking at day-to-day is always relevant and makes a direct impact on your business.
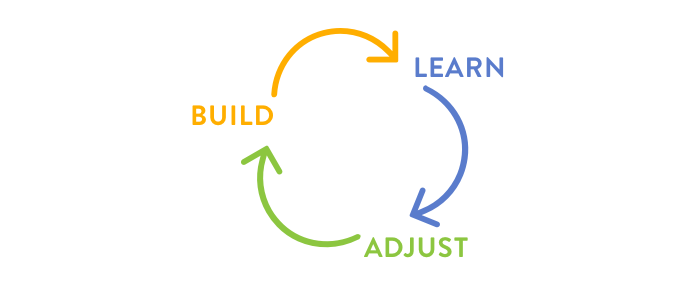
Build
The most critical step of the process is to get started. Your aim should be to have something to show to your team that can start generating real feedback on what’s useful to them.
A useful idea to bear in mind is that of a ‘Minimum Viable Product’ (MVP). What dashboard can you make that will allow you to learn the most from your team with the least amount of effort? Less is more, and at this stage you shouldn’t be worrying about building a fully fleshed-out dashboard before sharing it with your team.
If you’ve already tracked metrics using another tool or spreadsheet in the past, the first metrics you add to your dashboard may be obvious. However, if this is the first time you’ve sat down and thought hard about what makes sense to track, the process may feel like guesswork.
It’s important to cast aside any assumptions or fears and get to the point where you can show something to the rest of the team that starts a conversation. This is how you kick-start the process of refining what’s on your dashboard.
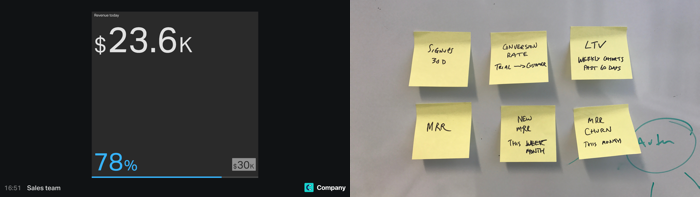
Don’t get bogged down with tracking down data or adding lots of metrics. An MVP can be as simple as one metric or a mockup made with Post-it notes.
Learn
It’s extremely unlikely you will have created a perfect dashboard on your first attempt.
It’s therefore important to gather useful feedback from others so you can make informed changes to your dashboard. Elements to consider changing include:
- What metrics are on the dashboard
- The visualizations and timeframes used
- The layout of metrics on the dashboard
- The priorities given to certain metrics
- Titles and annotations
- How metrics are divided between different dashboards
Tweaks to any one of these elements can make a massive difference to how useful your dashboard is to others, so as a dashboard creator it’s critical to make informed choices about what direction to take things in.
Some ways to open up a conversation with your team about what’s useful include:
Display it prominently on a screen: Start using your dashboard ‘in the wild’ day-to-day and see what feedback you get organically from your team. You might be surprised at some of their suggestions!
Set up a mini ‘user-test’: Set time aside to bring your team together to run through your dashboards and discuss what’s useful or could be improved.
Continuously ask questions: Understand whether the metrics on your dashboard are valuable and driving appropriate action.
- Are you able to look at this and take action based on what the metric is showing?
- Do these metrics help us work towards our goals?
- Is there a clearer way to represent this?
- Is there anything we can remove from the dashboard to make it clearer?
Adjust and repeat
As you gather feedback, make changes that address the issues you’ve identified.
If there are a lot of fundamental changes, remember: A dashboard that fails to prompt action and doesn’t focus your team is not useful to anyone, so don’t be afraid to start again from scratch and try a different approach.
After a few rounds of feedback, you should be much closer to having a dashboard that’s useful for your team. But this is not the end of the process.
Businesses are in a constant state of flux, and the metrics on your dashboards will likely need to adapt as your team develop new ideas about which metrics are impactful, as your business goals evolve and the people on your team change.
Stay open to feedback, help others think critically about their metrics with the questions above, and you’ll be best-placed to keep your dashboards relevant and actionable going forward.
Summary: How to start iterating today
- Build a minimal version of your dashboard to get in front of your team as early as possible
- If you already have dashboards, start gathering feedback from your team
- Ask questions that will uncover what’s important, what’s missing, and what can be removed, and make appropriate changes to your dashboards
- Take time to read up on the subject of useful metrics and using dashboards. The Lean Analytics book and free course are recommended.
- Do also check out our Dashboard Design: Best Practices guide.
- KEEP GOING!
Komet Sales is a 51-person SaaS B2B platform that allows a company to manage everything around running an import and wholesale flower operation.
"Dashboard building is an ongoing process but you’ve got to get started – getting started is 90% of the job done. It’s like setting up a garden. You do some heavy lifting and then you start pruning to maintain everything.
It helps to imagine the dashboard as valuable real estate. If every metric you add is going to cost you a hundred bucks, which ones would you put up? Having this in your mind will make you much more selective. My mistake when I started building dashboards was to get excited and think ‘I’ve got to fill it up!’. My first dashboards looked like Christmas trees and created total confusion because there were too many things for people to look at. It’s much better to start small and build up slowly.
There were a lot of vanity metrics on our first boards. For example, number of boxes of flowers moved every day. It’s interesting to know as a reference, but it’s not going to help us do a better job. To get the team to understand vanity metrics and help them iterate on their dashboards, I asked a lot of questions like ‘How is the number of cases we’ve closed in the last 3 months useful? How is this going to help us achieve our goals? How is this going to help us serve our customers better today?’ If the customer asks how they’re going to get a better service and they can look at numbers on a dashboard that actually impact them, then that’s useful to us.
Dashboard iteration is a process that keeps on going forever and ever. When we were five people and then 20 and now 51, the metrics changed because the whole business is different. The same metrics we used five years ago or two years ago or a year ago don’t necessarily work today. Your best past business practices can become your worst future business practices. The world, and your business, is moving so fast that you need to be willing to make changes at the flip of a dime."
