Yummly was launched in 2010 by foodies on a mission to invent the ultimate kitchen tool. Whether it’s finding a recipe or going to the store, Yummly wants to make it easier for foodies to do what they love – cook, eat, and share. Today, with 10 million monthly unique visitors, Yummly is succeeding in its mission and has become the fastest growing food site in the world.
We had the opportunity to chat with Ethan Smith, Head of Product at Yummly and he described how data has helped Yummly to build a strong culture of transparency and highly focused teamwork.
Below some excerpts of our conversation:
Why did you start using data communication tools?
We generally try to stay on top of the latest tools that other people are using. We know that other people were using Geckoboard. I don't remember exactly the place that we heard about it, but we noted that other startups that we think highly of were using it and we looked into it.
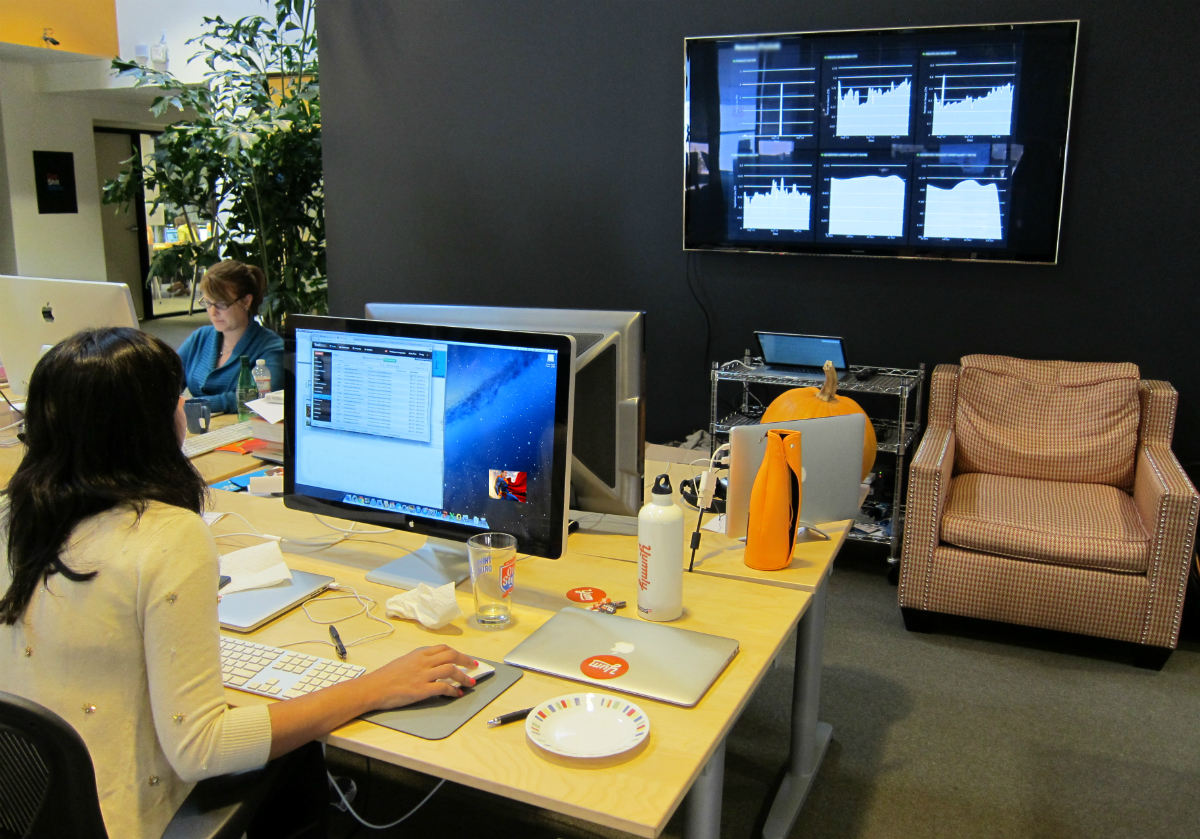
We have always been metrics-driven, but we have become increasingly more. Sometimes you get overwhelmed with lots of information, and we wanted something that we could all look at to force ourselves to look at the top-level metrics. We thought about having a visual dashboard or TV screen in our office would be way to force us to focus on the top-level metrics and to visualize that, and we found Geckoboard was a good solution for that.
How did you go about choosing your key metrics, individually, by teams?
We have a variety of different teams. We have a flat organizational structure with multiple teams that each focus on the most important areas of our business. Some of our key areas of focus are revenue, traffic growth, engagement, and activation, and each of those teams recommended what they thought would be the best metrics to measure, A, the general health of the company, and, B, whether or not their team specifically was making an impact.
We think of our metrics roughly as a funnel, which is that we acquire people, we activate them, we get them engaged, and we generate revenue. Each team focuses on a section within the funnel. We selected metrics to measure the high-level health of the company and the effectiveness of each piece of the funnel. These are the metrics we put into Geckoboard.
Each team has their own dashboard. Everyone in the company has access to everyone else's dashboards.
We also have additional dashboards for things like ops, and social. We also have remote people, and we have different clocks so that we know what time it is for those people.
How did you build a culture of transparency?
We explicitly designed our culture around transparency, and we try to individually and collectively exude that. We try to hire people and encourage them to be transparent, not just with metrics, but with everything, making mistakes, successes, and learning from them. So, I guess it would come back to culture.
What do you think are the biggest challenges for other organizations that do not have this type of culture?
I think the main challenge is that changing culture is generally difficult. In particular, transparency is typically not in one’s self-interest, they are very aware of this, and thus they are not transparent about things they they think might not be in their interest for others to know. This belief held by individuals then perpetuates throughout the organization, which leads to a culture of opacity. A way to change to a culture of transparency is to change people by persuading them that transparency is a good idea and in their self-interest, and changing process to ensure that transparency is indeed in their self-interest. Often times, process punishes people for making mistakes, which leads to people accurately believing transparency is not in their self-interest, which leads to less transparency. At Yummly, our process does not punish people for making mistakes. On the contrary, we encourage people to make mistakes and learn from them. Furthermore, transparency in our key metrics and publically displaying them with Geckboard helps reinforce our culture of transparency.
Is this kind of philosophy written or formalized at Yummly?
We have a culture section in our Wiki and a presentation we shared internally to make our culture explicit. Part of our culture is to make decisions based on “evidence.” We refer to "evidence" vs. simply “metrics” because we use both quantitative and qualitative data like user interviews, ethnography, and customer feedback.
How are you using Geckoboard for product management?
Many ways. What I individually currently focus on right now is growing our traffic. We measure our traffic as a funnel. At the end of the funnel is our most important metric, which is many visits we're getting. I measure our success based on that. Earlier in the funnel we look at different traffic sources, social, SEO, referral app. I use these, A, to see how much of an impact are we making. B is when things change, why do they change, and how can we make them change more? And if there are things that are going bad, how can we fix those? That’s how I use Geckoboard specifically.
Can you name five tools that you normally use for pulling all your data?
Mixpanel, Google Analytics, Google Webmaster Tool, Majestic SEO. Those are the main ones that I use right now. Other people use some other ones, but those are the main ones that I use.
Download case study as PDF
If you found this case study useful you may also be interested in the following:
