Sales reporting is an essential part of the overall sales process. It's particularly important if you run a sales team where everyone needs to stay in loop.
If you're looking for a dynamic sales reporting template you can pick up and use today, then you're in luck. Read on to access our free template.
In this article, we share a sales report template you can use for free with Google Sheets. We’ll also cover what sales reporting is, how often you should be doing it, how to use our free template and how KPI dashboards can improve team engagement.
What is a sales report?
A sales report is used to summarize a sales team’s performance. In order to identify areas of opportunity, and see how the team is performing. Sales Managers often analyze sales activity metrics within a sales report.
There are lots of ways to set up reports, of varying levels of complexity. You might be familiar with large, detailed documents or perhaps short reports including only topline figures.
But the important thing to remember is that all sales reports need to deliver an oversight of team performance, allow you to spot patterns in sales activity, and give the whole team an understanding of your goals in order to be useful.
Why use a sales report?
Sales reports have the potential to improve efficiency and increase conversion rates. Here are a few ways implementing a sales report into your team could have an impact on your bottom line.
Improve performance
A Sales Manager can easily identify underperforming sales reps by regularly viewing the whole team’s performance data. This brings the opportunity to coach those who may need a little help to deliver against their goals.
Increased efficiency
When trialing new strategies, a sales report can help identify what’s working and enable you to reallocate resources accordingly. With this in mind, sales reports can help make sales operations far more efficient.
Spot pipeline issues
If your sales report includes data that covers your pipeline then you’ll be able to spot any issues or blockages that could be harming your sales funnel.
Boost recognition
When distributed more widely, a sales report can give everyone in the business an overview of how the sales team is performing against their KPIs and boost recognition for their hard work.
It’s important to remember that sales reports need to be completed and reviewed on a regular basis in order to be able to have an impact. You’ll only be able to take action if you see opportunities from the data in your reports in time.
So at what cadence should you be creating and sharing sales reports? Let’s look at this in the next section.
How often should I be running a sales report and what should I include?
It's always better to run your reporting as frequently as possible. This will make the report more useful because readers will be more confident that the numbers are up to date.
However, if your reporting process involves manual input, then you may need to limit your reporting to daily, weekly or monthly depending on how quickly your sales cycle moves.
It’s worth noting that completing one frequency of reporting is not mutually exclusive. You may do a combination of daily topline reporting and monthly deeper analysis in order to allow you to stay on top of faster moving numbers as well as trends over a longer period of time.
Here are some suggestions where daily, weekly, and monthly reports may be appropriate, as well as metrics you could include.
Daily
In fast moving markets or in teams where your reps are completing a lot of activity on a daily basis a daily sales report can be very helpful.
If you’re tracking sales activity metrics where reps have daily targets, it can be really motivating to see those numbers change each day.
Metrics for your daily sales report:
- Fast moving activity metrics such as number of cold calls or cold emails
- Related activity metrics such as length of call
- Number of opportunities in the pipeline
- Fast moving conversion metrics such as deals closed (if this changes on a daily basis)
Weekly
Weekly reporting can be a sweet spot for some businesses where metrics can be slightly slower moving but you want to motivate and boost team performance. Having a weekly sales report to share how the team is doing is a good cadence for a lot of sales teams.
Metrics for your weekly sales report:
- Total volumes of activity metrics such as number of cold calls, cold emails, appointments booked
- A leaderboard of individual rep performance against key sales activities that should be improved in a week, such as appointments booked
- Conversion metrics such as lead conversion ratio
- Total deals closed
- Sales broken down by channel
Monthly
Monthly sales reports allow you to have an oversight of slower moving trends and do deeper analysis. Perhaps you’re trialing a new sales strategy and want to see how it lands? Monthly reporting is probably a good option – you’ll be able to gather insights and respond within a reasonable timeframe.
Metrics for your monthly sales report:
- A breakdown of your pipeline and how deals are progressing through it
- Length of your sales cycle
- A leaderboard of individual rep performance by deals closed
- Metrics that allow you to see performance across the team such as average close rate and average deal size
- Total sales volume
Free Google Sheets sales report template
If you find the thought of creating a sales report from scratch daunting, we’ve created a simple Google Sheets template you can use for free.
Make a copy of this ‘view only’ Google Sheets template and use it to populate your own sales report.
- Go to 'File'
- Then 'Make a copy'
How to use the free template
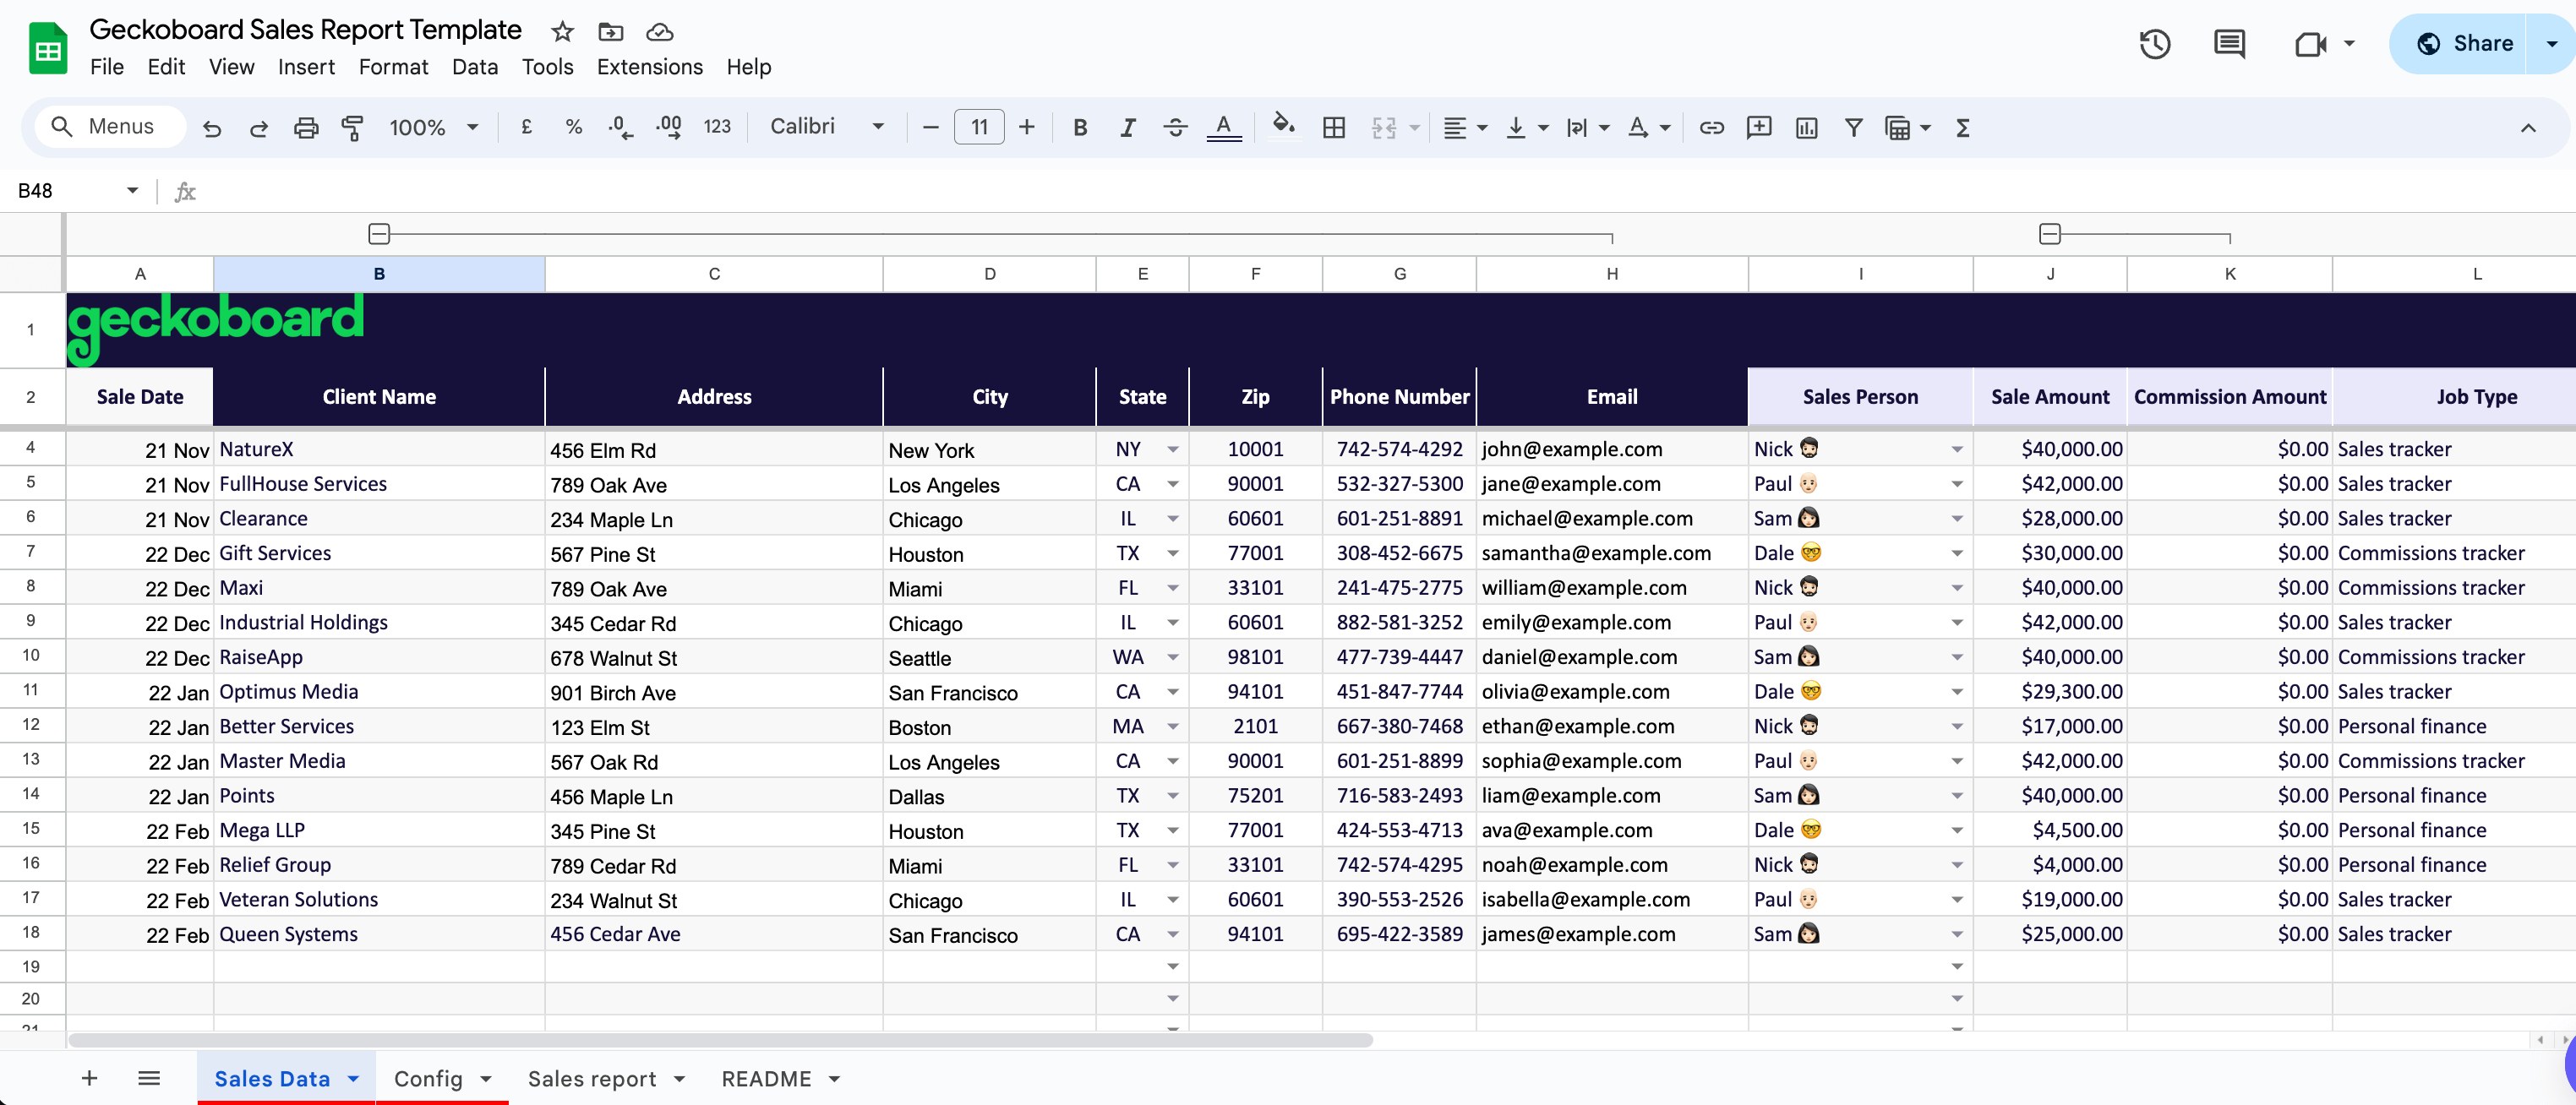
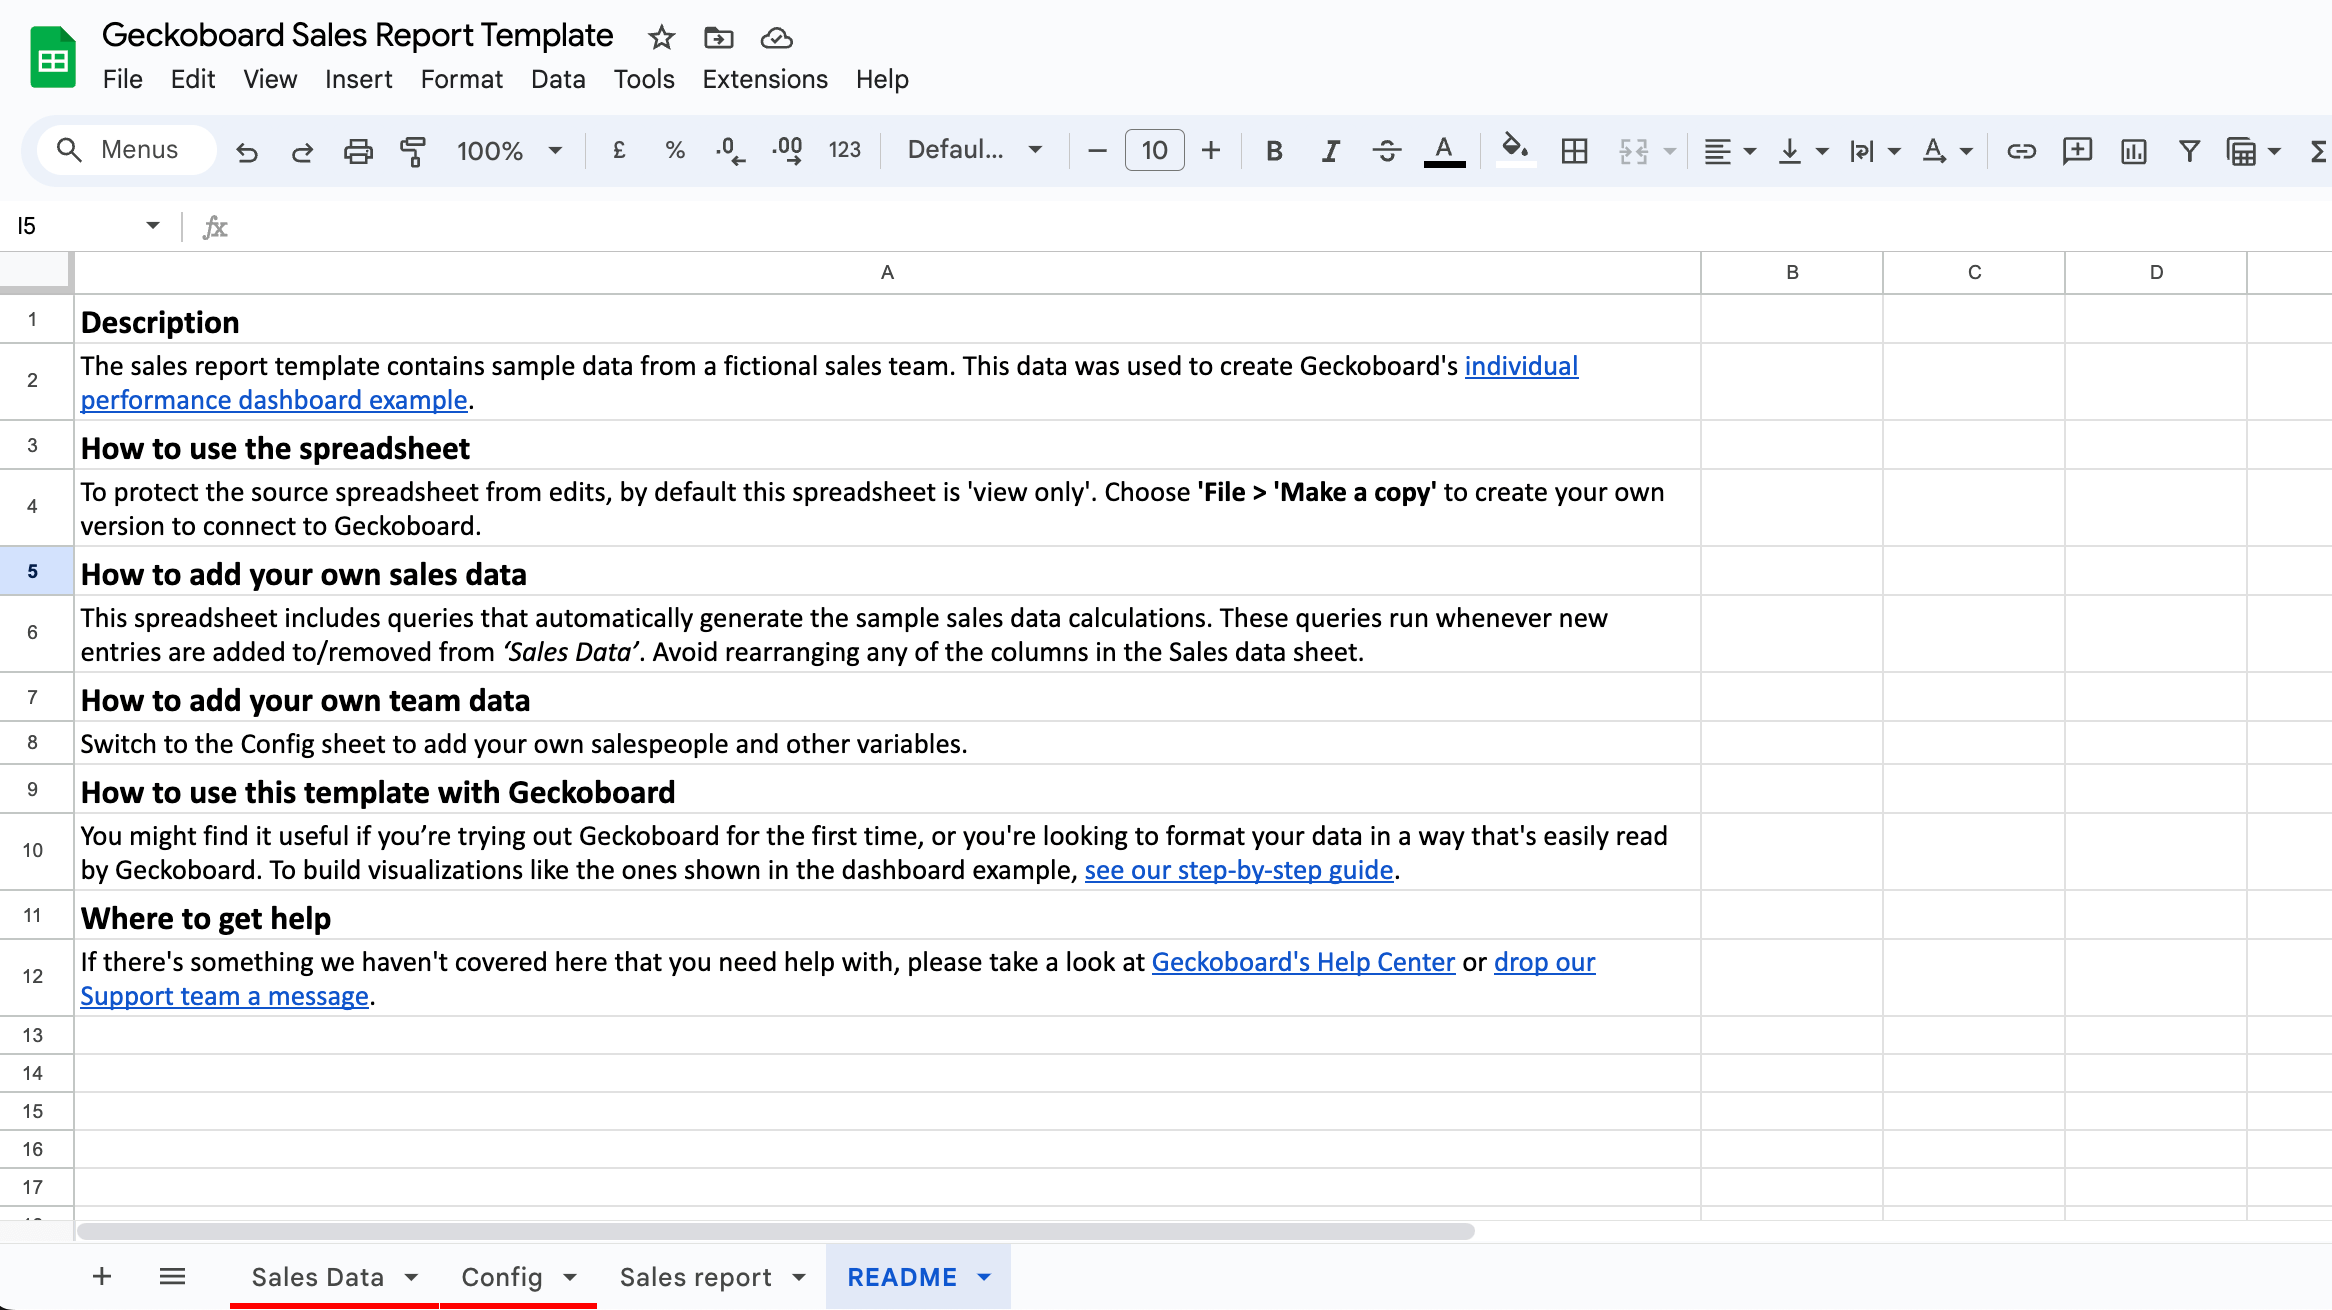
Within the free sales report template you’ll find four sheets. ‘Sales data’ is where you’ll input information about each sale a rep completes.
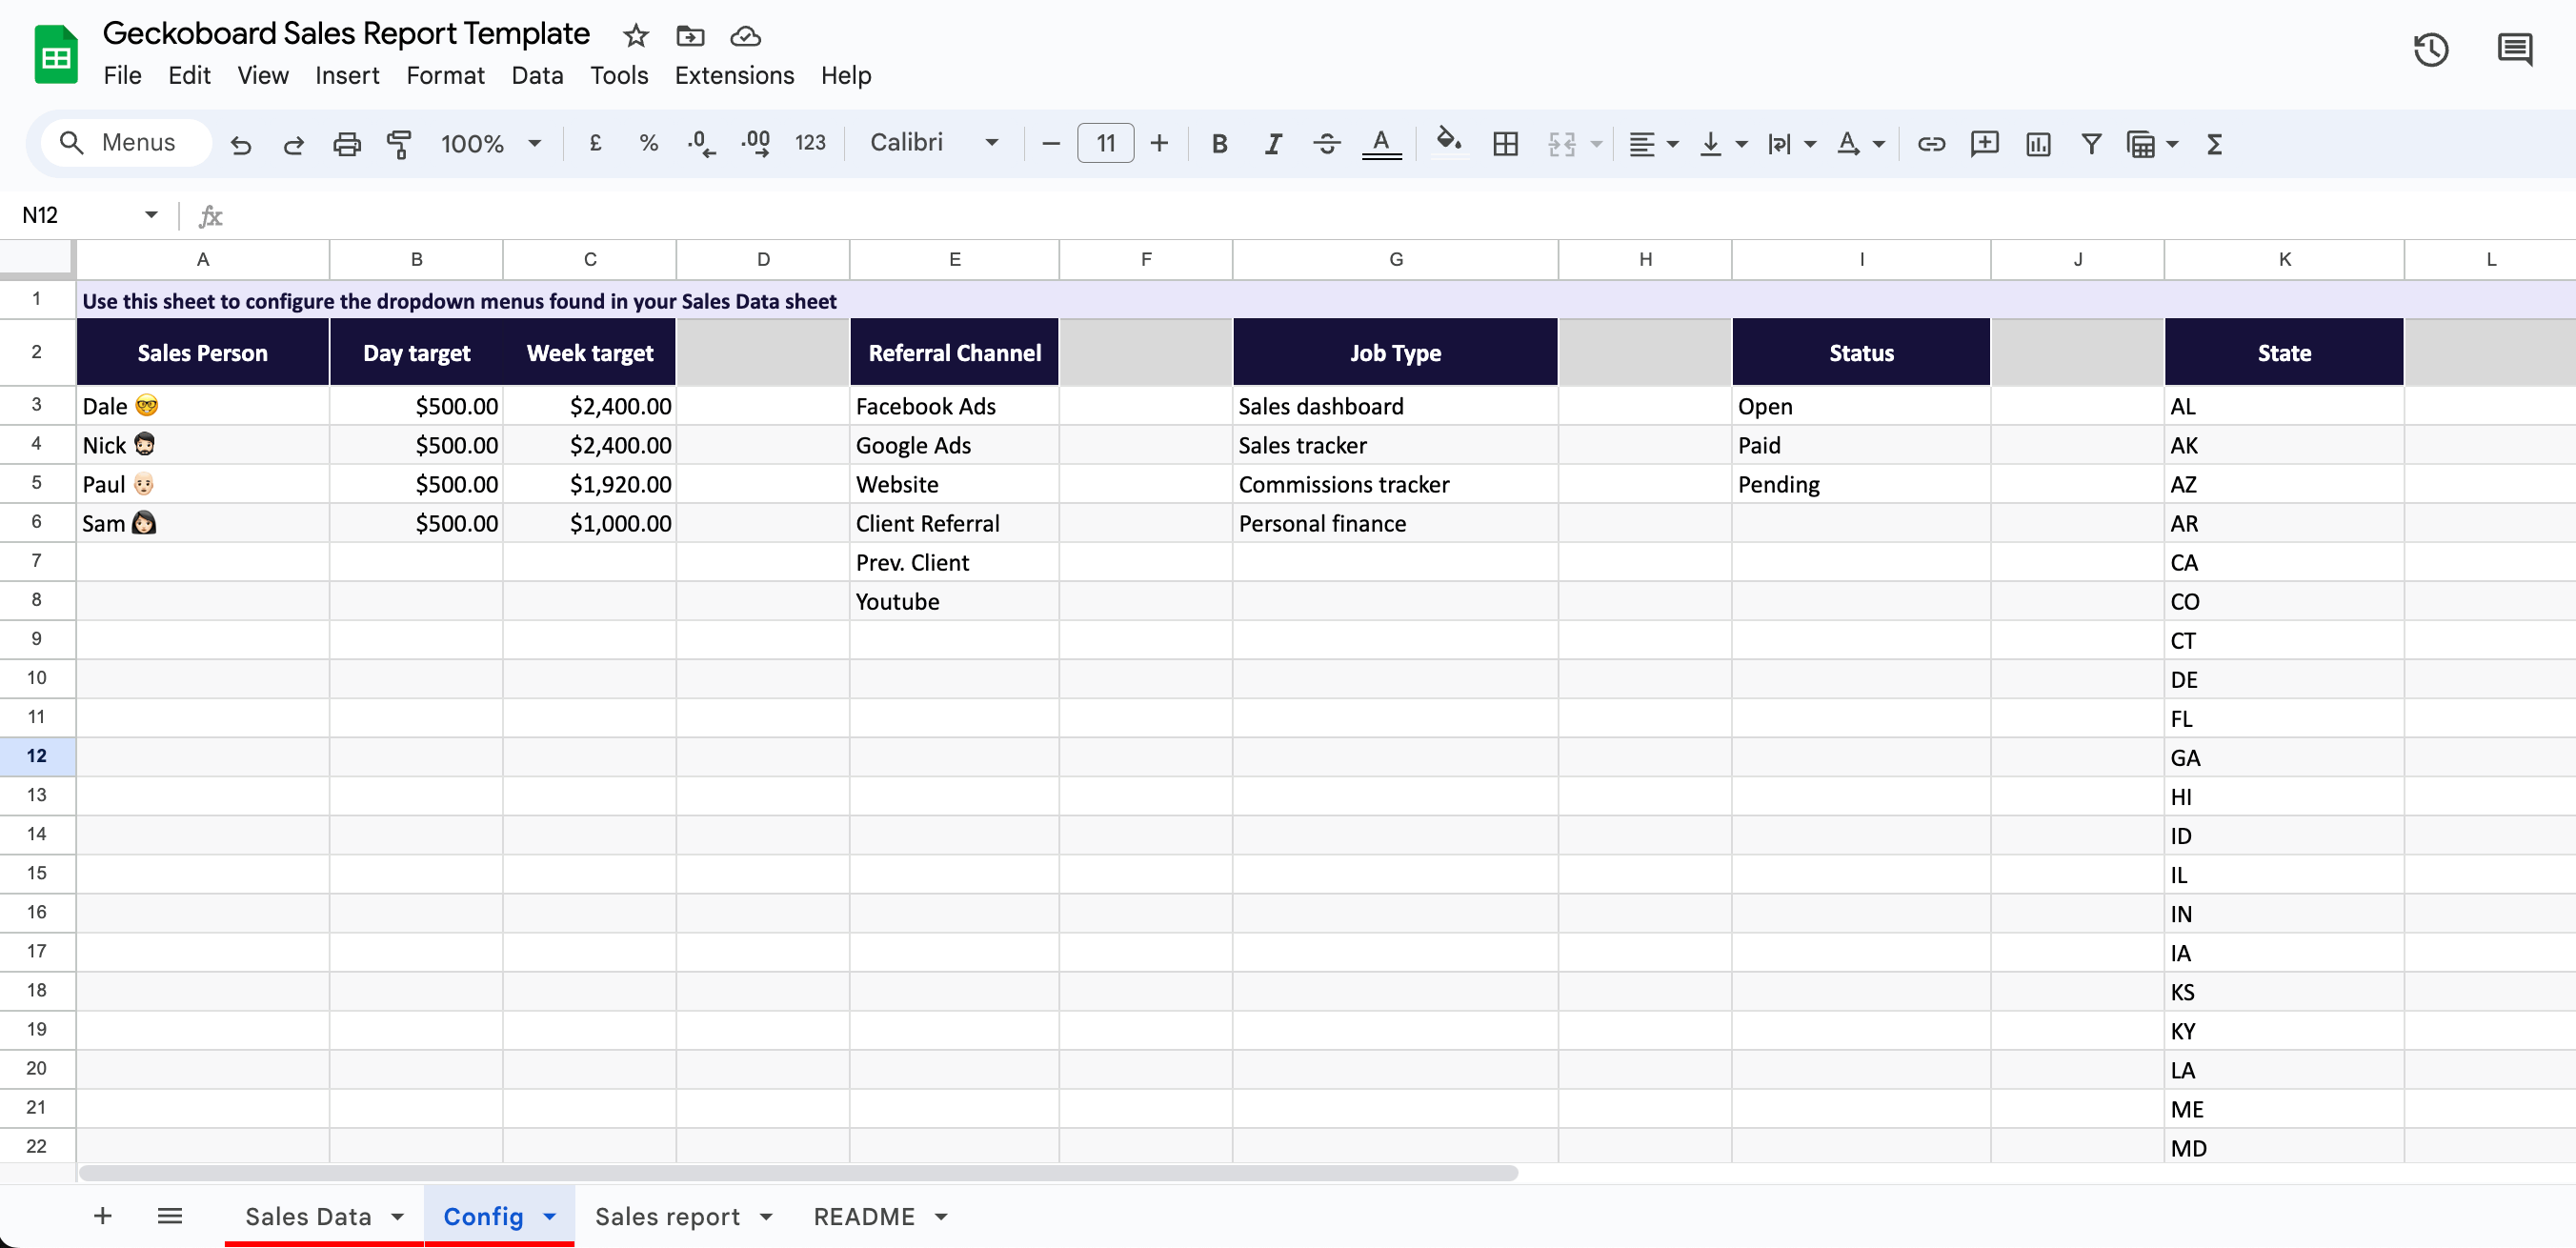
The ‘Config’ sheet contains the data that populates the dropdown menus in your ‘Sales data’ sheet.
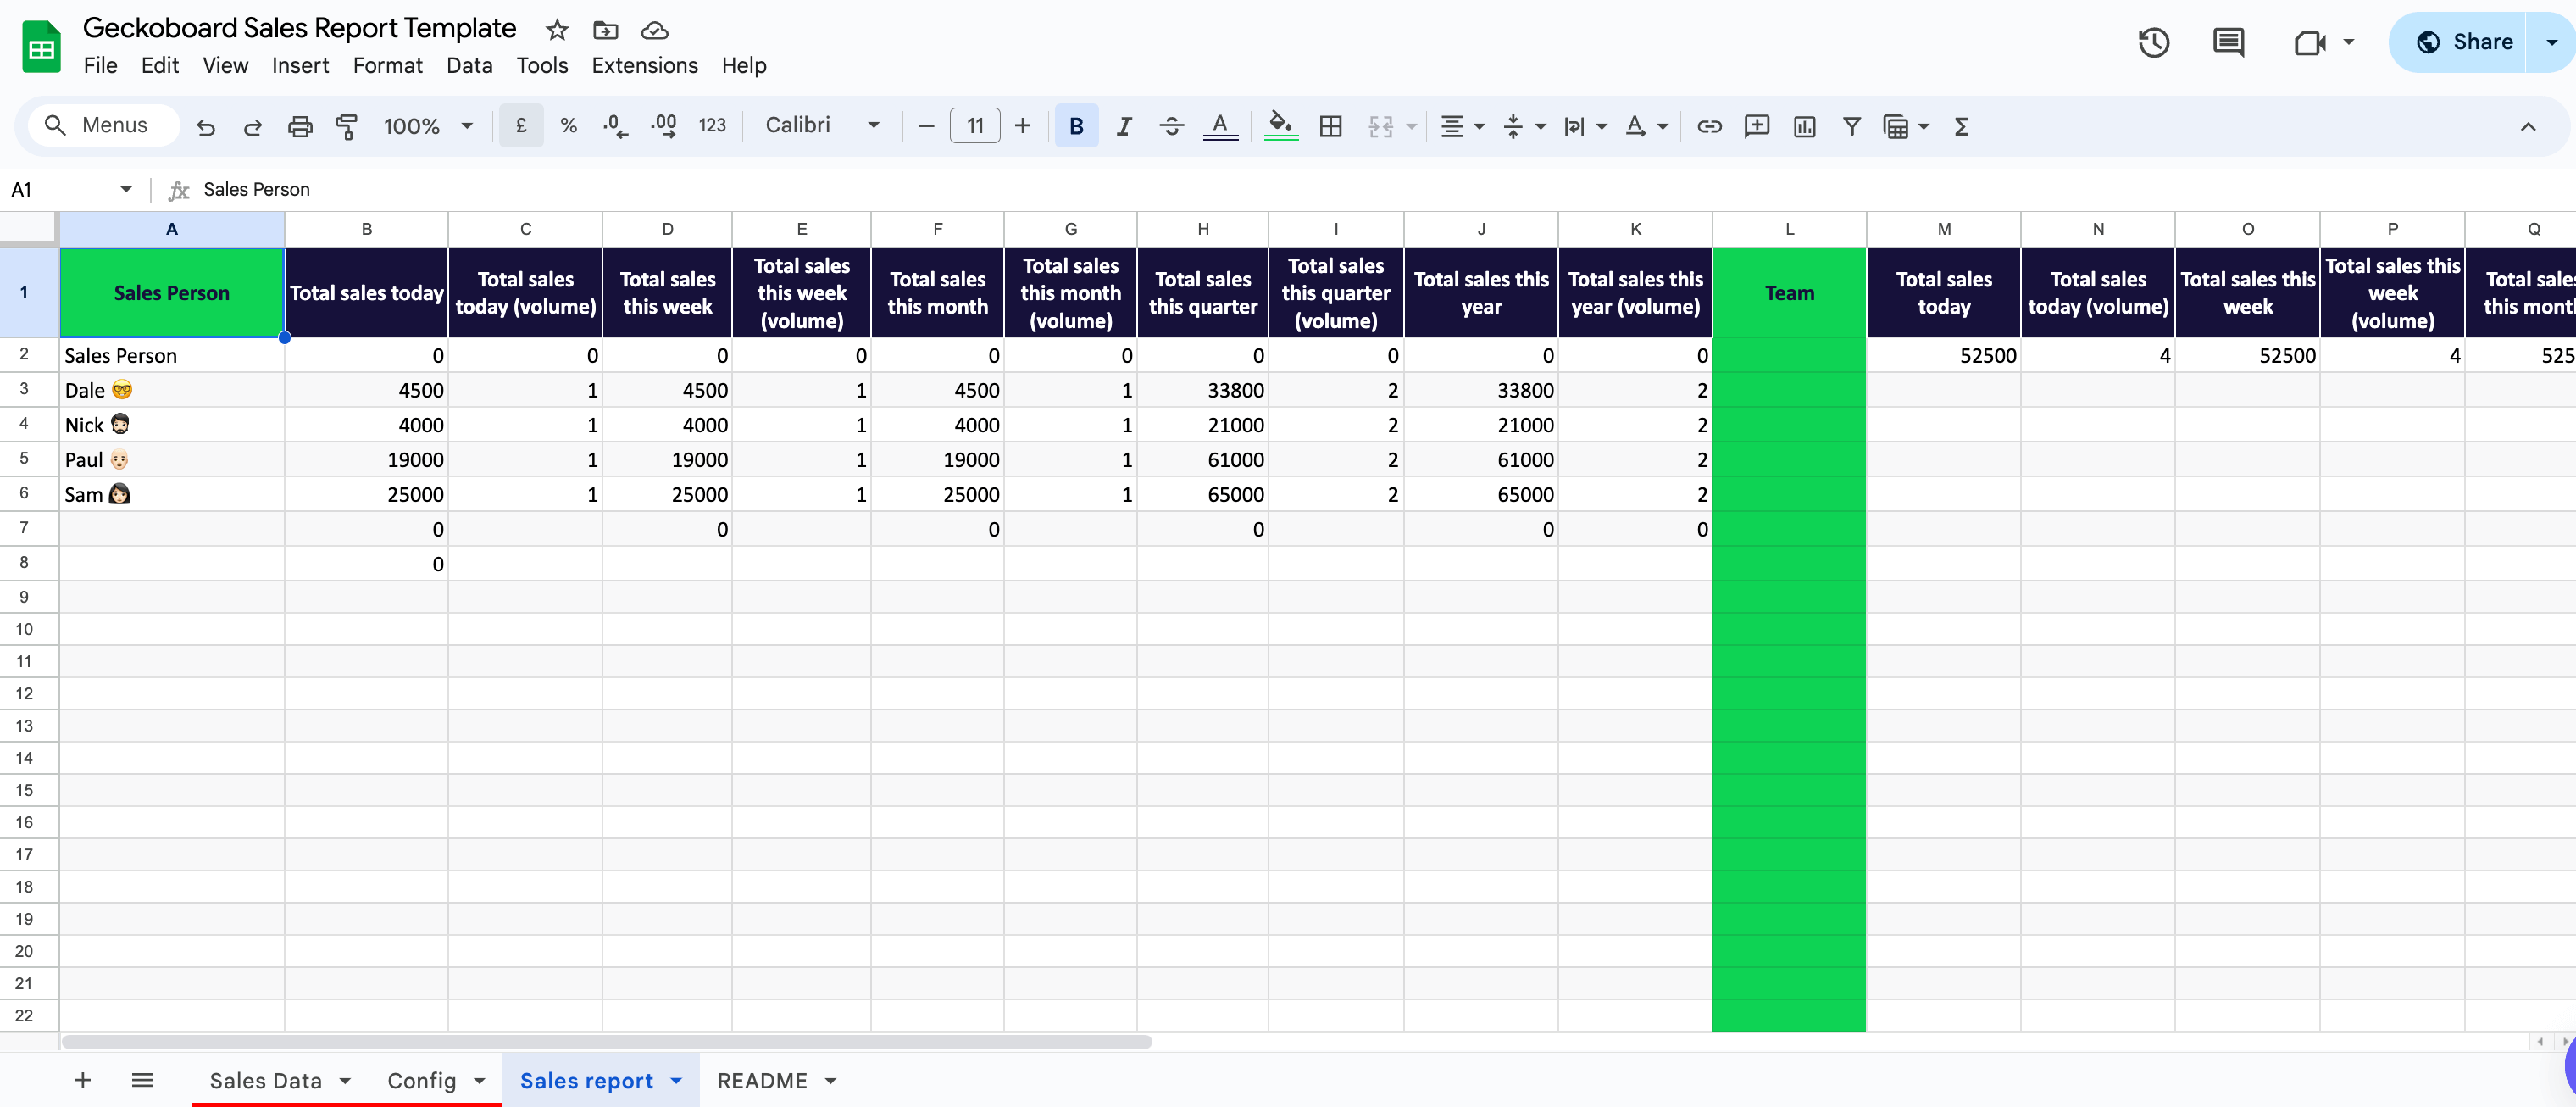
The ‘Sales Report’ sheet is your overview and should be considered the main report that you’d share with others. This is where you can track individual rep performance, team performance as a whole as well as daily, weekly and monthly data.
Finally, the ‘README’ sheet gives an overview of how to use the template.
You’ll want to start by removing the sample data and updating the ‘Config’ sheet to reflect the information you’d like presented in your ‘Sales data’ sheet.
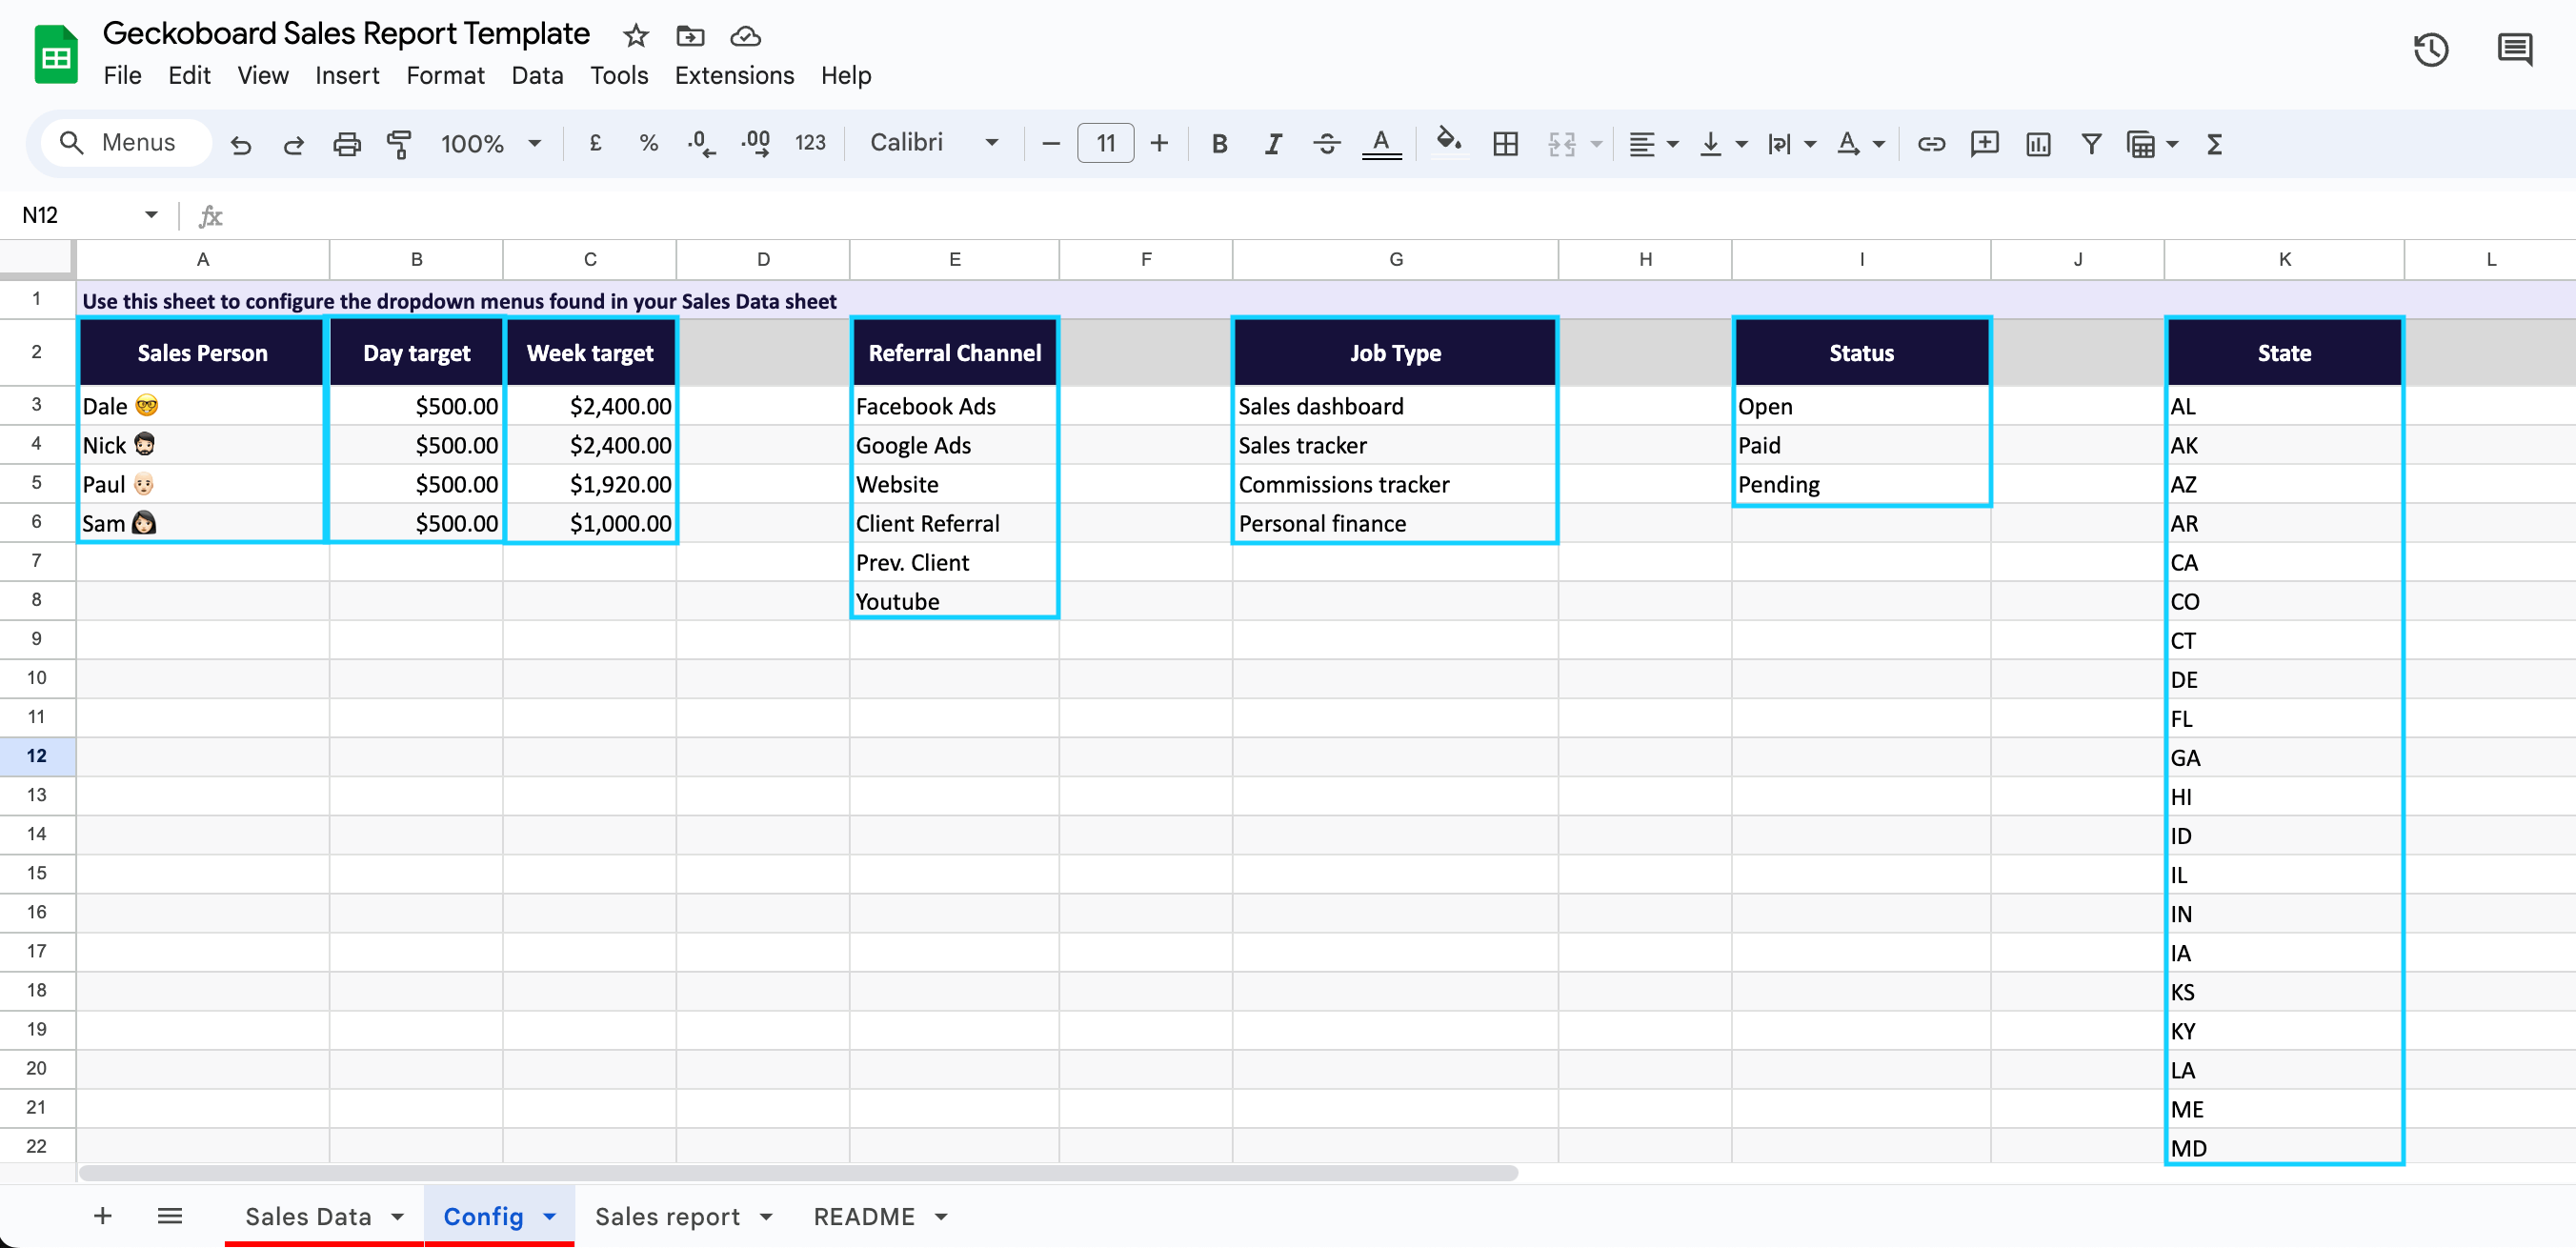
It’s worth bearing in mind that this template contains queries to auto-populate the ‘Sales report’ sheet so you’ll want to avoid moving columns. Feel free to rename the sheets and headings as well as updating the ‘Config’ lists.
The template can be completed by the Sales Manager on a daily basis, or better yet, by individual reps when they make a sale. This takes the pressure off one person having to do all the reporting legwork and encourages the Sales Reps to regularly view and use the report.
Turn your sales report into a dashboard
A sales report allows you to track performance but it does still have some drawbacks… Not all the team will be in the habit of checking it regularly and it requires some effort to open, consume and interpret a spreadsheet sales report.
Whereas, turning your sales report into a dashboard means you’ll be able to broadcast that information to whoever needs to see it – with little or zero effort on their part to view it.
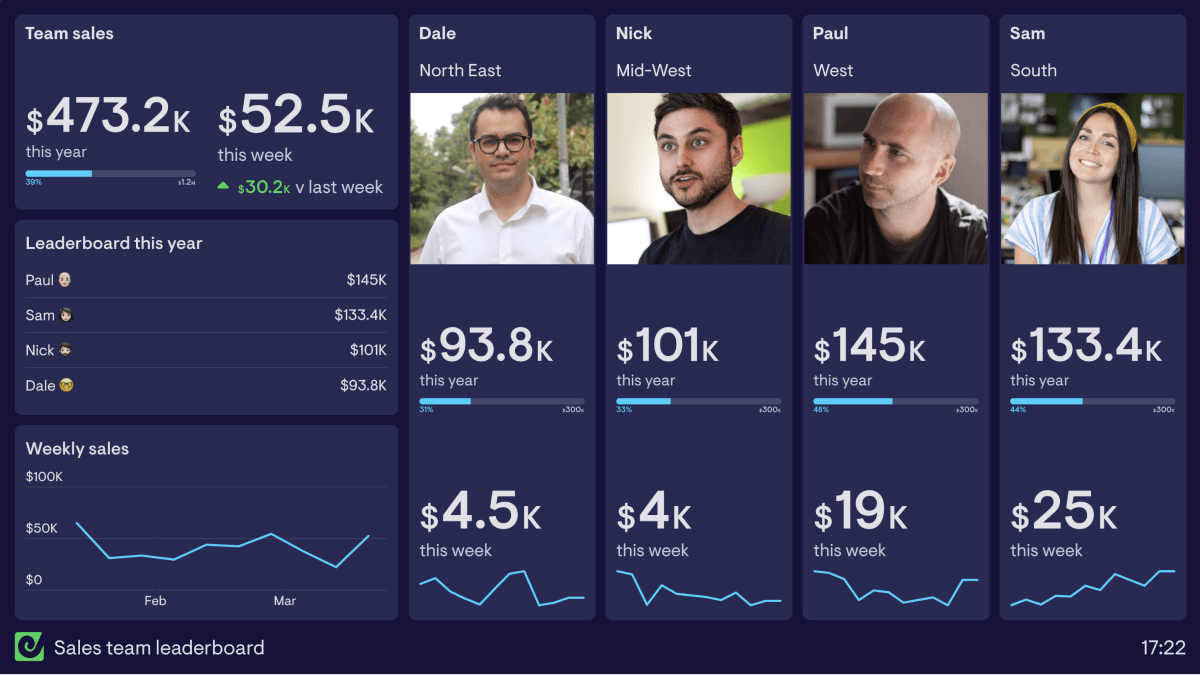
With Geckoboard, you can connect your spreadsheet (as well as many popular sales tools) to create professional KPI dashboards. A dashboard is naturally easier to understand and more visually engaging than a spreadsheet.
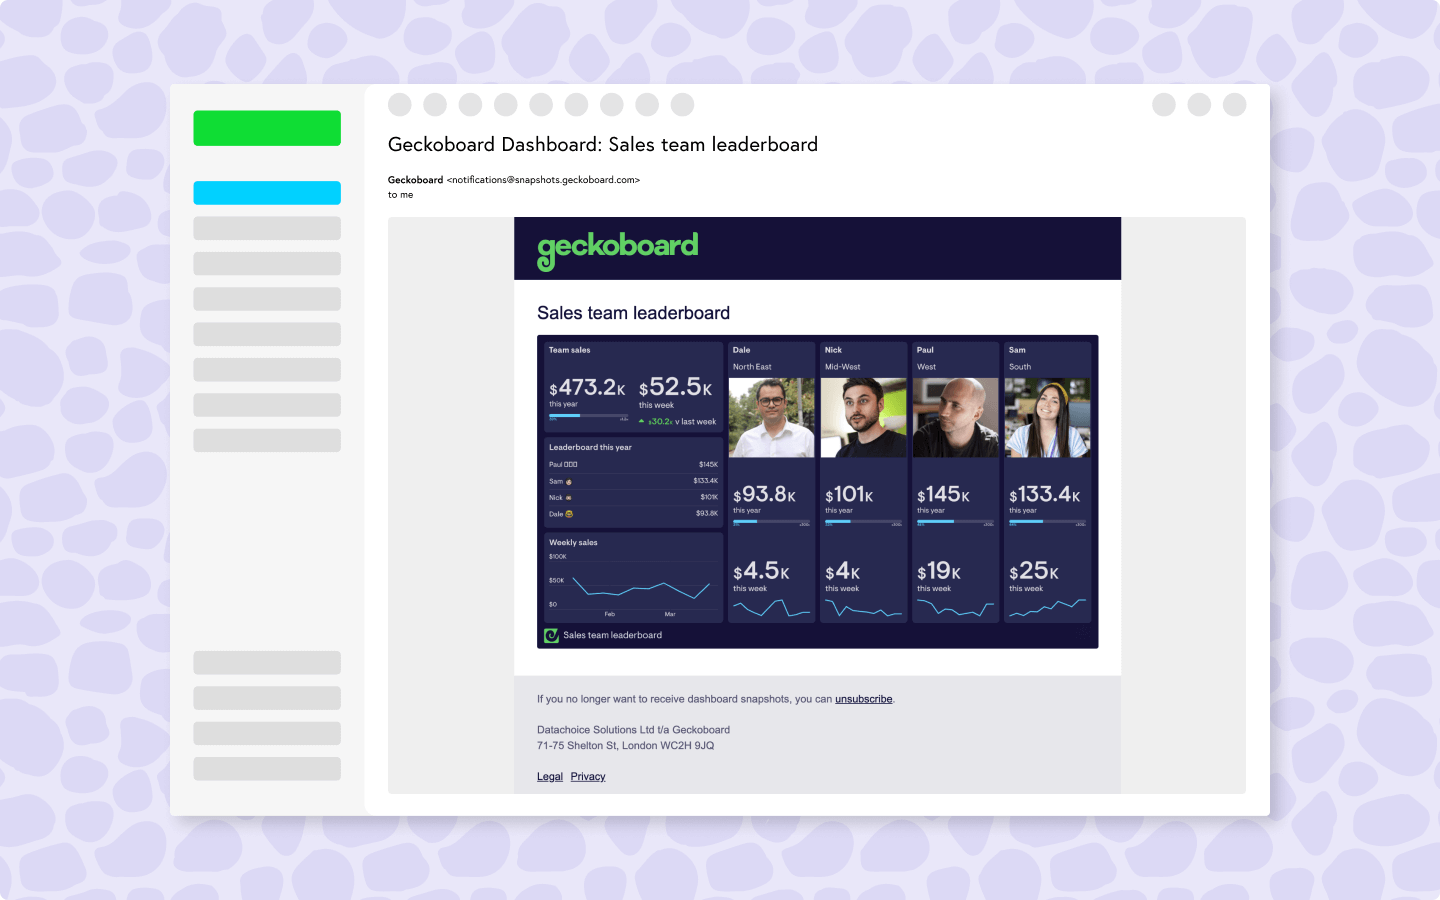
If your sales team works in an office, you can set up dashboards on a TV screen so that everyone is always in the loop on how the team is performing. This really helps to build friendly competition among reps and also drives recognition for their work among others looking at the TV dashboard.
If you have a distributed, hybrid or remote team, Geckoboard allows you to schedule automated dashboard snapshots sent via email or Slack. This is a great way to automate your daily, weekly or monthly sales report updates in a really visual way.
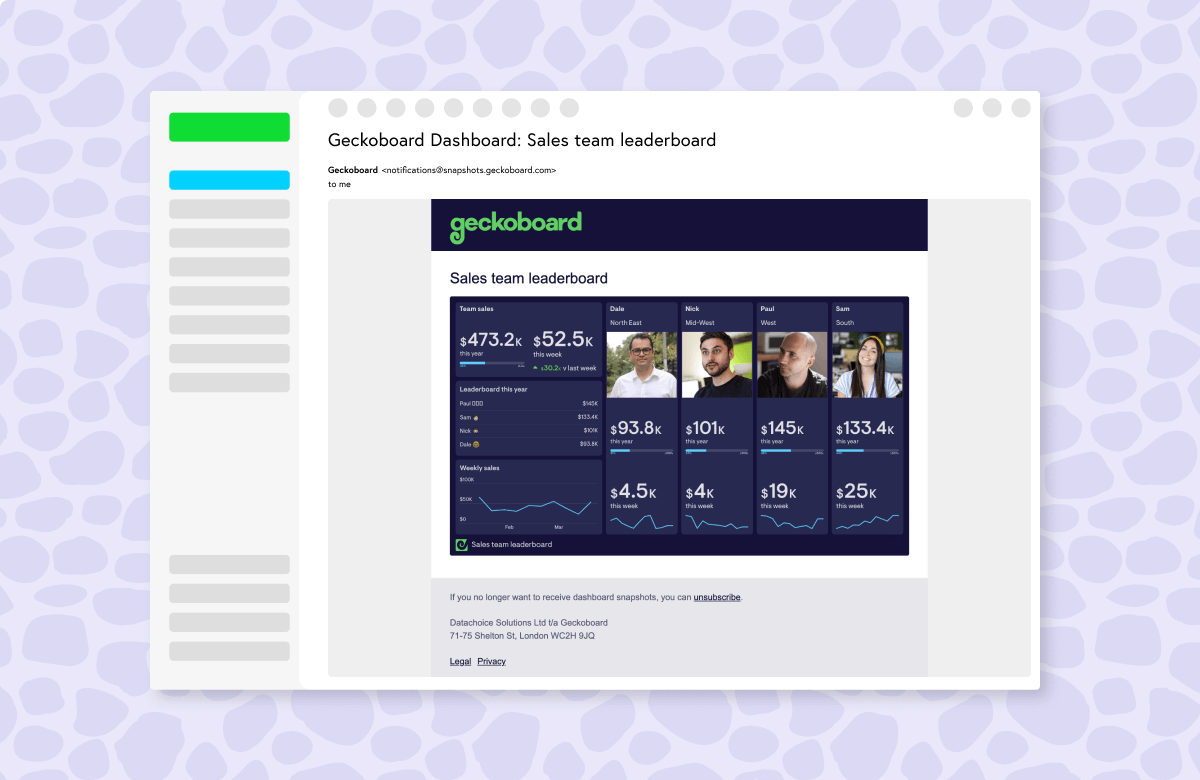
Finally, for fast moving numbers that you’d like teams to have real-time access to wherever they are, Geckoboard has options to use sharing links or mobile view dashboards.
If you’d like to create the above dashboard, use the free Google Sheets template above and sign up for a trial of Geckoboard (14 days free).
