Written by Zendesk Consultant, Jude Kriwald.
Learn what calculated metrics are, why they matter, and how to build your own in Zendesk Analytics (formerly Explore) using Geckoboard's custom metrics and best practices.
Zendesk Analytics comes with a wide range of pre-built metrics, but they rarely cover every reporting need of a CS manager or analyst. That is why many teams turn to custom metrics, also known as calculated metrics in Analytics. These allow you to create tailored reporting that reflects your organisation’s KPIs and processes. This guide explains what calculated metrics are, how they work, and highlights examples from the Geckoboard Custom Metrics and Attributes Library. It also includes step-by-step instructions for building your first custom metric.
Why you need custom metrics
Out-of-the-box Zendesk Analytics dashboards provide a strong foundation, but CS managers often need more actionable insights. For instance, you may want to measure the percentage of inbound calls that were abandoned in IVR, or highlight tickets resolved in less than 20 minutes. These views are not possible without creating calculated metrics.
By embedding logic directly inside a metric, you can “lock in” the exact conditions you want. This avoids conflicts with dashboard filters and ensures results are consistent across reports. It also allows you to place different subsets of data side by side for clear comparison.
The core structure
Most calculated metrics use the IF/THEN/ENDIF pattern. This logical structure lets you tell Zendesk Analytics: _if these conditions are true, then count or sum this value_.
Creating Your Own Metric with Hard-Coded Filter demonstrates this clearly. It shows how to embed filter logic inside the metric itself, rather than relying on a dashboard filter. This is particularly useful when comparing subsets of data that would otherwise overlap.
Building your first custom metric
Follow these steps to create a calculated metric using code:
- Go to Analytics → Report Builder and select the dataset you want to use, such as Support - Tickets or Voice - Calls.
- Click the Calculator icon in the right-hand panel.
- Choose Standard calculated metric.
- Copy the code from the library and paste it in. Replace placeholders such as
[Attribute]or"Value"with the exact field names and conditions you want. A great tip here is to use the Select a Field button to ensure you get the name correct. It also helps you find fields when you’re not quite sure of the name.
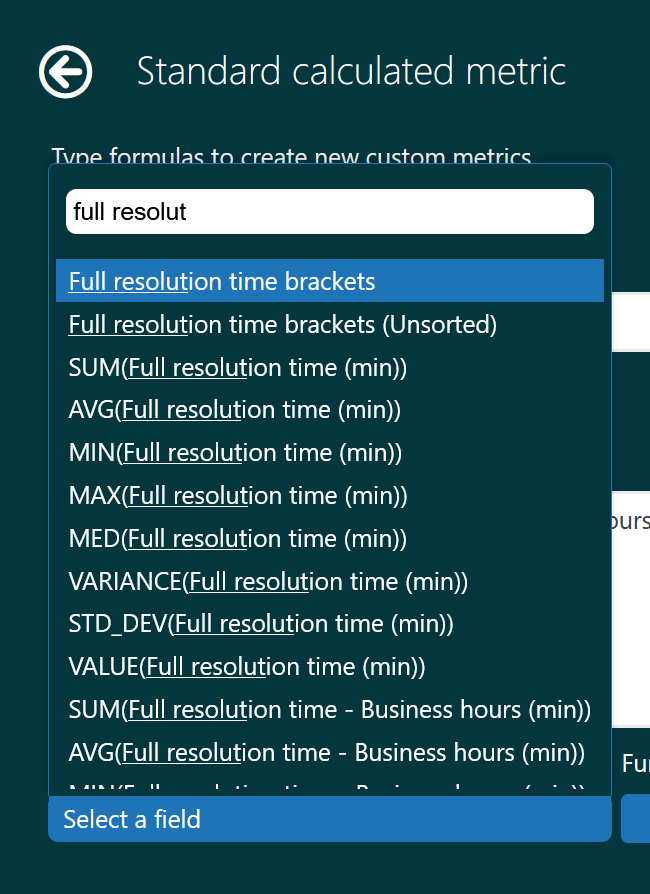
- Check that you have the green validation tick to ensure your code is correct. Best practice is to start by pasting in the code, check that you have the green tick, then change just one section at a time to narrow down which part might be causing you trouble.
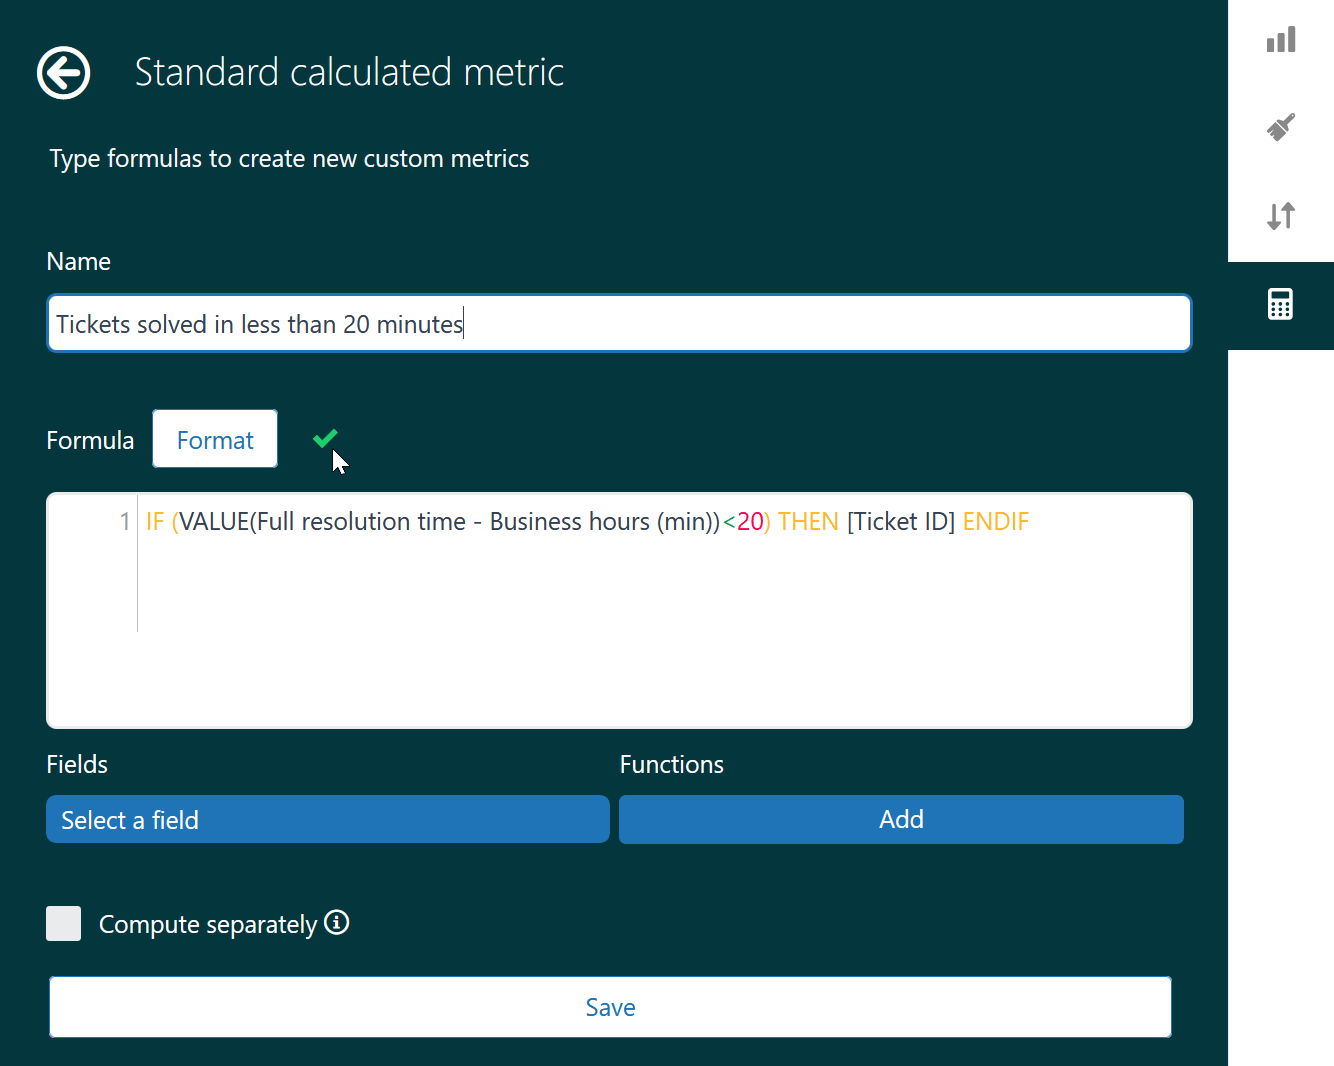
- Save the metric with a clear name, for example “Tickets solved in less than 20 minutes”.
- Under Metrics on the left, select Add, and find your new Calculated Metric under the aforenamed section, or you can search for it.
- Add an attribute such as Agent Name, Year and Week, or something else to view your metric in helpful charts.
Best practice tips
- Use the code you find in this library as templates to build from—they provide working formulas you can adapt.
- Document your work. It’s recommended to keep a central record of custom metrics and their purpose.
- Beware dependencies. Some metrics rely on others being built first, such as % True One-Touch Talk Tickets needing True One-Touch Talk Tickets to work.
- Always validate your results carefully. Try testing results against sample tickets or calls.
Summary
Calculated metrics in Zendesk Analytics let you go beyond default reporting. They can use conditional logic or simple arithmetic. Together, these approaches unlock a wide range of insights tailored to your business.
Once you are familiar with the IF/THEN/ENDIF structure and simple formulas, creating metrics with code becomes a straightforward process that adds real value to your reporting.
For a deeper dive into writing and chaining logic, read Using IF, THEN, AND, OR, and ENDIF in Zendesk Analytics.

