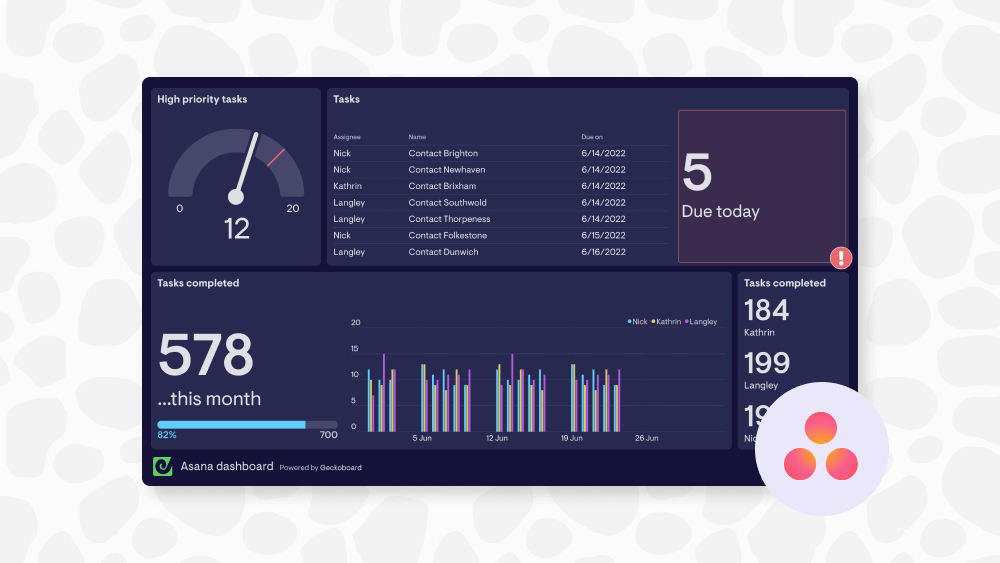
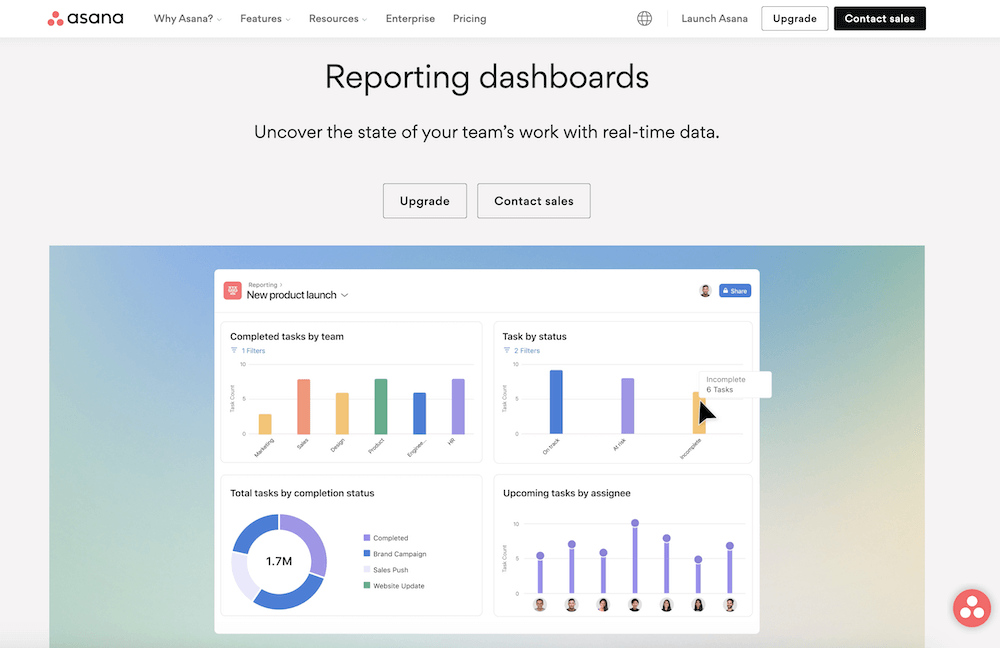
Asana is one of the most comprehensive project management tools out there, with a wide range of features that help teams organize their work. It even has reporting dashboards baked in, allowing you to easily create dashboards for your Asana projects in a few clicks, extract insights from your data, and drill in to the specific tasks from a data visualization.
In other words, Asana’s reporting dashboards are pretty good, which for an opinionated dashboard software company like us, is sometimes hard for us to admit!
So why consider building Asana dashboards using a separate tool like Geckoboard instead? Isn’t that just a bit…pointless?
Well, the answer depends on how you’re thinking about what an Asana dashboard is, and what it can do for you and your organization. If you’re just looking to spin up a simple view of data related to an Asana project, keep dashboards to yourself or a small group of specific individuals, and have the ability to drill into data to access underlying goals and tasks, Asana’s own reporting dashboards will serve you well.
If any of the following are true, however, then it’s time to broaden your options:
- Your project has KPIs that exist in other tools, eg a spreadsheet, database, CRM or analytics tool, which you’d like to see alongside Asana data
- Your wider team would also benefit from seeing dashboards to monitor important data and keep them on track
- You want to send regular updates on your project status, automatically, eg on specific days, every week or monthly
- Asana’s per-user pricing would involve a costly plan upgrade in order to access dashboards
- You’d like to get notified when specific metrics are performing well or poorly
- You want to access Asana reporting data on mobile, or display it on office TVs
In all these scenarios, standalone dashboard software like Geckoboard can help you not only build an Asana-powered dashboard that looks the part, but that will also get seen and acted on, for less than the cost of a coffee a day.
Want to learn how? Let’s run through how to build a custom, real-time Asana dashboard with Geckoboard.
Preparing to create an Asana dashboard
Building a custom KPI dashboard is easier than it might sound, and using the guide below you can expect to have something up and running easily within an hour.
There are a few prerequisites to ensure a smooth setup though.
An Asana account - It goes without saying, but you’ll need an Asana account containing at least one project. Sign up for Asana here.
A Geckoboard account - in this guide we’ll use Geckoboard to build a dashboard. You can sign up for a free 14-day trial using this link (no payment details required).
Creating your first Asana dashboard - a quick guide
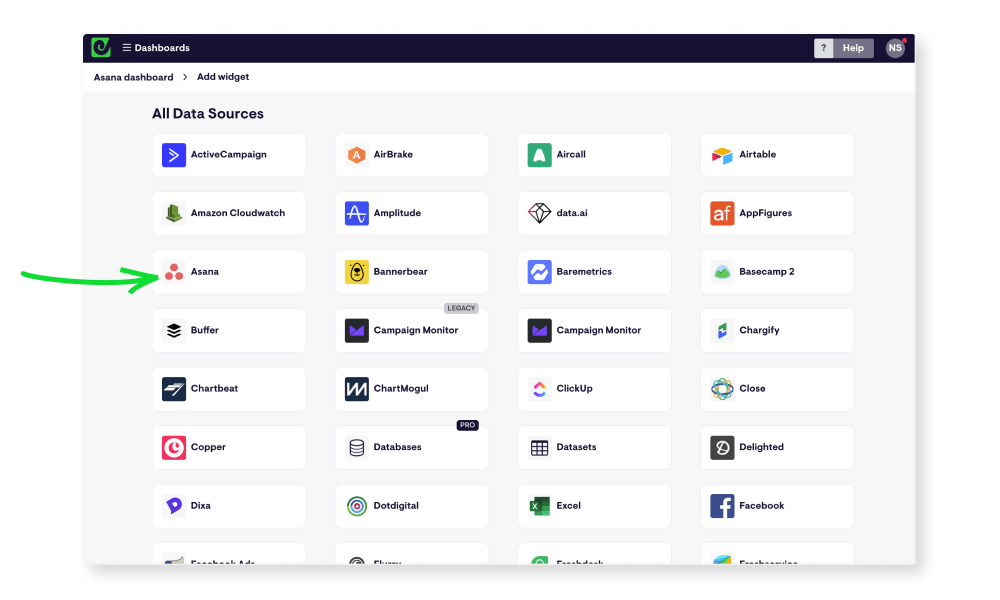
Once you’ve set up a Geckoboard account the next step is to connect Asana so you can start visualizing your project data. In Geckoboard’s list of data sources, select the Asana integration to get started.
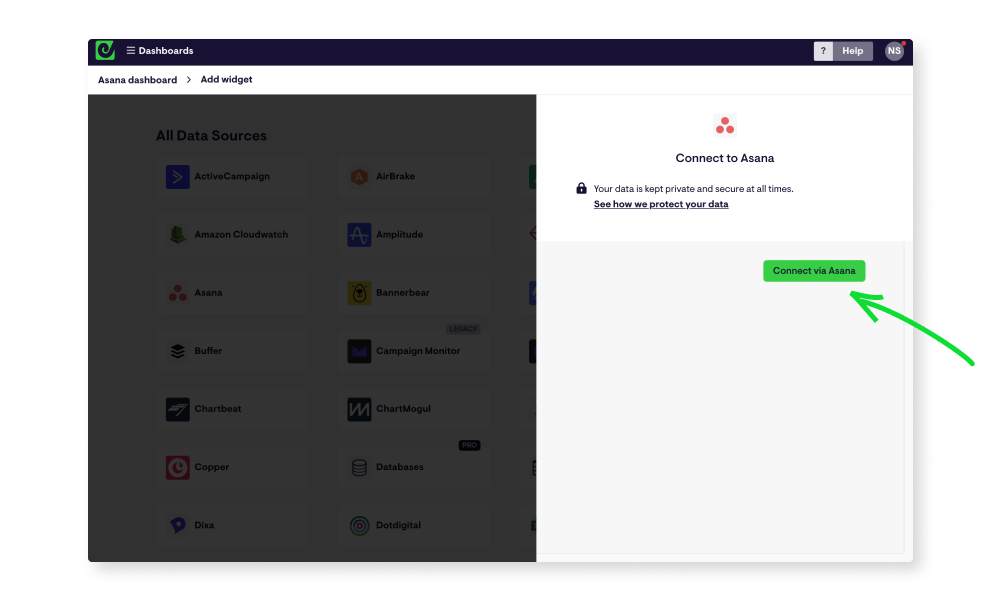
Next, you’ll be asked to set up a secure connection between the two tools, either by logging in with your Asana account, or clicking ‘Allow’ if you’re already logged in.
Continue to set up your first widget (live data visualization) by selecting the Asana project you’d like to show data for, and you’ll then be presented with a range of options on the left. These will allow you to define what information is shown, for example whether you’d like to display a list of tasks with specific properties, or the number of tasks.
You can filter by properties like assignee, due date, priority, approval status and creation date, as well as choosing the time period your data should cover. You can also easily change visualization type, from simple numbers to gauges, tables, line and bar charts and leaderboards.
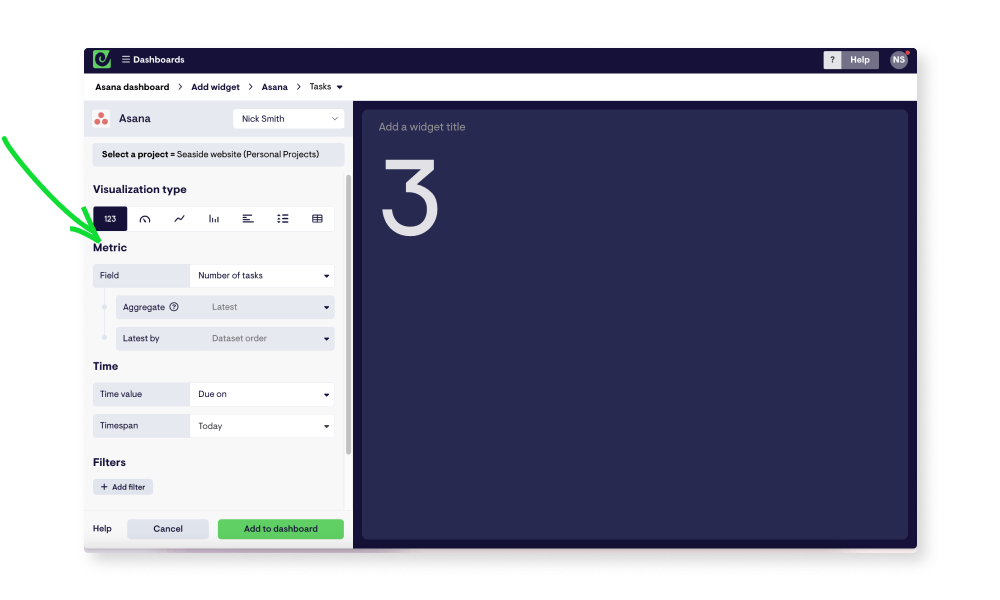
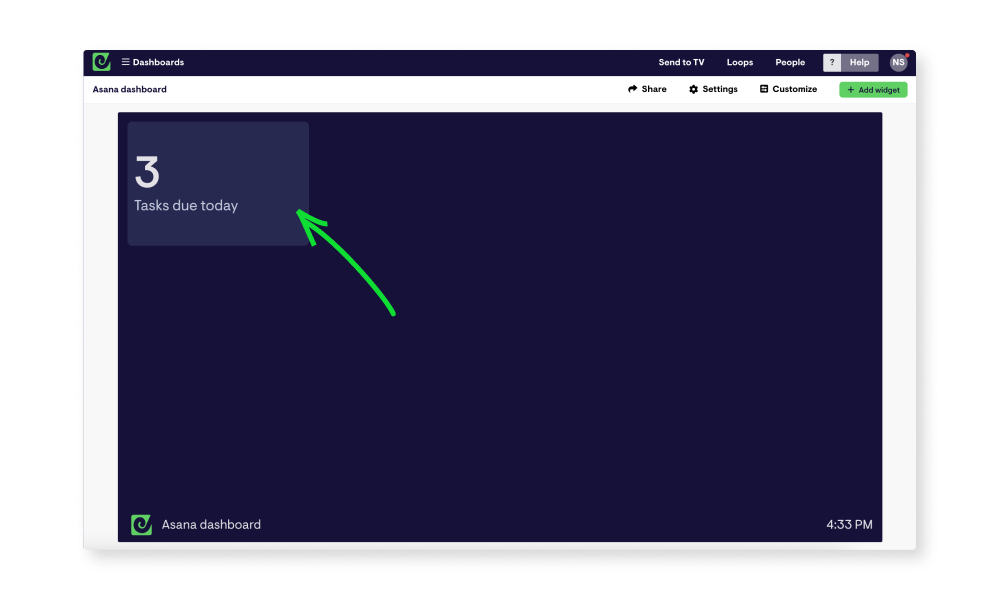
When you’re happy, click ‘Add widget’ to see your dashboard, which will now contain your first block of live data from Asana! Geckoboard’s Asana widgets refresh every few minutes automatically, so your dashboard will always display up-to-date information for whoever looks at it.
Adding live metrics from other data sources is just as simple, and you can add data from several different sources to the same dashboard.
Click ‘add widget’ to see a list of possible data sources, and select the one you’re interested in. From there, follow the steps to connect the data source and add more widgets. When your dashboard is full, it’s time to share it with others in your organisation.
How to share your Asana dashboard
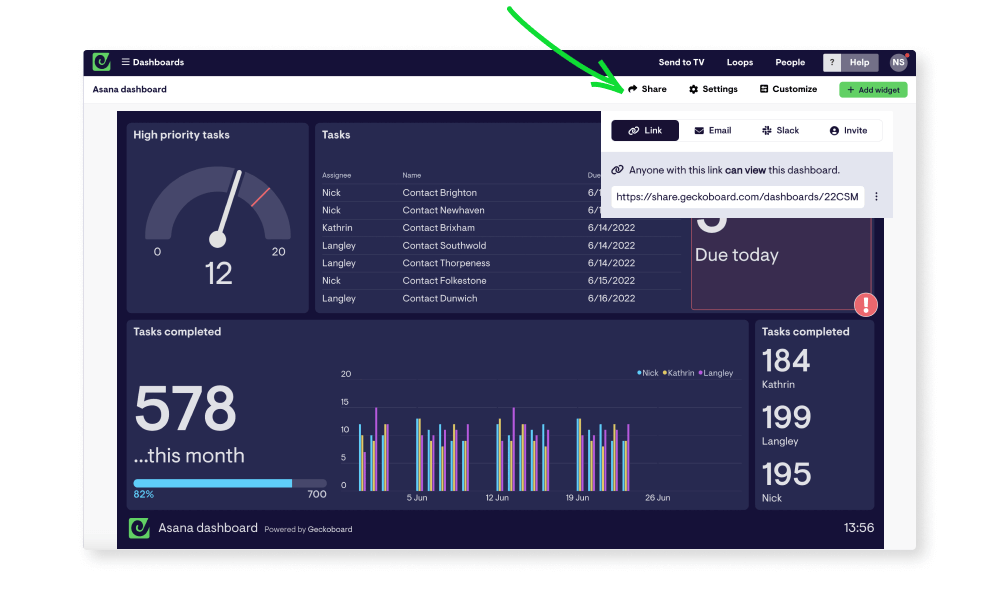
With your dashboard complete, you can make it easy to access for you, your team and stakeholders, regardless of whether they have an Asana account or not. You can do this in a number of ways.
Click the ‘Share’ button in the top right of your account to find options to share your dashboard as a link, schedule snapshots of your dashboard to regularly send to Slack or over email, or invite others to join your account and view dashboards on mobile devices.
You also have the option to display your Asana dashboard on a TV or large screen in your workspace - something Geckoboard is especially suited for. To learn more about how to get your own live TV dashboard up and running, check out the overview here.
Get notified when metrics change
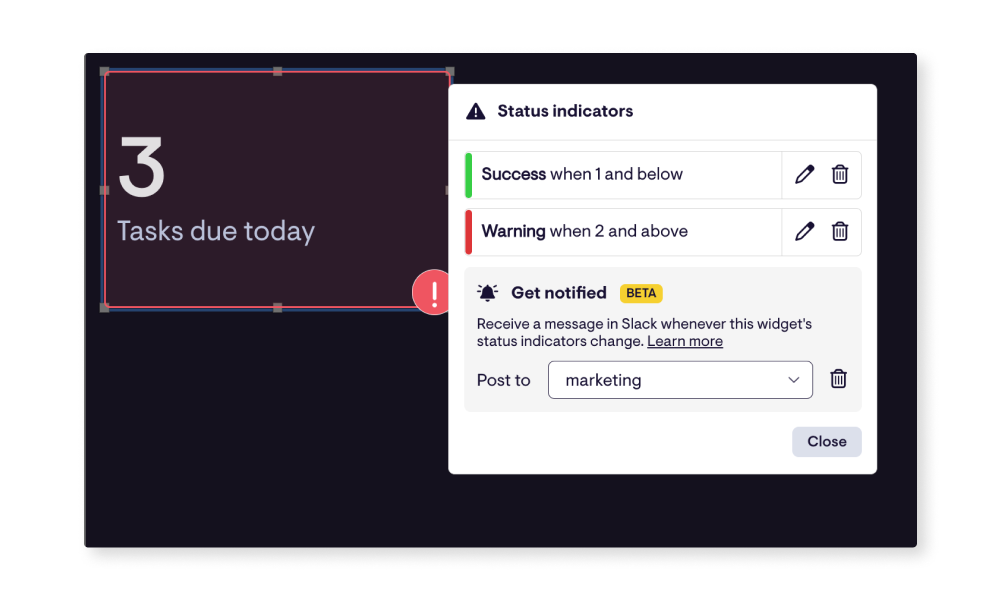
Something else Geckoboard does well, is highlighting when the metrics you care about have changed significantly. It does this in two ways.
You can add status indicators, which will turn metrics red or green when they change beyond the thresholds you set.
This is ideal if you have your dashboard running in your browser, or displayed up on a screen. If you’re not regularly looking at your dashboards though, you can go a step further and set up notifications. Then, when your metrics change, you’ll also receive a message in a Slack channel of your choice, pointing out what’s changed, and by how much, so you’ll never miss something important.
Hopefully this quick guide has given you an overview of how easy it is to create a custom Asana dashboard, and you’re feeling inspired to build your own. If you’d like to learn more about how Geckoboard can help you monitor key metrics and start a free trial, follow this link.
