Pipedrive is a popular choice of CRM system for sales teams, especially in small to medium sized businesses. It provides an easy-to-use interface and powerful features that help teams manage sales performance, track progress and generate sales reports with ease.
With Pipedrive, sales teams can create pipelines, assign tasks, set deadlines and monitor key metrics. They can also track leads, set targets, and view detailed analytics to gain valuable insights.
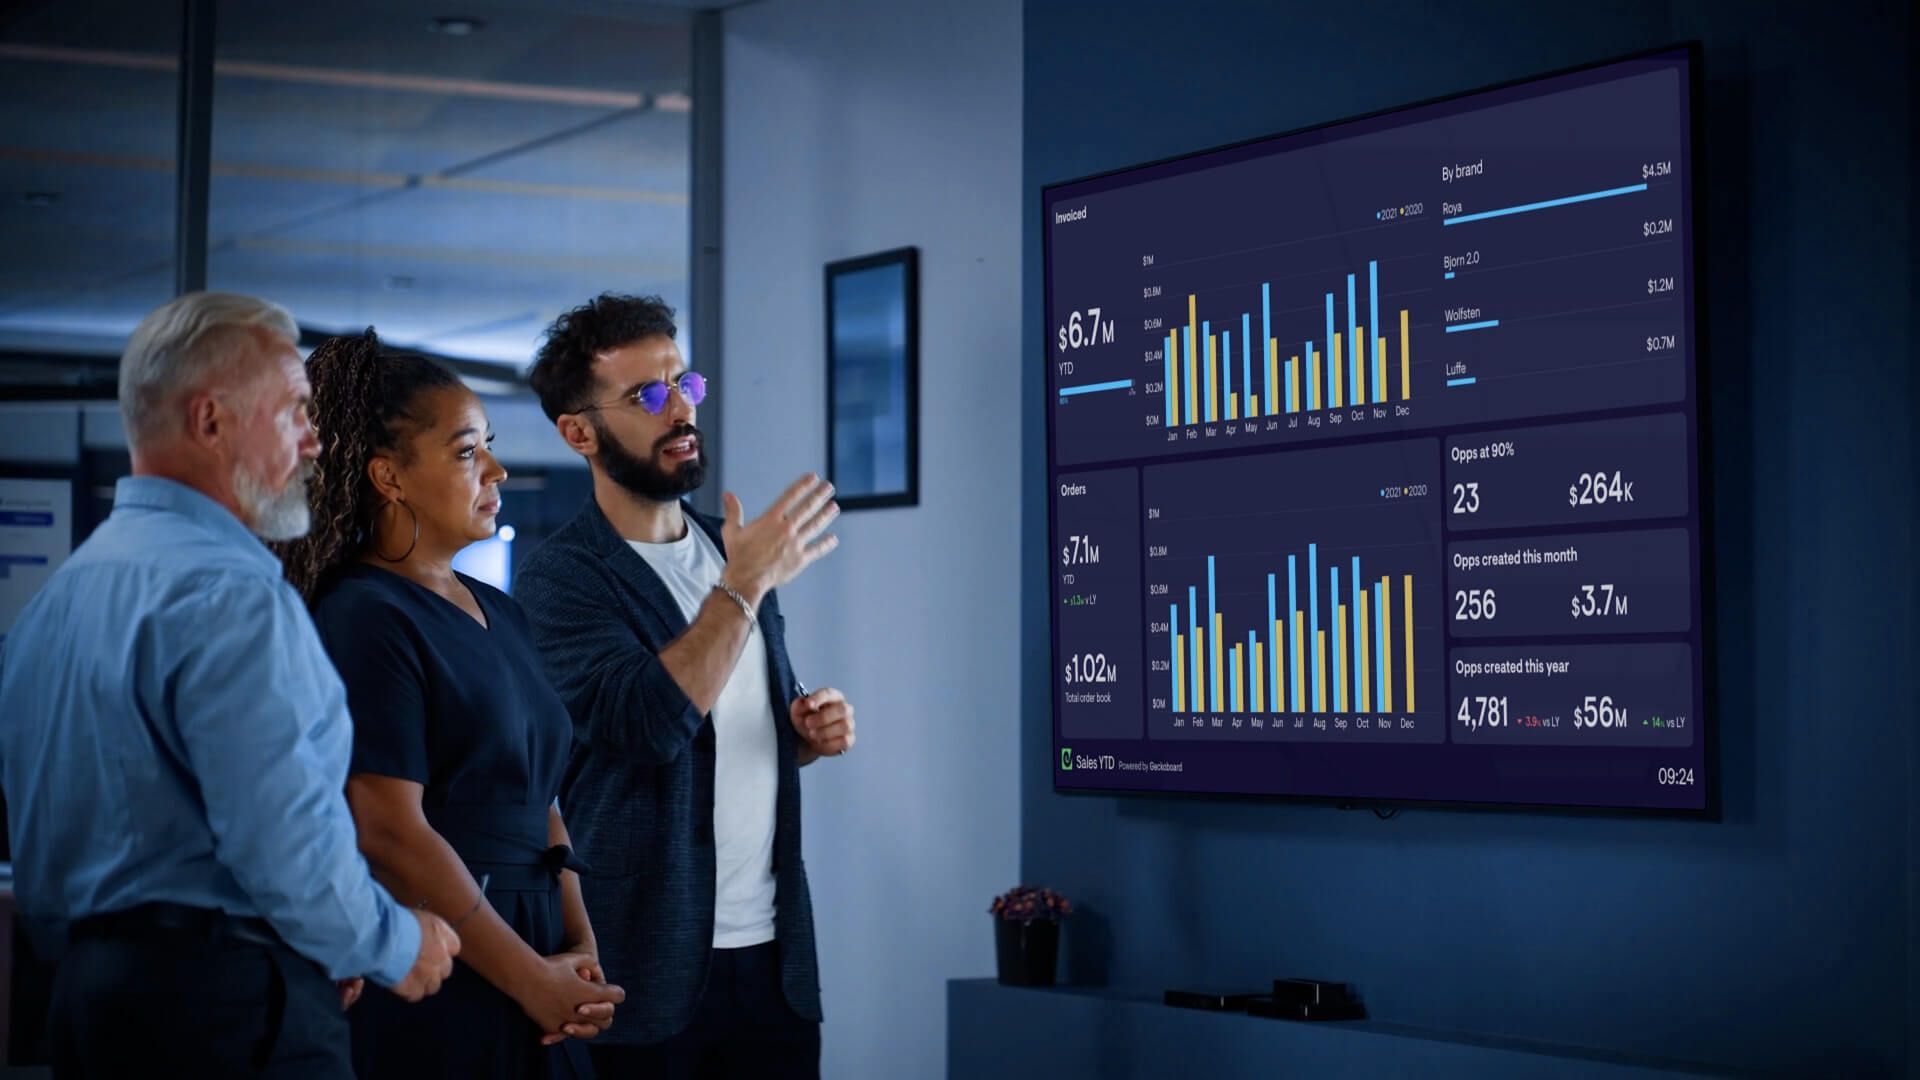
Displaying pipedrive metrics on a TV dashboard
If you are a sales team leader who uses Pipedrive, you may have considered displaying your Pipedrive metrics on a TV dashboard – where the entire team can see their sales pipeline in real time.
In fact, a TV dashboard can have many benefits:
- Important changes (such as new sales opportunities, or a change to the pipeline) are spotted quickly, so you can take early action.
- Team members become more familiar with sales metrics, including how the numbers fluctuate over time.
- Goals and targets become integral to your team's culture, helping to create a focus on KPIs and how your targets can be met.
- Other members of the company have access to you sales performance metrics, including non-Pipedrive users.
Why can’t you directly display Pipedrive on a TV?
Instead of creating a custom dashboard for TV display, you might ask: wouldn’t it be easier to just connect a TV to a browser, where I can already view Pipedrive?
It’s a fair question, but it’s not practical for a few reasons:
- Pipedrive isn’t visually optimized for TV display. Plus, in order to access the data you need, you would need to click and scroll.
- It wouldn’t necessarily display live data, at least not without manually refreshing your reports.
- You can’t display Pipedrive data alongside metrics from other sources such as Excel, Google Analytics, Shopify or Zendesk.
Building a TV dashboard for Pipedrive
To display Pipedrive data on a TV, you will need to use a third-party dashboard tool.
It’s important to ensure your dashboard software is optimized for TV display, meaning it can be displayed in full screen, does not require interaction, can be understood at a distance, can be displayed indefinitely, and can be updated remotely.
Fortunately, Geckoboard is designed to meet all of these requirements.
In the following guide, we’ll show you how to create a TV dashboard for Pipedrive with Geckoboard.
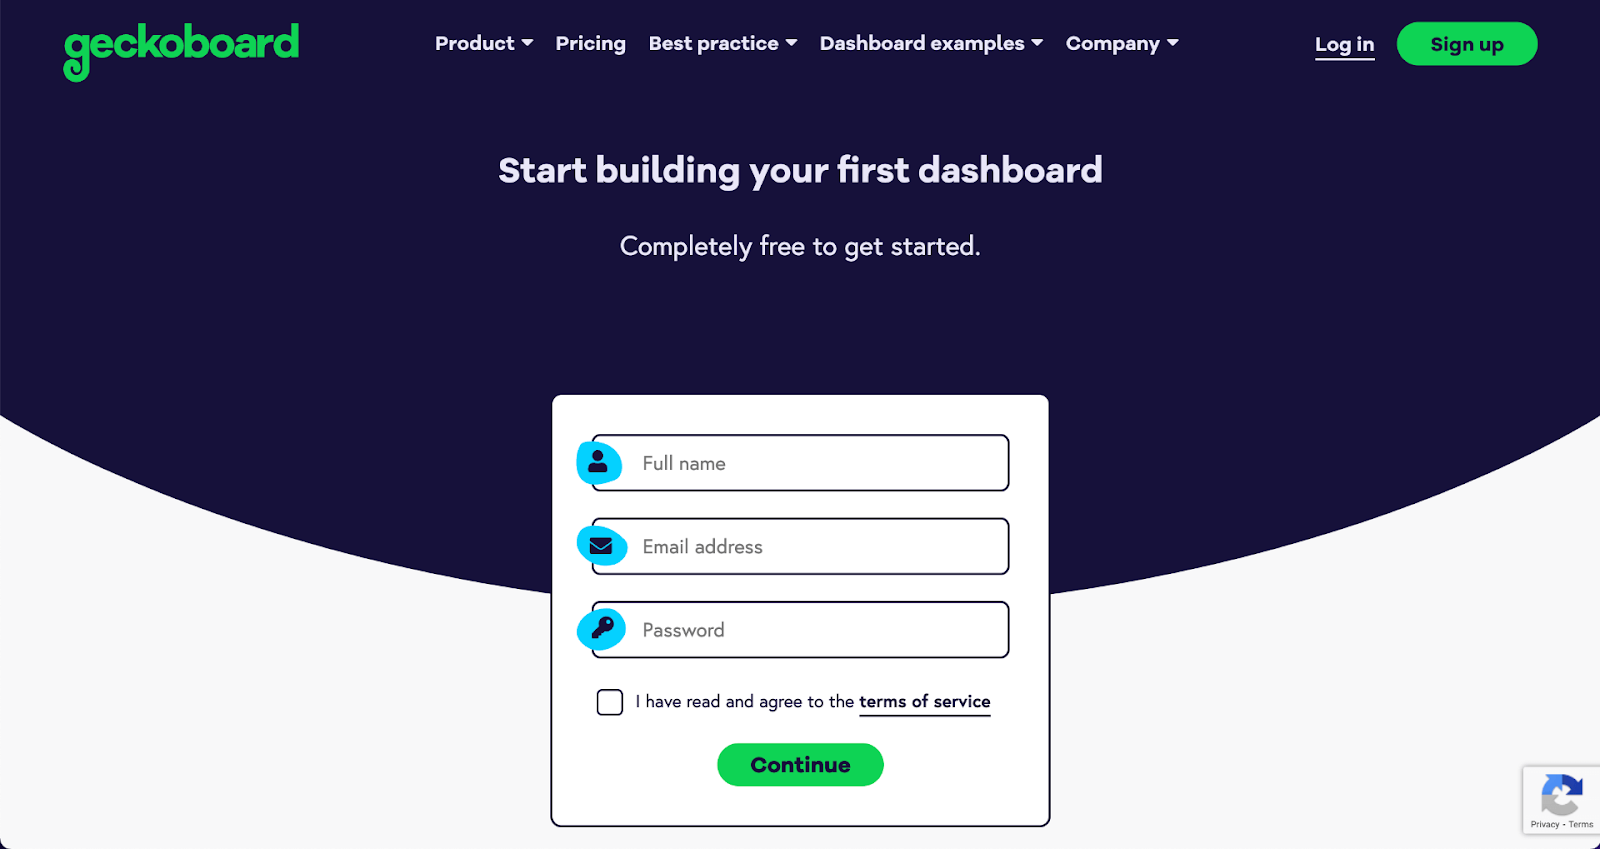
Step 1: Signup to Geckoboard
Sign up for a 14-day free trial – no credit card required.
Step 2: Connect your Pipedrive account
To start building, click ‘add widget’ and select Pipedrive.

Choose any of the widgets to get started, then log in to Pipedrive to create your connection to Geckoboard.

Step 3: Add a widget to your dashboard
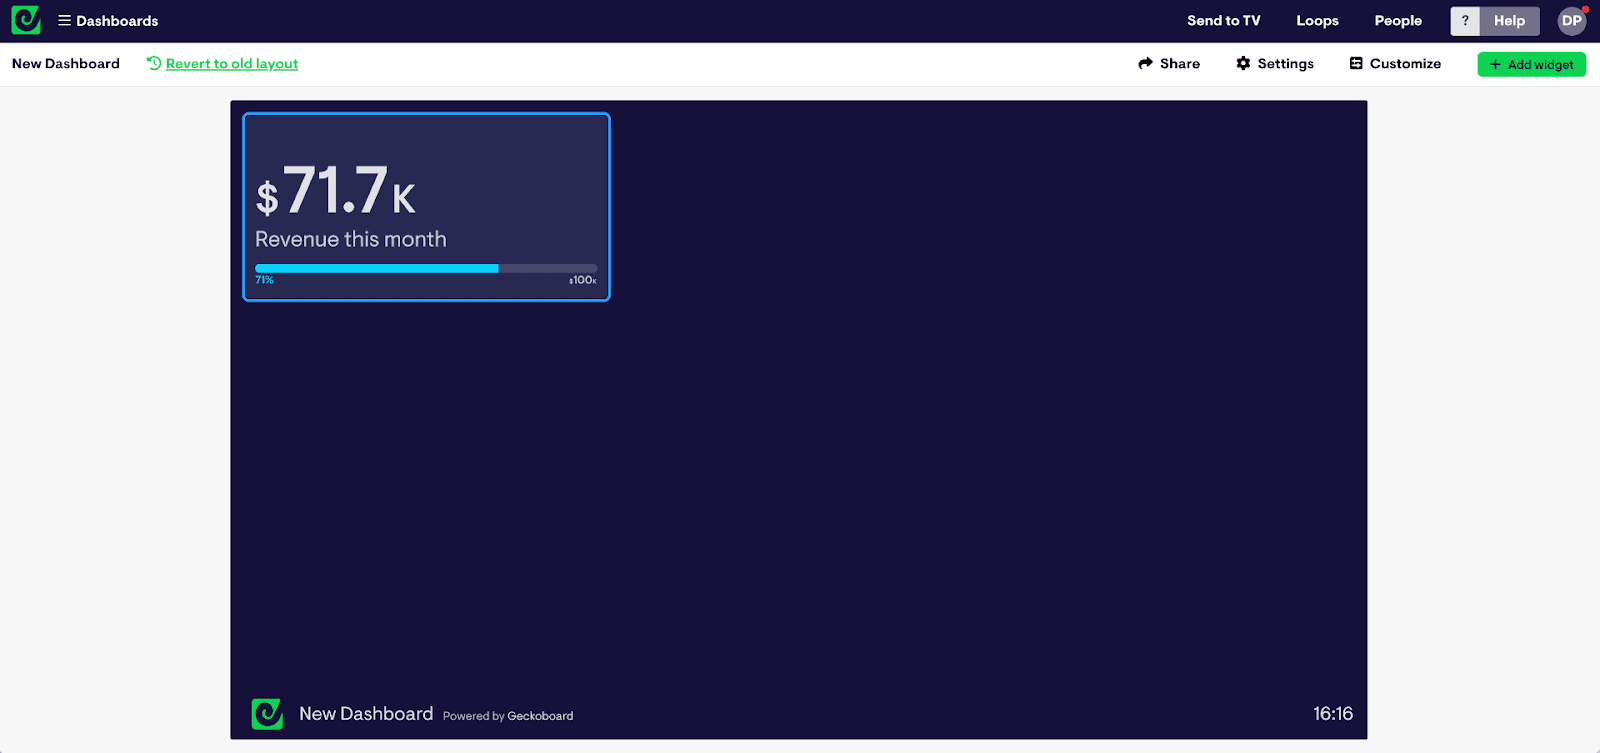
Once a connection to your Pipedrive account has been established, you can begin creating visualizations, which we call ‘widgets’ – including numbers, bar charts, line charts, and leaderboards. This can display anything from sales activities, revenue, won and lost deals, or leaderboards that show team performance.
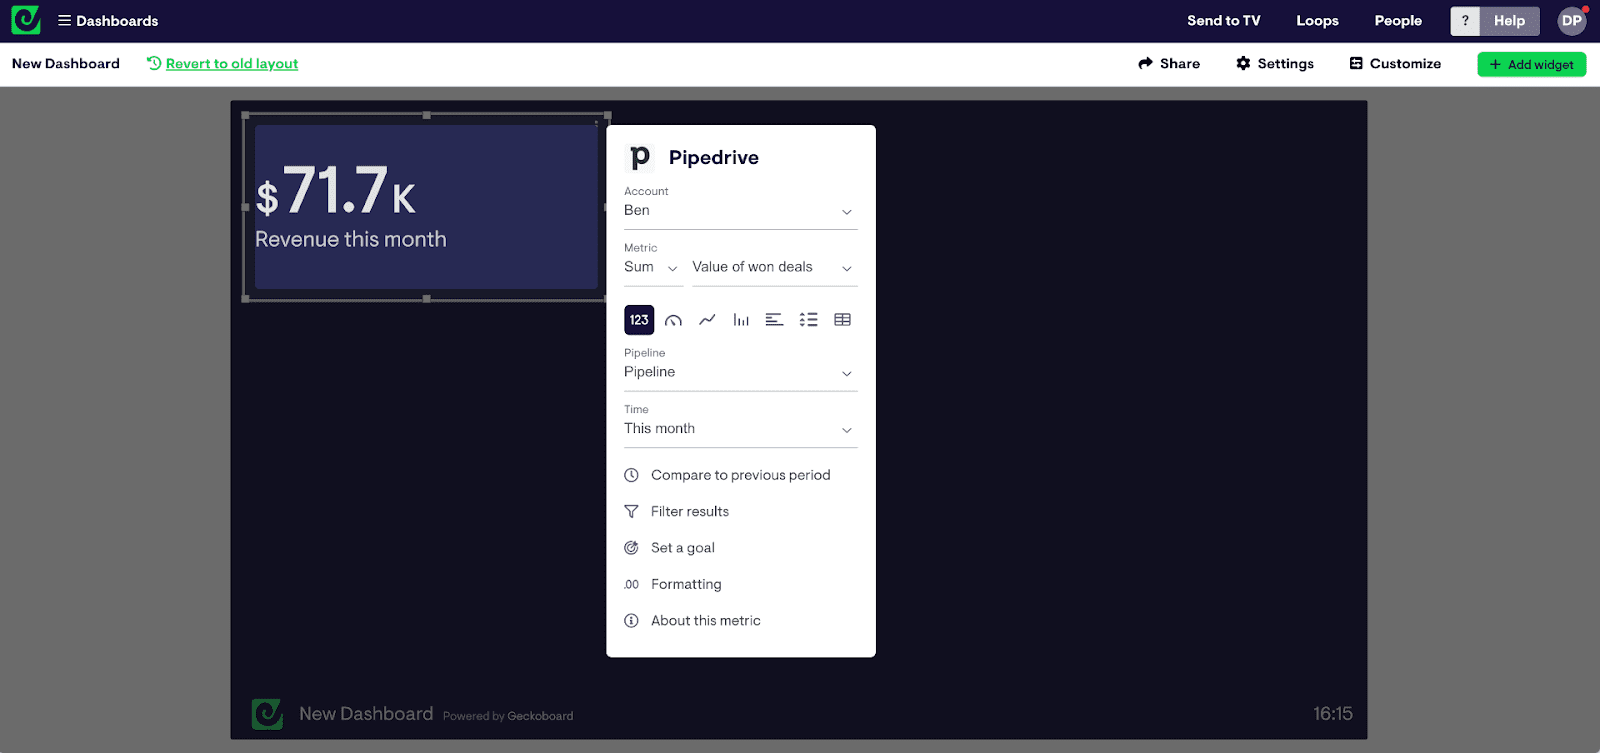
You can add context to widgets by adding goals, comparisons, and status indicators. This allows viewers of the dashboard to understand the significance of the metrics being presented to them – so they know if they are positive, negative, typical, or anomalous.
Step 4: Build up your dashboard by adding more widgets
Once you’ve built your first widget, you can start to add more, building up a dashboard that shows your sales team’s most important data.

You can drag and drop widgets to move them, make them bigger, or combine them into groups. You should put your most important metrics in the top left hand corner so they are prominent and easy to spot.
Try not to overload your dashboard with too much data. It should be easy to read and understand, at a glance.
Step 5: Share your dashboard virtually
Before you display your dashboard on a TV, you might want to check out Geckoboard’s other sharing options. You can create live sharing links to view your live dashboard from any browser, or set up regular snapshots of your dashboard to be emailed or shared on Slack. This makes it easy to keep your dashboards visible, especially if your team works remotely.
Step 6: Choosing the right hardware
In order to display your Pipedrive dashboard on a TV, you will need:
- A TV screen – any HD TV should work. You can also use a computer monitor but these are normally smaller and more expensive.
- A small computer (one that can run a modern browser like Firefox or Chrome). Smaller is often better because it can be stored discreetly behind the TV. We recommend a PC stick or Raspberry Pi, which are generally inexpensive.
- A HDMI lead or similar connection.
We’ve put together a complete guide to choosing the right TV dashboard hardware here. Including why we don’t recommend using a Smart TV, Amazon Firestick or casting device to power your TV dashboard.
Step 7: Setting up your hardware
Once you have your hardware, it’s time to set it up.
Positioning your TV
When deciding where to put your dashboard, consider who needs to view it and how easy it will be for them to see it from their working location.
Kiosk mode
We’d recommend you set up your computer device in kiosk mode. Kiosk mode configures the device so that it runs a single application when it’s turned on, effectively meaning it will always open on your dashboard, every time the device is booted up.
We’ve created some step by step guides to setting up Windows devices and Raspberry Pi in Kiosk mode.
Step 8: Connect your dashboard to your TV
Using a different computer, log in to Geckoboard, select ‘Send to TV’ and follow the instructions.
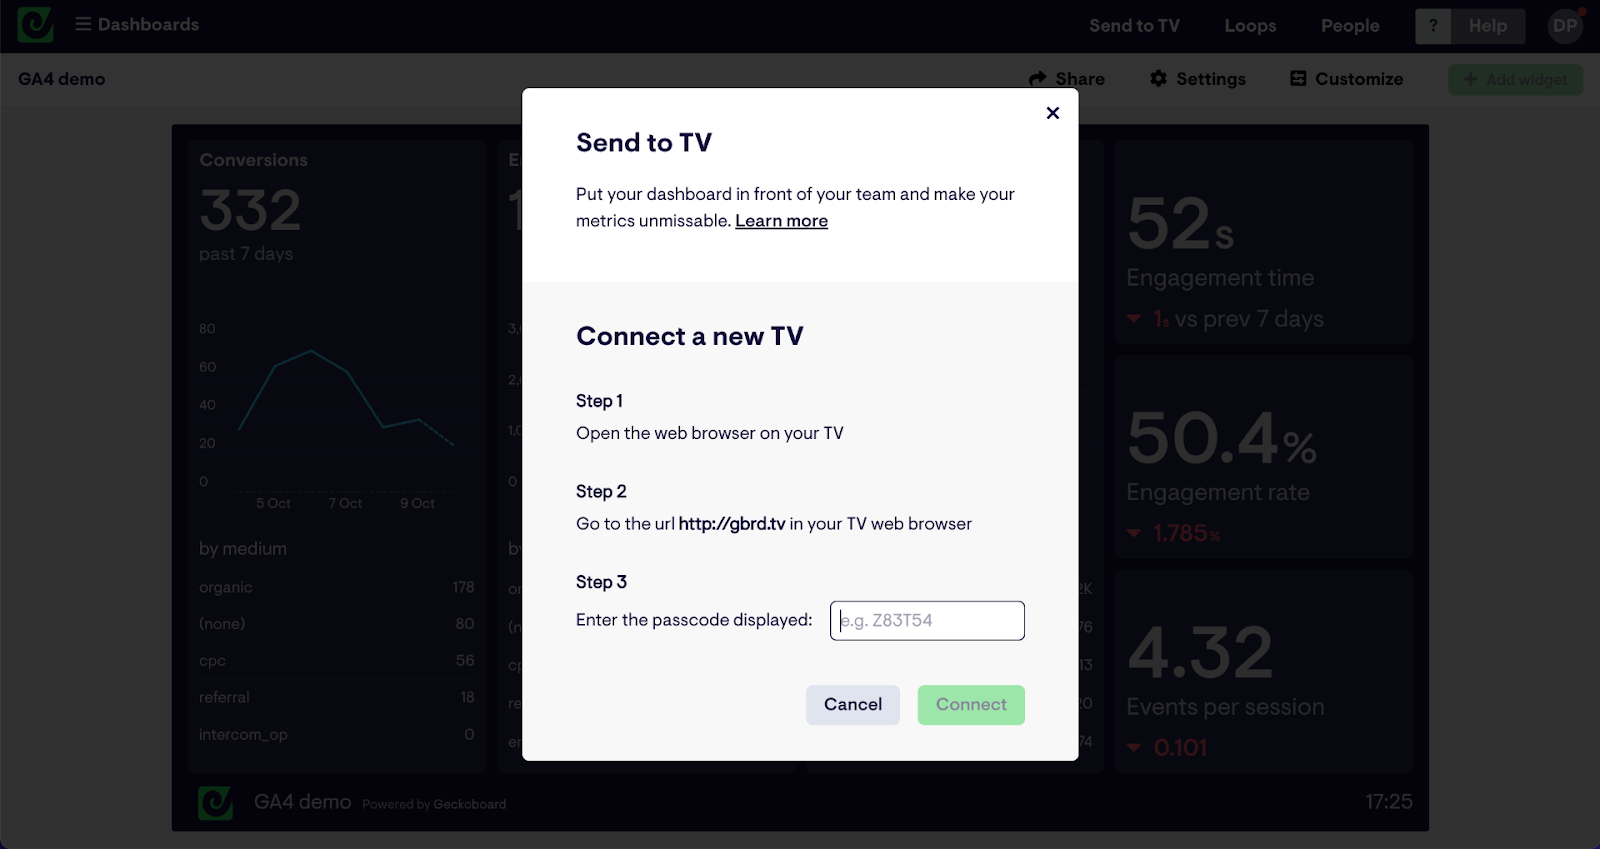
Here you can manage your TV connections, connect a screen using a short URL and passcode, and even choose several dashboards to be displayed on a loop.
We hope you found this guide useful. Click here to start your free trial with Geckoboard and create dashboards for Pipedrive and over 80 other different data sources.
