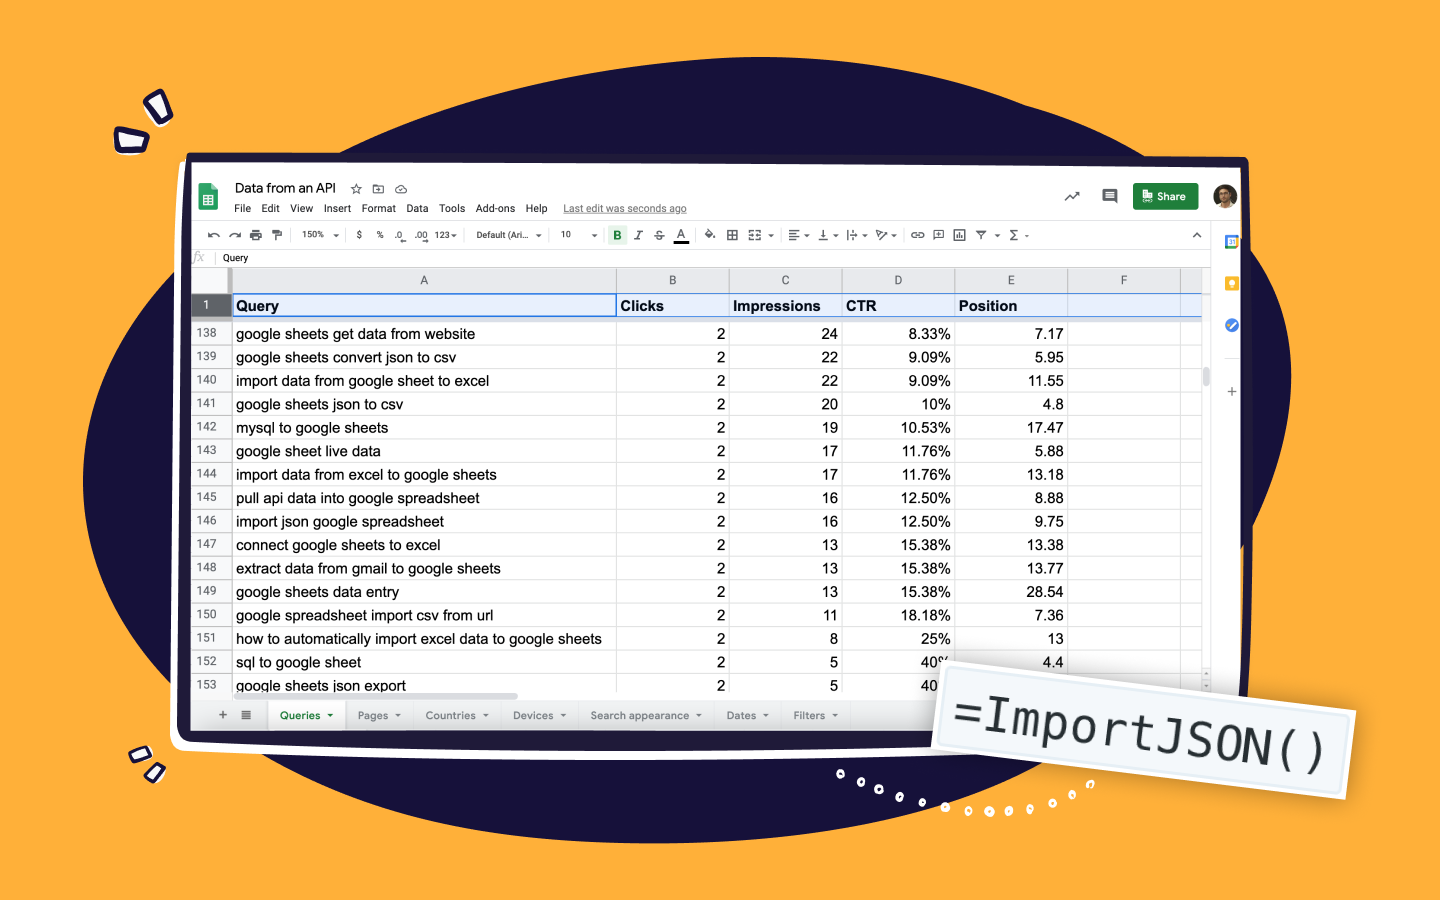
Importing JSON is a powerful way to pull data from public data sources to store, enrich or analyse. While Google Sheets offers a built-in =ImportData() function that can retrieve JSON data, we recommend using a trusted community script that adds an =ImportJSON() function to Google Sheets. With ImportJSON the JSON data gets transformed so that it’s correctly formatted in rows and columns in your spreadsheet.
Let’s use ImportJSON to retrieve data from an API endpoint. For this example we'll use CoinDesk's historical price of Bitcoin:
- To begin, create a new Google Sheet.
- Click on the Tools menu and select the option Script editor. This will open a new Google Apps Script tab.
- In the code window, delete the default placeholder function to leave a blank window.
- Head over to the Gist containing the ImportJSON script.
- Click the Raw button in the top right corner of the script window to select all and copy the entire code.
- Return to your empty script editor window and paste the script code.
- From the menu, select File > Save.
- Name your code "ImportJSON".
- Close the Script editor and navigate back to your Google Sheet tab.
- In cell A1, enter
=ImportJSON(“https://api.coindesk.com/v1/bpi/historical/close.json”). Be sure to keep the quotes“”and parentheses(). - Press Enter. Your Google Sheet should now populate with your JSON data.
Alongside “url”, there are two additional parameters you can use with =ImportJSON():
“query”– a comma-separated list of paths to import. Any path starting with one of these paths gets imported. (Example:“/feed/entry/title,/feed/entry/content”)“parseOptions”– a comma-separated list of options that alter processing of the data. (Example:“noInherit,noTruncate,rawHeaders”)
If ImportJSON has whetted your appetite for more importing of API data in Google Sheets, you might want to consider some of the other advanced Google Sheets functions out there, an automated option like Apipheny or Supermetrics, or visualizing the data you've imported using Geckoboard.
Beyond Google Sheets: visualizing and sharing your data
Want to take your spreadsheet game even further? Now that you’ve imported data from various sources into your Google Sheets spreadsheets, you can easily visualize and share this information using a dashboard.
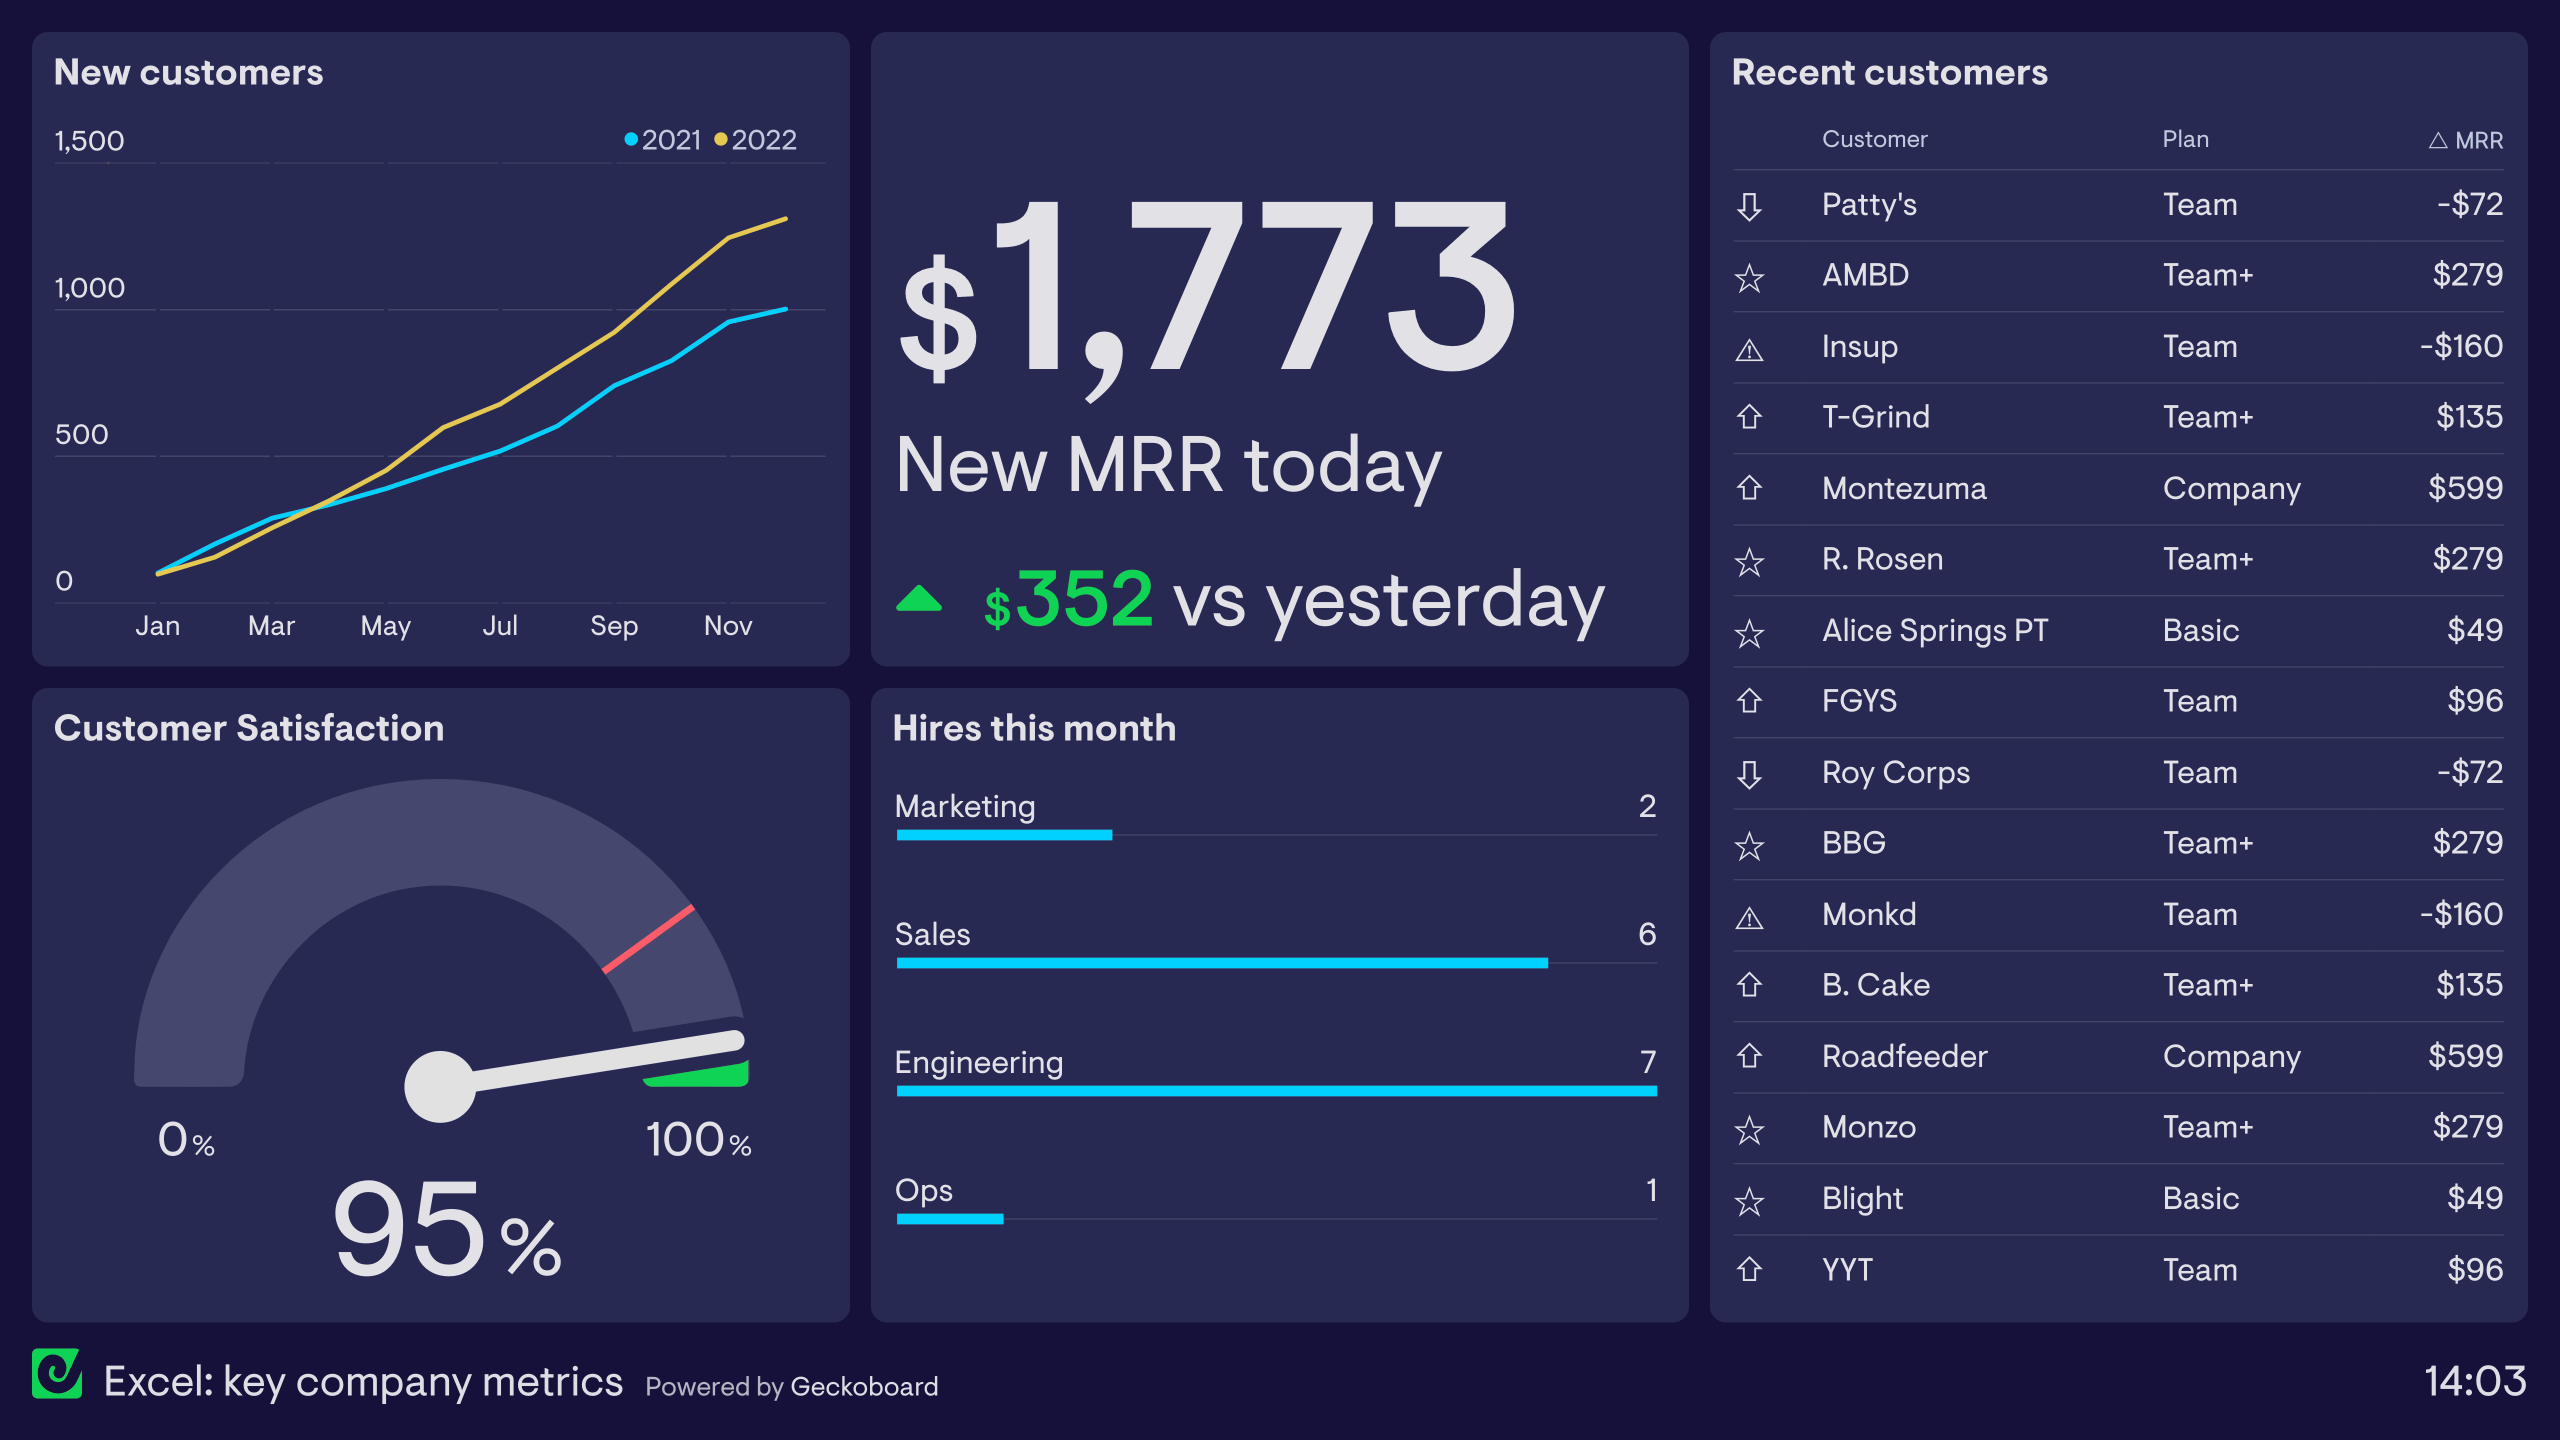
Learn more about this spreadsheet dashboard example here.
The example above contains a variety of visualizations, which can be powered either by Google Sheets or an Excel spreadsheet, which updates automatically to show up-to-the-minute data.
Here's how it works
- Create your spreadsheet in Google Sheets (importing data from via the steps mentioned earlier in this post)
- Sign up for a free Geckoboard account
- Select ‘Add dashboard’, then ‘Add widget’
- Pick the ‘Spreadsheet’ integration from the list of data sources.
- Select your data and choose a visualization
- Build out your dashboard by adding more visualizations
Watch this in action in the video below!
