These days, data is being collected by almost every aspect of an organisation. We’ve developed software that allow us to structure and analyse that data in more sophisticated ways. The problem, however, is making sense of that data and making it accessible to people who are not data scientists or data analysts, people who are not living and breathing that data day in and day out. The opportunities that come with the liberation of data are infinite, and it’s exciting to think about what can be done when you can deliver the right data to the right people at the right time.
Making data easy and enjoyable to consume
Data collection, structuring and analysis are fields that have been worked on for decades. We've gotten relatively sophisticated in all of those areas, but the end result of it is actually what's important. Because the end result, the product of those, is the data itself, and this is what needs to be delivered to the people whose lives could be enhanced by that data, allowing them to make better decisions informed by the right information.
I think most people would agree that it’s not an enjoyable exercise to dig through a spreadsheet trying not only to identify, but also make sense of the numbers you need. In order to take that raw data and deliver it in a format that people can intuitively understand, we need to understand a little bit about how we, as a species, have evolved to digest visual stimulus.
The goal is to try and get data into the cognitive area of the brain as quickly as possible, without impediments and without friction. Firstly, in order to be able to communicate data in an effective way, we have to be very sympathetic to how the human brain processes data. Charts, spreadsheets and databases can be very complicated for us to process, and because of that, people might experience certain levels of intimidation when looking at them. Why? Because they don't know where to start and they don't know how to analyse and break down the data.
There’s the physiological side to data communication – it has to be easy to consume, being mindful of how we’re built and how we inherently process information. But also, consuming data has to be something that we want to do. It has to be enjoyable. A big part of that is removing that initial feeling of intimidation when you're presented with vast amounts of data.
Those two things are the key challenges – making data communicable to humans and making people want to look at it. If you can unlock both of those, you could unlock all or at least a lot of the power that's been isolated or concentrated amongst certain roles and certain areas within an organisation. That's what we mean when we talk about communicating data for people. In essence, these are the two problems that Geckoboard is trying to crack from a product standpoint.
Designing for the human brain
Design is about more than how something looks. In fact, how something looks is a byproduct of design. Design is about understanding how it's going to be used. If you understand how something is going to be used, you can design something that effectively demonstrates that purpose.
A few years ago, I wrote a blog post comparing the dashboard design of a Lamborghini Aventador and a BMW M3. The Lamborghini is an extravagant and expensive car. The dashboard, as a result, appears to have been designed with a ‘Wouldn’t it be cool if…?’ mindset. When you look at the dashboard, you find a vast variety of colours, fonts, font sizes and movement. The net result of that is something that isn't fit for its primary purpose – that it's a driver's aid. You don’t need to see a ‘cool’ dashboard when you're going around the corner at 180 miles an hour. All you need to see is that you’re in control, in this case, something that’s arguably impossible to do at a glance.
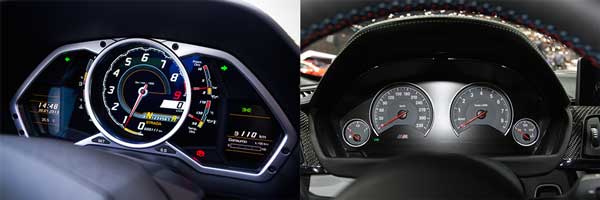
Instead, if we take a look at the dashboard of the BMW M3, we can see an entirely different philosophical approach. We’re now looking at a dashboard that’s the result of someone that asked themselves, ‘What does the driver need to see and how can we present that data in the most effective way possible?’ There are no bells and whistles. It doesn’t look cool or flashy. But it has an innate beauty because they stripped away everything that was an unnecessary distraction and concentrated on the fact that it's a human being driving this vehicle. By concentrating on the human, they’ve created something that, by default, is beautiful to humans, because it fulfills its purpose exceptionally well.
The philosophy behind Geckoboard is that if we can create a design that’s sympathetic to human beings and how we process information, then we’ll have a product that is innately beautiful. While the design of our dashboards is constantly evolving as we become more educated in the area and develop a more meaningful understanding of our customers, we’re designing a tool that’s caters towards the end purpose. That purpose is delivering data that’s free of noise and distractions, creating an experience that allows you to get to the data that you want as quickly as possible and to understand that data as quickly as possible.
In his next post, Paul tackles the ‘Question of colour’, explaining the rationale behind the colour choices of Geckoboard.
