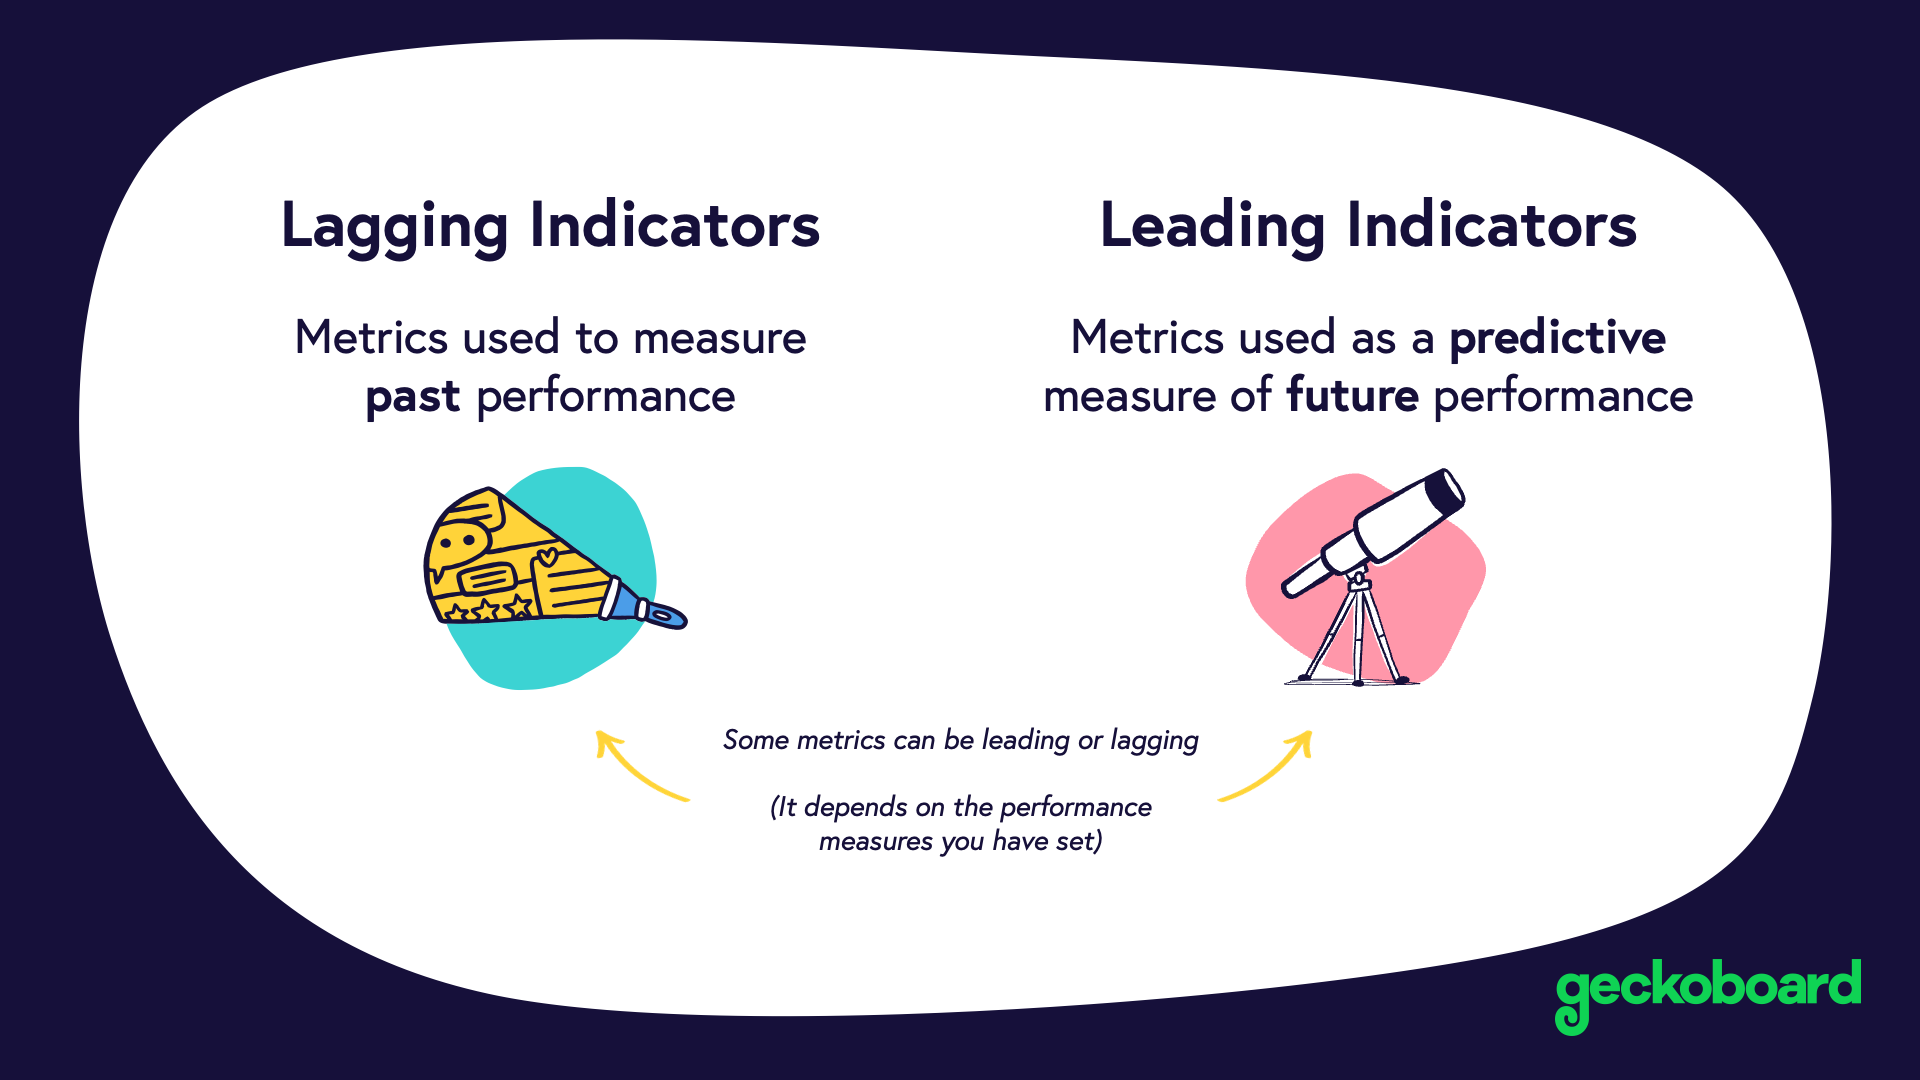
The main point of identifying and tracking specific metrics is to measure your progress toward specific goals. But not all metrics can give you the information you need right away. Lagging indicators take a long time to change, and show the later-stage results of your efforts. Leading indicators, on the other hand, measure the activities you think will help you reach your goal, and can be tracked on a more ongoing basis.
Because of the different time frames required by leading vs. lagging indicators, it’s important to understand when you’re tracking a lagging metric, so you can identify leading indicators to help guide you as you go. Understanding the difference between leading and lagging indicators and how they tie into your objectives will help keep your teams on track and help you accurately monitor progress towards your goals.
There are tons of different dashboard examples you can use to track both leading and lagging indicators within your sales cycle. You can display these dashboards in your office or share via Slack to keep leading indicators top-of-mind for your team.
What are leading indicators?
Leading indicators give early indications of performance. These indicators “lead” to results by showing the progress you’re making toward your goal. Typically, leading indicators are metrics that will help keep you on track so that you hit your strategic objectives.
Say your goal is to close 50 new deals, but your sales cycle is six months. You would want to set leading indicators to help you see if you’re on track to meet your goal in the early months while you’re still far enough ahead to make changes.
Leading indicators for sales revenue might be Pipeline Volume or Number of Calls/Meeting/Emails per sales rep. By tracking these metrics, you can monitor sales activity on an ongoing basis and see if your team needs to increase outreach efforts to meet your Deals Closed goal.
Benefits of using leading indicators
- Faster feedback: By tracking leading indicators, your team can get feedback on their efforts more quickly and determine what actions they might need to take to achieve their over-arching objectives.
- Team involvement: Because there are often many facets to broad goals, there are typically many leading indicators to track. Different team members and departments can own different metrics, so everyone contributes to meeting the company’s larger objectives.
Weaknesses of leading indicators
- Just a proxy: If you’re using a leading indicator as a proxy for a lagging indicator, keep in mind that while the leading metric should affect the lagging indicator, it might not have the impact you expect. It’s important to track both so you can monitor ongoing progress as well as the actual outcome of your changes.
What are lagging indicators?
A lagging indicator is a metric that takes a long time to impact or measure. Because of the time frame involved, lagging indicators are not a good option for providing feedback to teams as to whether their current projects are effective. However, lagging indicators are often the metrics that most accurately measures the actual business impact you’re trying to achieve.
For example, if you’re trying to improve customer retention, it’s essential to track Customer Churn Rate. But Churn Rate is slow to change and can take a long time to show results.
Benefits of lagging indicators
- A clear indicator of success: In many cases, the metric that best assesses the impact of your efforts is going to be a lagging indicator because it takes time for your changes to take effect.
Weaknesses of lagging indicators
- They take time to measure: By definition, lagging indicators measure long-term trends, so they take weeks or months (or even longer) to change.
- You can’t see why: Lagging indicators show an outcome, but it can be unclear what variables impacted that outcome. You may know that your churn rate is high—your lagging indicator—but you don’t know which of the actions you took as a company impacted that rate.
- Difficult to change: Because lagging indicators are often high-level metrics like revenue, impacted by a lot of different departments within the company, small projects may not make a measurable impact. It can sometimes be difficult to tell whether minor changes in the metric are because of your actions or if they are just chance.
Leading vs. lagging indicators—work together instead of apart
A lagging indicator may be the best metric for measuring the outcome of your effort, but tracking lagging metrics alone is problematic. It takes a long time to see results, and lagging indicators can’t help you make ongoing adjustments.
The solution is to use a combination of leading and lagging indicators. Look at leading indicators on an ongoing basis to make changes that will help improve your odds of success.
Use leading indicators that complement your lagging indicators and help you measure progress more quickly. Below are two examples of leading and lagging indicators that pair well together in different scenarios.
Pipeline volume (leading) + sales revenue (lagging)
Let’s say you have a sales revenue goal of $100K for the quarter. Sales Revenue is your lagging indicator because it takes time to grow,and it measures what’s already happened—revenue earned.To measure your progress on an ongoing basis, you focus on improving your overall Pipeline Volume.
Pipeline Volume measures the number of sales-qualified leads you have in your sales pipeline. If you’ve set lead quotas based on the $100K goal, Pipeline Volume should help indicate whether you’re making satisfactory progress toward that revenue target or if you need to boost your lead generation efforts.
Sales Cycle Length (Lagging) + Average Stage Length (Leading)
If you’re trying to reduce how long it takes to close dealswith new processes, then your lagging indicator is Sales Cycle Length. You won’t be able to see the results of new processes until after going through the full sales cycle with several deals and comparing the length to how long previous deals took to close.
To track the progress of your initiatives, look at Average Stage Length for each stage in your sales cycle—the average amount of time an opportunity spends at that stage. This splits up your sales cycle so you don’t have to track an opportunity end-to-end through the process. You can look at people who are currently in a certain stage and measure the time they spend in it, rather than having to wait until a new opportunity cohort moves through the entire cycle.
Average Stage Length serves as a leading indicator because if a lead spends less time in each stage, then they will spend less time going through the sales cycle as a whole. Looking at each stage individually enables you to more quickly identify (and resolve) bottlenecks that might be extending your sales cycle.
Track your leading vs. lagging indicators at different intervals
While it’s essential to monitor both leading and lagging indicators on a regular basis, you don’t need to track them at the same rate. Lagging indicators take a long time to change, so there’s no reason to track them on a daily or sometimes even weekly basis. Instead, check them less frequently, perhaps monthly or quarterly, depending on the metric.
Leading indicators, on the other hand, change more rapidly and should be checked often. Consider adding them to a dashboard so you can track them in real time on a daily or weekly basis. Display the dashboard in your office or share it via Slack or email to keep your leading indicators top-of-mind for your team.
