Most sales leaders have the data. The problem is knowing what it means, and when it matters.
HubSpot captures everything, from deals created to activities logged. But that information often stays locked behind filters or buried in reports. By the time a manager spots a slowdown in the pipeline or realises forecast confidence is slipping, the moment to act has already passed.
This is not just a reporting issue. It is a performance issue. The team keeps working, but without the signals that guide focus or prompt intervention.
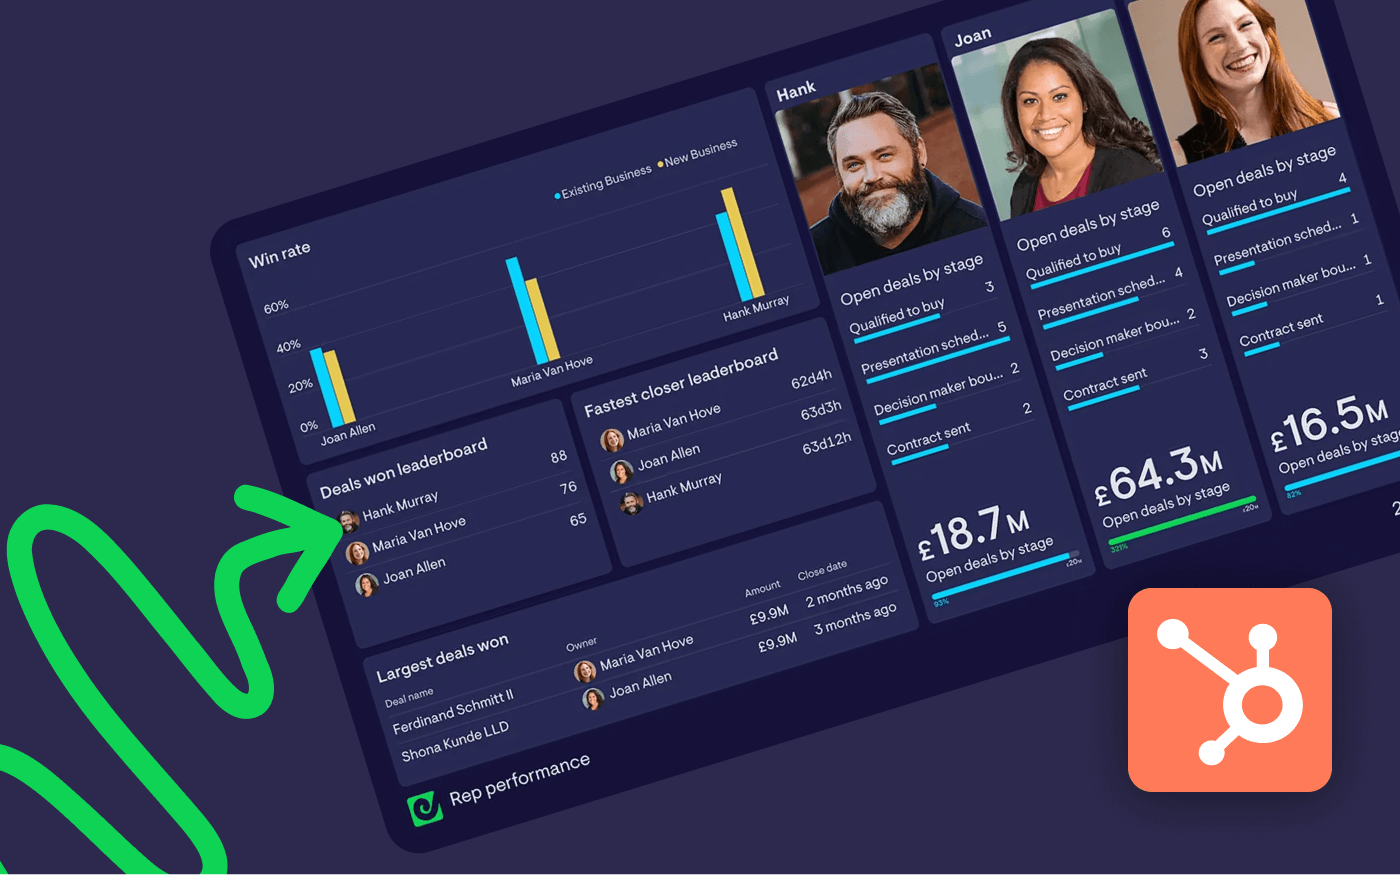
A well-structured dashboard helps close that gap. It brings important data into view, shows movement as it happens, and gives people a reason to respond. Tools like Geckoboard make this process easier by turning live HubSpot data into clear, visible dashboards that are built to be used throughout the day.
This post explores how sales leaders can design dashboards that support decision-making. It focuses on structure, not just reporting, and shows how better visibility leads to sharper coaching, more useful conversations, and stronger results.
1. Choose Questions First, Then Match the Metrics
Many dashboards fail because they are assembled backwards. Sales leaders start with available metrics in HubSpot and build from there. The result is a dashboard that shows activity, but not meaning.
A better method is to list the decisions you make regularly, then work backwards to the questions that support those decisions.
For example:
Decision: which deals to focus on this week
→ Question: which high-value opportunities have not had recent activity?
Decision: whether the team will hit target
→ Question: is forecasted revenue tracking ahead or behind the plan?
Decision: which reps need support
→ Question: who is booking meetings but not converting them into pipeline?
Once you have the questions, you can identify the specific HubSpot metrics that support them. You avoid filler charts and focus only on the data that helps you act.
Use this as your core design principle: one dashboard, one purpose.
2. Structure Dashboards by Workflow, Not Role
Instead of building dashboards by team function (such as SDRs, AEs, or managers), structure them around how decisions are made.
For example:
- Pipeline management: time in stage, number of stuck deals, open deal value by age
- Performance tracking: activity volume, call-to-meeting ratio, progress to target
- Forecast confidence: weighted deal value by close date, comparison to historical trends
Each dashboard should contain only what is needed to support one decision-making context. That helps teams stay focused and reduces the clutter that slows people down.
Geckoboard supports this model well. You can create multiple dashboards using live HubSpot data, each with different filters, layouts, and access settings. Teams can view exactly what they need, in the format that suits them.
3. Choose Metrics That Show Movement, Not Just Totals
Most sales dashboards are built with static totals: number of deals, number of activities, number of calls. These numbers offer scale, but they do not show motion.
Dashboards should reveal whether performance is improving, stalling, or slipping. Choose metrics that track change over time, not just cumulative activity.
Consider metrics like:
- Average time in stage, tracked weekly
- Deal velocity, broken down by owner or segment
- New opportunities created vs deals closed, shown side by side
- Forecast variance, comparing current forecast to prior month
Visualising movement helps managers spot trends before they become problems. It also creates more valuable coaching conversations because reps can reflect on pace, not just volume.
Geckoboard’s visual format makes this easier. You can show change as charts, trends, or colour-coded indicators that highlight whether performance is improving or declining.
4. Make Dashboards Easy to Access, Easy to Act On
A dashboard that is buried in your CRM is rarely used. A dashboard that is seen often becomes part of how people think.
To make dashboards visible:
- Display them on TVs in the office or team rooms
- Post daily screenshots to Slack or email using automated snapshots
- Set up role-specific dashboards as browser homepages
- Use mobile-friendly views for reps who are always moving
The goal is not more dashboards. It is better access. When teams can see the right numbers without having to search for them, those numbers begin to influence daily decisions.
Geckoboard is built for this kind of visibility. It connects directly to HubSpot, updates automatically, and supports a huge range of metrics from Sales Hub and Service Hub. That turns dashboards from reports into real-time guides.
5. Keep Your Dashboards Lean and Specific
Sales leaders often try to cover everything in one place. They add more metrics “just in case.” The result is a wall of charts that is hard to scan and even harder to trust.
A better dashboard shows a small number of well-chosen metrics. It is quick to read. It supports one kind of decision. It gets opened because it is useful, not because it exists.
Here is a simple structure to follow:
- Limit to 5 to 7 visualisations per dashboard
- Label clearly (for example, “Meetings booked this week” instead of “Activities”)
- Group logically (such as top-level indicators at the top, deeper drill-downs below)
- Use colour and layout sparingly, to draw attention without distraction
This is where Geckoboard’s design-first approach matters. Its dashboards are visual, minimal, and built to make scanning easier, not harder.
6. Review, Adjust, and Improve Over Time
Dashboards are not static. As your sales strategy shifts, so should the data you surface.
You might need to adjust for:
- A change in sales cycle length
- A shift to product-led or expansion revenue
- A new segmentation or account assignment model
- A move from activities to outcomes in how reps are evaluated
Review dashboards quarterly. Ask whether each metric is still helping drive the right behaviour. Remove anything that is no longer referenced. Add new indicators as needed, but only if they help answer an existing question.
Geckoboard supports this flexibility. You can adjust filters, rearrange components, and test new views without needing to rebuild from scratch.
Final Thought
Most dashboards exist to report. The best ones exist to influence.
This post focused on how to build dashboards that actually support performance. Not through complexity, but through clarity. When the right numbers are shown in the right place, they prompt better decisions, earlier interventions, and stronger conversations.
In the rest of this series, we look more closely at the metrics that are often missed, and how they can reveal early signals of performance breakdown. But none of that insight matters if the data stays hidden.
To drive performance, sales leaders need dashboards that do one job well. That is the place to start.
