
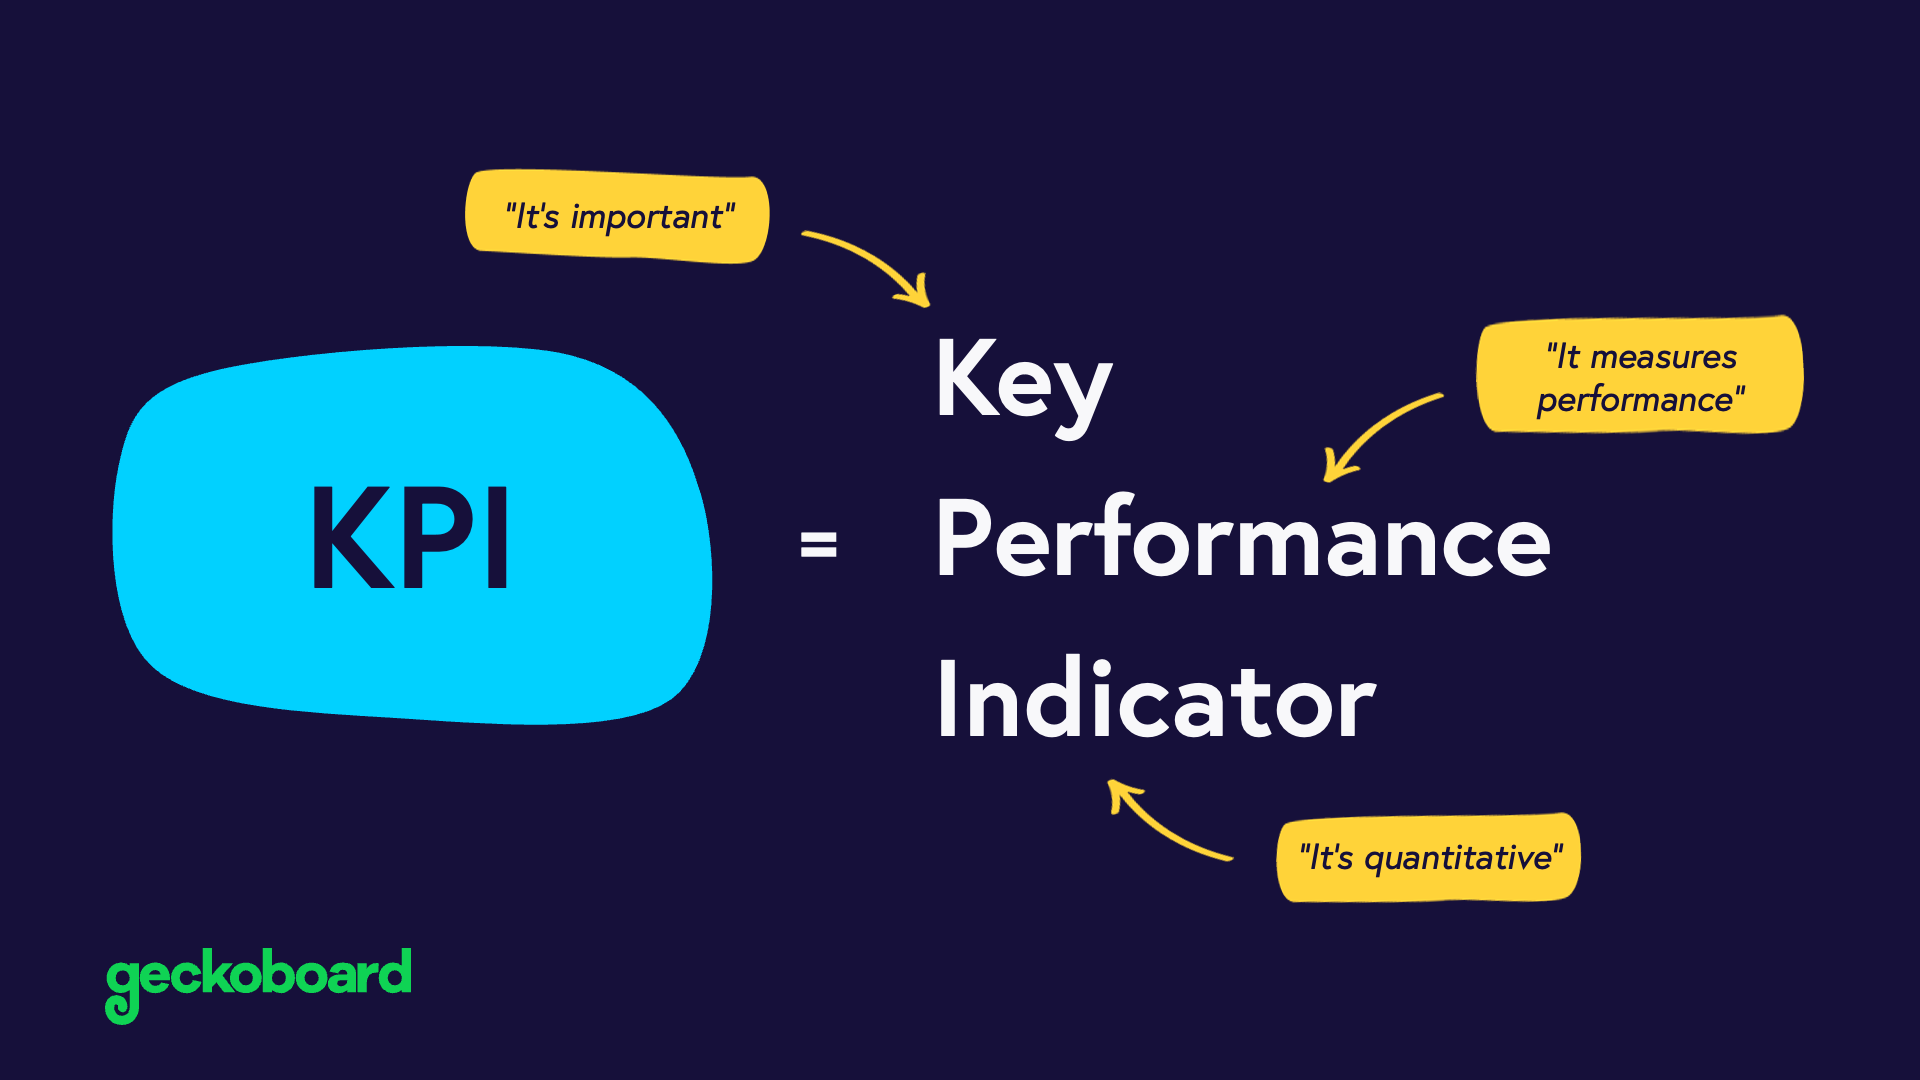
KPI meaning
A Key Performance Indicator (KPI) is a quantifiable measure of performance, which you have decided is important. They are commonly used in business as a way of tracking progress towards goals.
KPIs can be used to measure performance at different strategic levels. For example, a company might choose one set of KPIs to measure its overall business performance. But then use another set of KPIs to measure the performance of different functions in the company, such as Sales, Marketing, Finance, HR and Operations. You can also use KPIs to measure the performance of individuals, projects, campaigns, processes, tools or even machines.
What’s the difference between a KPI and a metric
A metric is a standard (or system) of measurement. Any time you measure anything, you are using a metric, whether that’s monthly revenue, sales conversion rate, number of customers, the average age of your customers, or the number of people in your team with blue eyes.
A KPI is a type of metric, but specifically a metric that can measure performance and has been deemed important.

So, the number of people in your team with blue eyes is a metric, but it doesn’t measure performance and it’s not important.
The average age of your customers might be important information, but it doesn’t measure performance, so it’s not a KPI
Whereas Sales Conversion Rate is a metric, measures performance, and is important. You could call this a KPI.
But, then, Sales Conversion Rate is unlikely to be a KPI if you work in the HR team.
As you can see, KPIs, unlike metrics, carry a degree of subjectivity. They are shaped by the context in which they are being used, and the people or companies who are using them. That’s why you may see some companies use completely different KPIs to other businesses. It doesn’t mean one is wrong and the other is right, it could just be that they work in different contexts, with different priorities.
A useful way to think about it is that metrics represent all your possible measurement options. But KPIs are the performance measures you choose to focus on in order to drive results.
As a result, during the course of your role, you may work with hundreds, if not thousands, of metrics. But if you have developed your KPIs in the right way, you should only need to use a small, manageable number of KPIs regularly for any one process.
What are some examples of KPIs?
Depending on your business, team or role, there are potentially limitless numbers of KPIs you could choose from. So choosing the right KPIs can be a daunting task.
We have created a repository of over 90 KPIs commonly used by Startups, Ecommerce, Finance, Marketing, SaaS companies, Sales, Mobile Apps, HR and Customer Support – complete with examples, definitions and use cases.
This repository has been used by well over 1 million business leaders since it was launched. Check it out.
What’s the difference between a KPI, a target, and a goal?
Occasionally you will see people use the term ‘KPI’ interchangeably with ‘goal’ or ‘target’.
It’s better to treat them as three distinct things.
- A goal is the thing you are aiming to achieve
- A KPI is a measure of performance, you have decided is important
- A target is a set number you are aiming to hit

No doubt, occasionally these three terms overlap seamlessly – especially when your goal is specific and measurable (see SMART goals later in this article). If your goal is to increase sales revenue by 20% – then perfect – your goal happens to include a KPI (sales revenue) and a target (increase by 20%).
But life is rarely so simple.
One problem with conflating these three terms is that it doesn’t allow for goals which need to be measured with more than one KPI. Or where no one single KPI or target perfectly represents your goal. Or where the goal is intangible.
In these situations, instead of using a direct measure, you would use several indirect measures (sometimes referred to as ‘proxy measures’).
For example, say your goal was to improve employee satisfaction (a slightly intangible goal), you would likely need to use several indirect measures, such as the results from an employee engagement survey and the average turnover rate. You could structure your goal, KPIs and targets like this:
Goal: Improve employee satisfaction
- KPI: Employees say they are satisfied in their role. Target: 90%
- KPI: Employees say they see a long-term future here. Target: 80%
- KPI: Avg. Turnover rate. Target: <5%
Developing good KPIs takes time, and developing good targets takes even longer (smart leaders don’t just pluck targets out of thin air). Whereas goals are comparatively intuitive, because they are about describing the things you want to happen.
By considering these three terms separately, we aren’t forced into deciding them all at the same time. We can start off with a goal, then use KPIs and targets to pin down how we are going to define success and measure our progress towards that goal.
Later in the article, we explore SMART goals and a five-step process you can use to develop your KPIS.
What’s the difference between a goal, mission, vision, objective, result and aim?
At a fundamental level, mission, vision, objective, result and aim all mean the same thing. They’re just synonyms for the word goal – ‘the thing we’re aiming to achieve’. In no less the same way that ‘boiling’, ‘sweltering’ and 'scorching’ are all just synonyms for the word ‘hot’.
However, when we use them in context, they do take on differences. Our vision might be longer term than our mission, or our strategic objective might be more important than our tactical aim. Creating these linguistic systems of hierarchy is important, especially when devising a system of goals and KPIs for something complex like a business.
The words themselves are not important, it’s the hierarchy that’s important. Because the hierarchy helps people understand how their own goals relate to their team goals, and how their team goals relate to company goals. The size and shape of your hierarchy will, no doubt, be influenced by the size and shape of your company. But whatever KPI framework you choose, it should be meaningful to you, and meaningful to the people you work with.
(Also, don’t get caught out by the many commentators and consultants who have tried to conflate all of these synonyms into a grand unifying theory of goal-setting. Especially because each has done it in a slightly different way. The result is a host of preposterous pyramids which don’t mean anything to anyone. If you don’t know what I’m talking about, google strategy pyramid)
What are the different KPI frameworks and approaches?
In no particular order, here are some common KPI frameworks used by different businesses. You’ll see straight away there is a lot of overlap. That’s because, on some level, they are all trying to provide answers to the same questions.
It’s possible to use more than one of these frameworks, but this does risk confusion if you are not clear on exactly how they relate to each other. The main thing to keep in mind is that your KPI framework should be meaningful to people who are using it.
Management by Objectives (MBO)
Management by Objective (MBO), a framework proposed by Peter Drucker in 1954, is such a prevalent concept in business today that many people don’t even recognize it by its formal name.
MBO is the process of setting organizational goals, which are then translated into individual goals through a system of management. The process aims to focus people and teams on the activities that contribute to the success of the whole.
MBO proposes that people should invest time understanding the purpose of their own role, and how it relates to their role of their manager and the wider business. The employee is then responsible for devising their own objectives and the KPIs they will use to measure performance (though these do need to be approved by their manager).
MBO normally contains a process of performance review linked to financial reward (such as bonuses or salary increases).
Proponents of MBO say that it allows organizations to break company-wide goals into smaller actionable objectives, creates clear expectations (and accountability) for managers and employees alike, is meritocratic, and generally motivates good performance.
However, some have argued that it can overestimate the effectiveness of goal-setting in driving results. MBO also usually takes place over an annual cycle, which is sometimes seen as ineffective for high-growth or faster-moving companies.
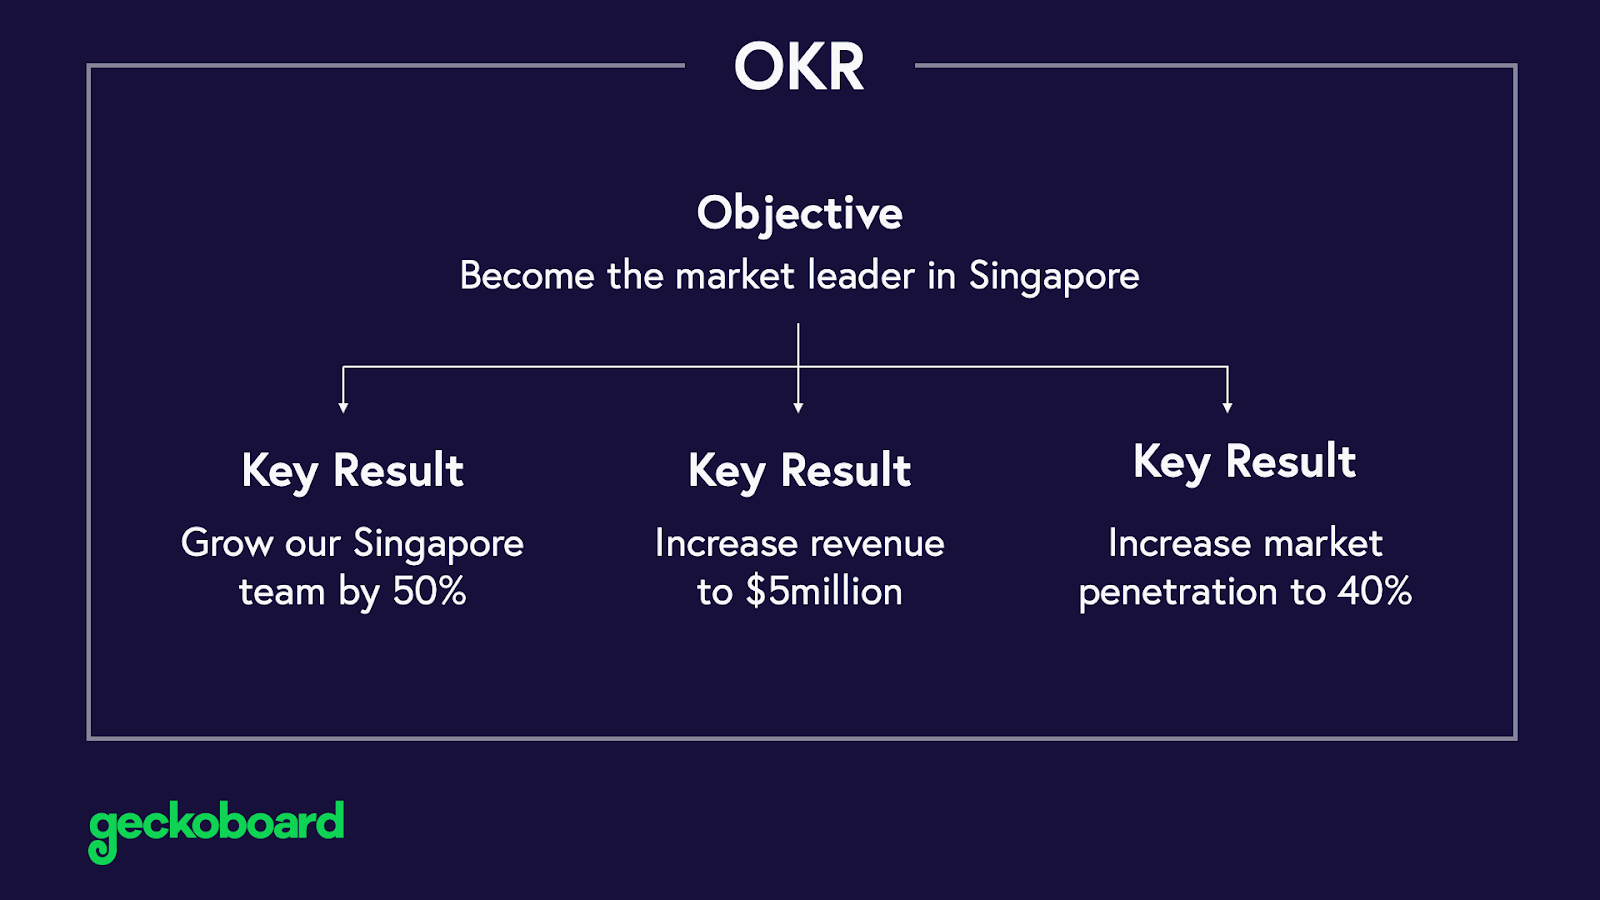
Objectives and Key Results
Objectives and Key Results (OKRs) is a framework that involves setting one concrete but ambitious Objective, which is supported by 3-5 Key Results. The Key Results indicate how you are going to achieve your Objective, and contain KPIs. You should be able to score your Key Results on a scale of 1-10 (where 10 is highly ambitious).
A person can set themselves multiple OKRs, and indeed, OKRs can be set at every level of the organization. Like with MBO, OKRs encourage you to make sure that smaller objectives are designed to support the wider objectives of the organization.
A feature of OKRs is that they should be very ambitious, and you should not expect that they will ever be 100% achieved. In order to support this highly ambitious approach, financial reward should be decoupled from OKRs.
OKRs were developed by Andrew Grove during his time at Intel during the late 70s and early 80s. Though they have since been popularized by companies like Google and Twitter. OKRs have many points in common with MBO (in fact, OKRs were originally called Intel Management by Objectives – or iMBO.)
One Metric that Matters (OMTM)
OMTM (sometimes referred to as a North Star Metric) is a KPI framework where a team or company chooses only one KPI to improve over a set period of time. For example, a marketing team focuses on improving its Cost per Acquisition, or a sales team focuses only on improving its Average Order Value. Over the space of weeks or months, the entire team works together to improve that KPI. And in the process of improving that KPI, you uncover the next OMTM to focus on.
The argument for this approach is that focused attention and iteration within teams can create exponentially more value (and therefore progress). Especially when compared to the MBO approach, which is to split many priorities between different people over longer periods of time. The argument is that a multifaceted approach like MBO results in stasis, because no one area of activity is ever substantial enough to move the dial.
OMTM It’s a particularly popular framework within the startup world, in part, because it’s closely aligned with an agile (or agile-style) approach to work. i.e. to focus your attention over short bursts, iterate, continuously ship value and keep up momentum.
Critics have pointed out that OMTM is unhelpful because it takes complex ecosystems and oversimplifies them. It can also be very difficult to work out the one metric you should be focusing on, which is likely to be unique to your business.
OMTM also carries several risks – you might choose the wrong metric, take your eye off other important KPIs; or underestimate KPIs with a longer tail (e.g. Brand Awareness). By the time you even realize you have a problem, it’s potentially already too late.
When I think about OMTM, I often think about Billy Beane (played by Brad Pitt) and this scene in the film Moneyball. He builds a baseball team by focusing on improving one single KPI – ‘On-base percentage’. This is in stark contrast to his own scouts (and indeed the rest of Major League Baseball) who are left arguing over hundreds of different, conflicting performance measures. By identifying and focusing on the OMTM, Beane creates a competitive edge and a winning team.
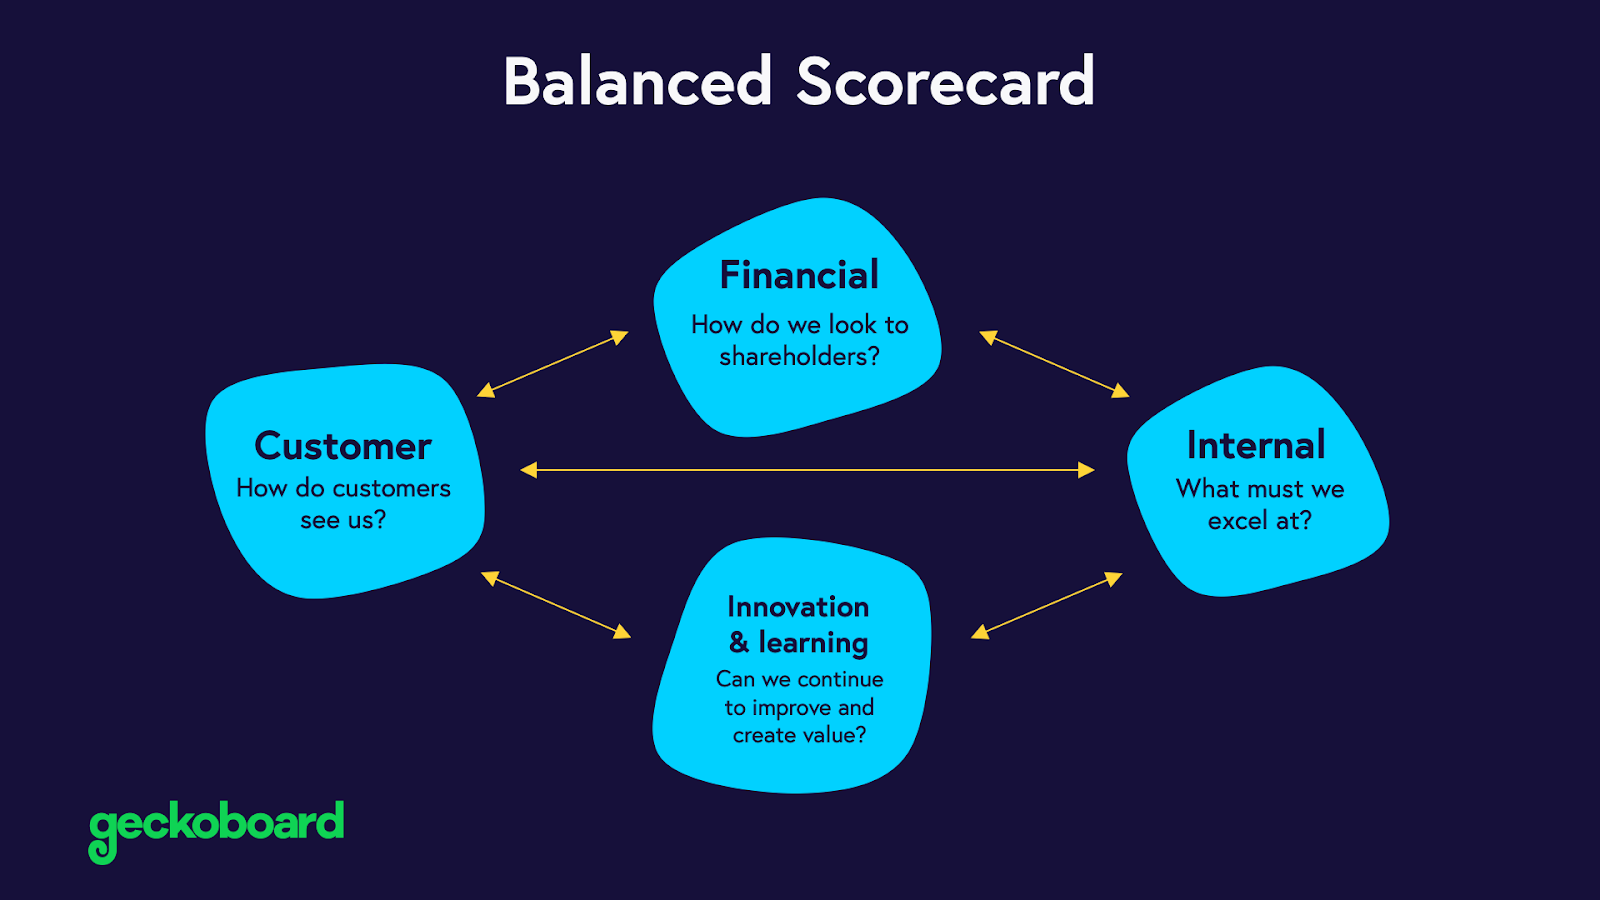
Balanced scorecard
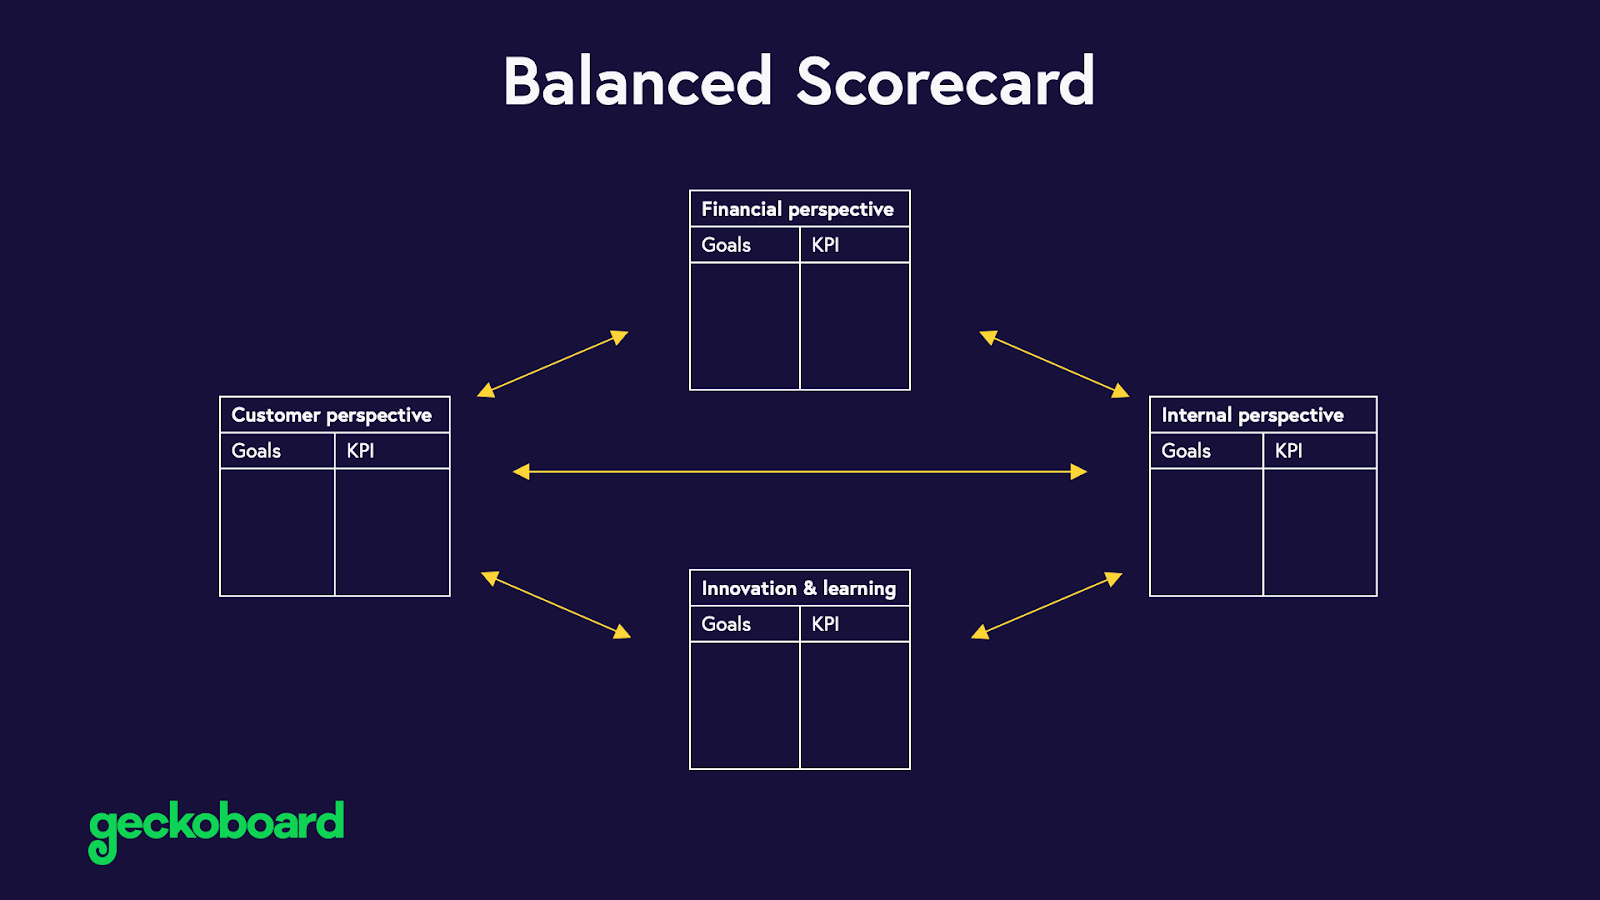
Balanced Scorecard is a framework you can use to assess performance from four different perspectives, then develop goals and KPIs for each area. It is generally used by companies at more of a strategic level.
The first generation of the Balanced Scorecard was published by Robert S. Kaplan and David P. Norton in 1992, and addressed performance according to four different, but complimentary, perspectives:
- How do customers see us? (customer perspective)
- What must we excel at? (internal perspective)
- Can we continue to improve and create value? (innovation and learning perspective)
- How do we look to shareholders? (financial perspective)
There have since been other versions of the Balanced Scorecard published using different perspectives.
Leaders use the Balanced Scorecard to assess their business strengths and uncover areas for improvement. They then devise goals and KPIs within each area.
The benefit of using a Balanced Scorecard is that it encourages you to address your performance holistically, particularly by looking at your business from different perspectives. Some find this to be especially useful when combining financial and non-financial KPIs. Unlike OKRs or OMTM, the Balanced Scorecard is unlikely to produce a single focal point for teams to rally around, and so there is always a risk that projects lose momentum, or priorities become confused.
Finding the right balance for your team or business
Although they have many things in common, the above KPI frameworks differ in some important areas:
Focus vs breadth
Some frameworks such as OMTM demand complete focus on a single area of performance. Whereas some, such as Balanced Scorecards, are designed to maintain a more holistic view of performance.
In deciding which to use, you need to think about what type of organization you are. Can you afford to focus on only one thing? Can you afford to lose momentum?
Collective responsibility vs individual accountability
Some KPI systems like MBO are very deliberately designed to keep accountability for performance with the individual. Whereas others, like OMTM, are designed to promote collaboration and collective responsibility.
We should emphasize that all these frameworks stress the importance of not developing top-down goals and KPIs, which encourages people to ‘game the system’ (this is known as the Cobra Effect).
Related to this is the question of financial reward. Many companies are moving away from directly linking their KPI frameworks with financial rewards. Because this practice often muddies the waters, results in more conservative goal setting, and similarly encourages the Cobra Effect.
How do you set KPIs?
In this section, we'll cover how you can develop KPIs for your company, your team or with your direct reports. Remember, it's not advisable to set top-down goals and KPIs as a direct means of control. If you are setting goals with your direct reports, they should be encouraged to take the initiative; you should aim to develop KPIs with them, not for them.
1. Start with the goal
Goal setting is about figuring out what you want to achieve and why you want to achieve it.
Remember that goal-setting nearly always takes place within some wider hierarchy of goals. If you’re setting goals at an individual or team level, you should spend time understanding how that does and doesn’t support the overall company strategy. If you’re setting strategic company goals, you should be able to articulate how that supports the company mission or vision.
You should remember that poor, non-specific goal setting at strategic levels makes it more difficult for your colleagues to set good tactical goals. We’d recommend Simon Sinek’s ‘Start with Why’ – in fact, we’d say it’s required reading for any business leader.
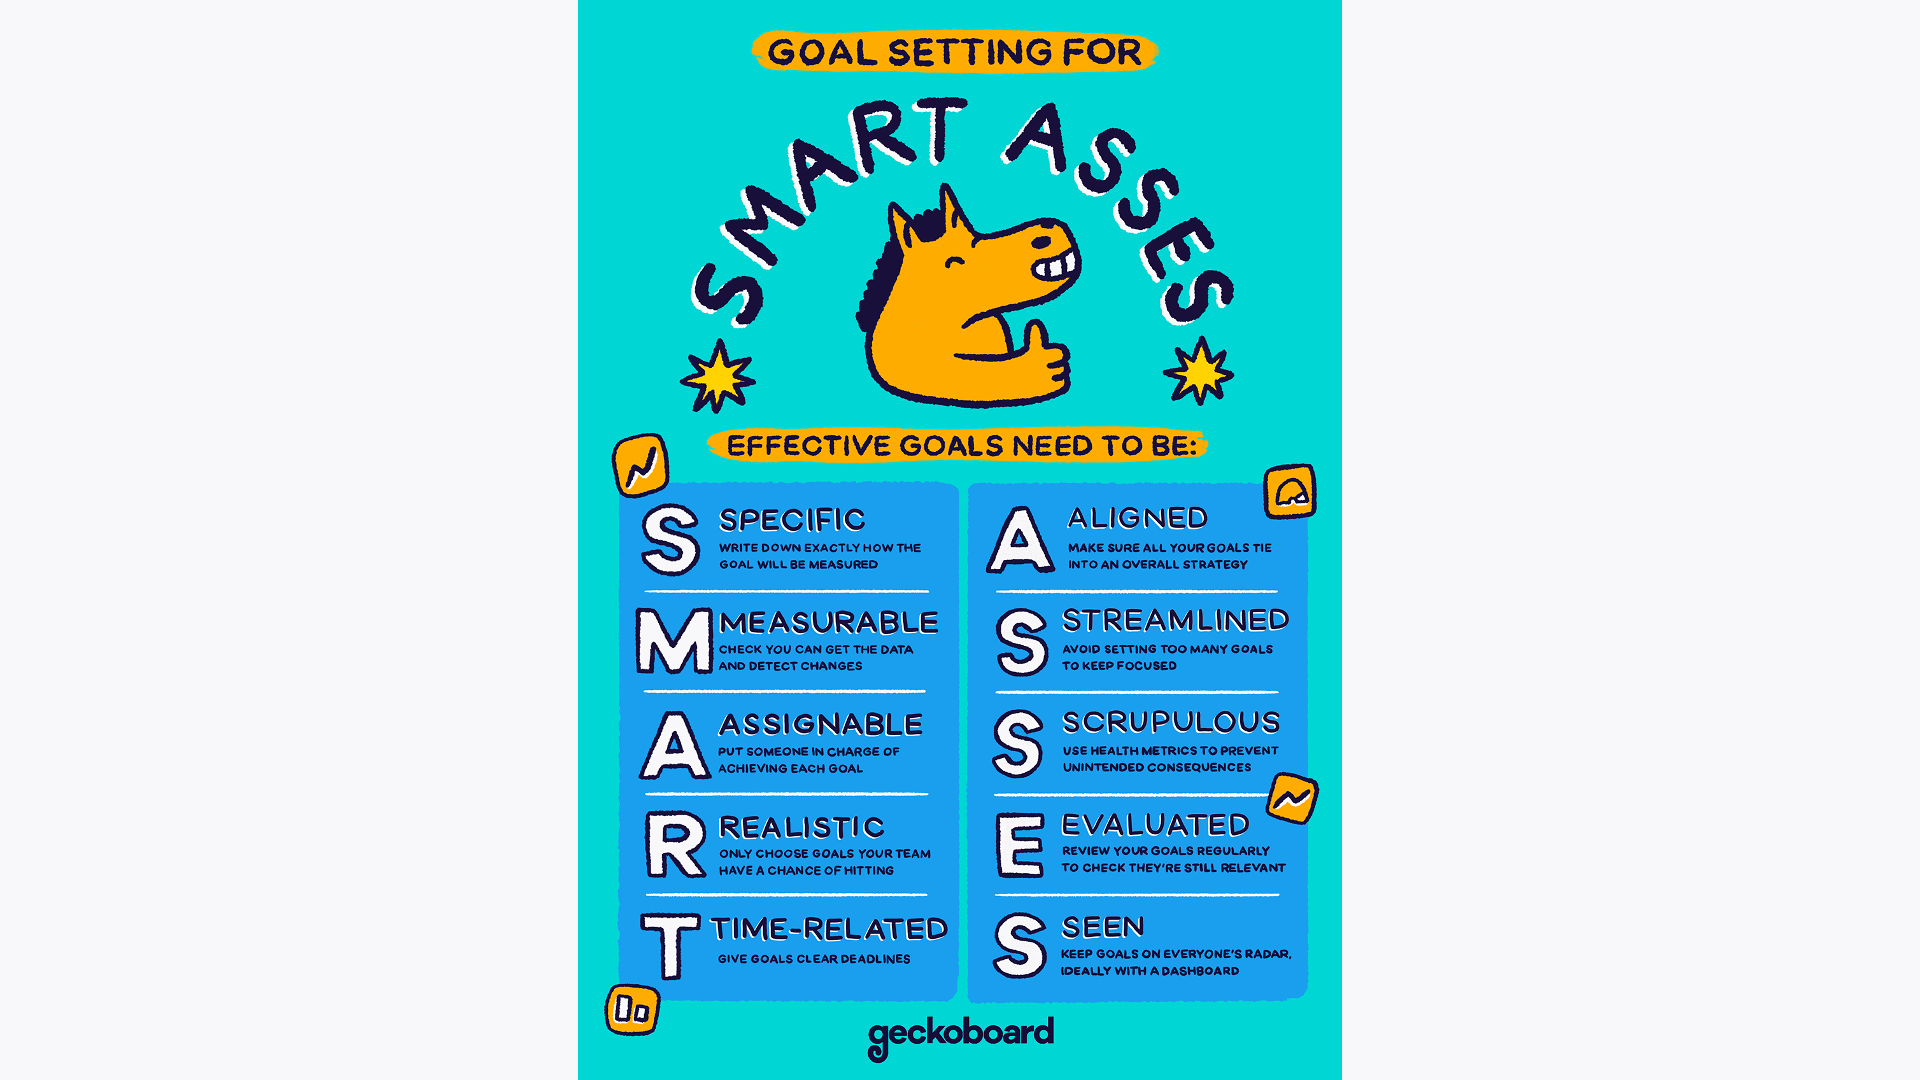
2. SMART goals
A popular technique for strengthening your goals is the SMART Goals framework. SMART goals were developed by George T. Doran in 1981, they are goals which are:
- Specific
- Measurable – (here is where you would use KPIs)
- Assignable*
- Realistic*
- Time-related (or time bound)
*In subsequent versions, others have chosen to replace Assignable with Achievable/Attainable and Realistic with Relevant.
SMART goals are a tried and tested way to pin down goals so they are actionable. However, in our experience, there are some crucial areas that SMART doesn’t cover. We recommend you check out our SMART ASSES framework.
3. Decide performance measures (KPIs)
Be intentional when you choose your KPIs. A small number of meaningful KPIs is far better than a whole host of metrics no-one cares about or can understand.
Start by considering direct measurements. If you want to improve revenue then Total Revenue per Month would be an example of a direct measurement. But some things can’t be measured directly. For example, if you wanted to measure something more intangible like customer satisfaction, you could use indirect measures such as a CSAT survey, Average Return rate, or Repurchase Rate.
If you are using indirect KPIs, it’s safer to use more than one. You should also be careful that you don’t use bad proxy measures (more on that later).
4. Get buy-in for your KPIs from the start
We’ve all been there. You’re half-way through a project, then out of nowhere, someone starts to question the KPIs we are using to measure progress.
“Are these really the true measures of effectiveness?”
Suddenly, you’ve lost momentum, not to mention months of good work, because you’re effectively having to start the goal-setting process again.
KPIs don’t have to be perfect. But they do need to command the confidence of everyone who will be using them. Creating buy-in for your KPIs is time you need to invest at the start, but it’s time well spent.
If you are a team leader, don’t just delegate this responsibility, you need to be invested in the KPIs you’re setting for the team. But equally, don’t set KPIs without giving your team the opportunity to feed into them. KPIs which everyone finds meaningful are a source of intrinsic motivation. But if your team doesn't buy into your KPIs, they will only ever be a form of extrinsic motivation at best – or ignored, at worst.
Blog: Why is intrinsic motivation better than extrinsic motivation?
5. Keep you KPIs visible and regularly review your progress
Sadly, many people go through the long, arduous process of developing KPIs but then don’t look at them until the end of the year or until the project is over. By tracking KPIs and keeping them visible, in the form of a live KPI dashboard, you can continually spark action and focus the attention of your team.
You should also set up regular points where you can review your progress. This creates the opportunity to reflect on what has worked and what you could try differently.
How do you set non-financial KPIs?
For some people, developing non-financial KPIs, such as those you might use in HR, Support or even Marketing functions, can feel less certain. But really, it’s not true to say these KPIs are wholly non-financial, it’s just that they measure the performance of things that contribute to financial performance indirectly, or financial performance in the long term.
Customer Satisfaction (CSAT), for example, is a leading indicator of repeat purchase. Brand Awareness and Brand Salience are inherently linked with future market share and long term growth.
So really, developing non-financial KPIs is no different to developing financial KPIs. Use KPI frameworks to understand and articulate how your non-financial goals and their KPIs contribute to the strategic goals of the company.
What’s the difference between leading and lagging indicators?
A lagging indicator measures past performance. Whereas a leading indicator is a predictive measure of future performance.
To take a short-term example, if you were measuring your cash flow, Payments Received would be an example of a lagging indicator – it measures what has already happened. Whereas Invoices Issued would be an example of a leading indicator because it measures the cash you are likely to receive in the near future. It’s only predictive, because it’s not guaranteed that everyone will pay, or pay on time.
A longer term example of leading and lagging indicators (from the Marketing world) would be Share of Market and Share of Voice. Share of Market (SOM) measures the percentage of revenue you are responsible for within the whole market, compared to your competitors. It’s a lagging indicator. Whereas Share of Voice (SOV) measures the percentage of your brand’s media spend within the market, compared to your competitors. An excess Share of Voice (eSOV) compared to your SOM is predictive of an increased SOM in the future. It’s a leading indicator.
However, you should bear in mind that leading and lagging indicators are generally subjective. They depend on your point of view. If you work in demand generation, then you may consider Number of Leads to be a lagging indicator – it’s your primary measure of performance. But if you work in sales, then you would certainly consider Number of Leads to be a leading indicator.
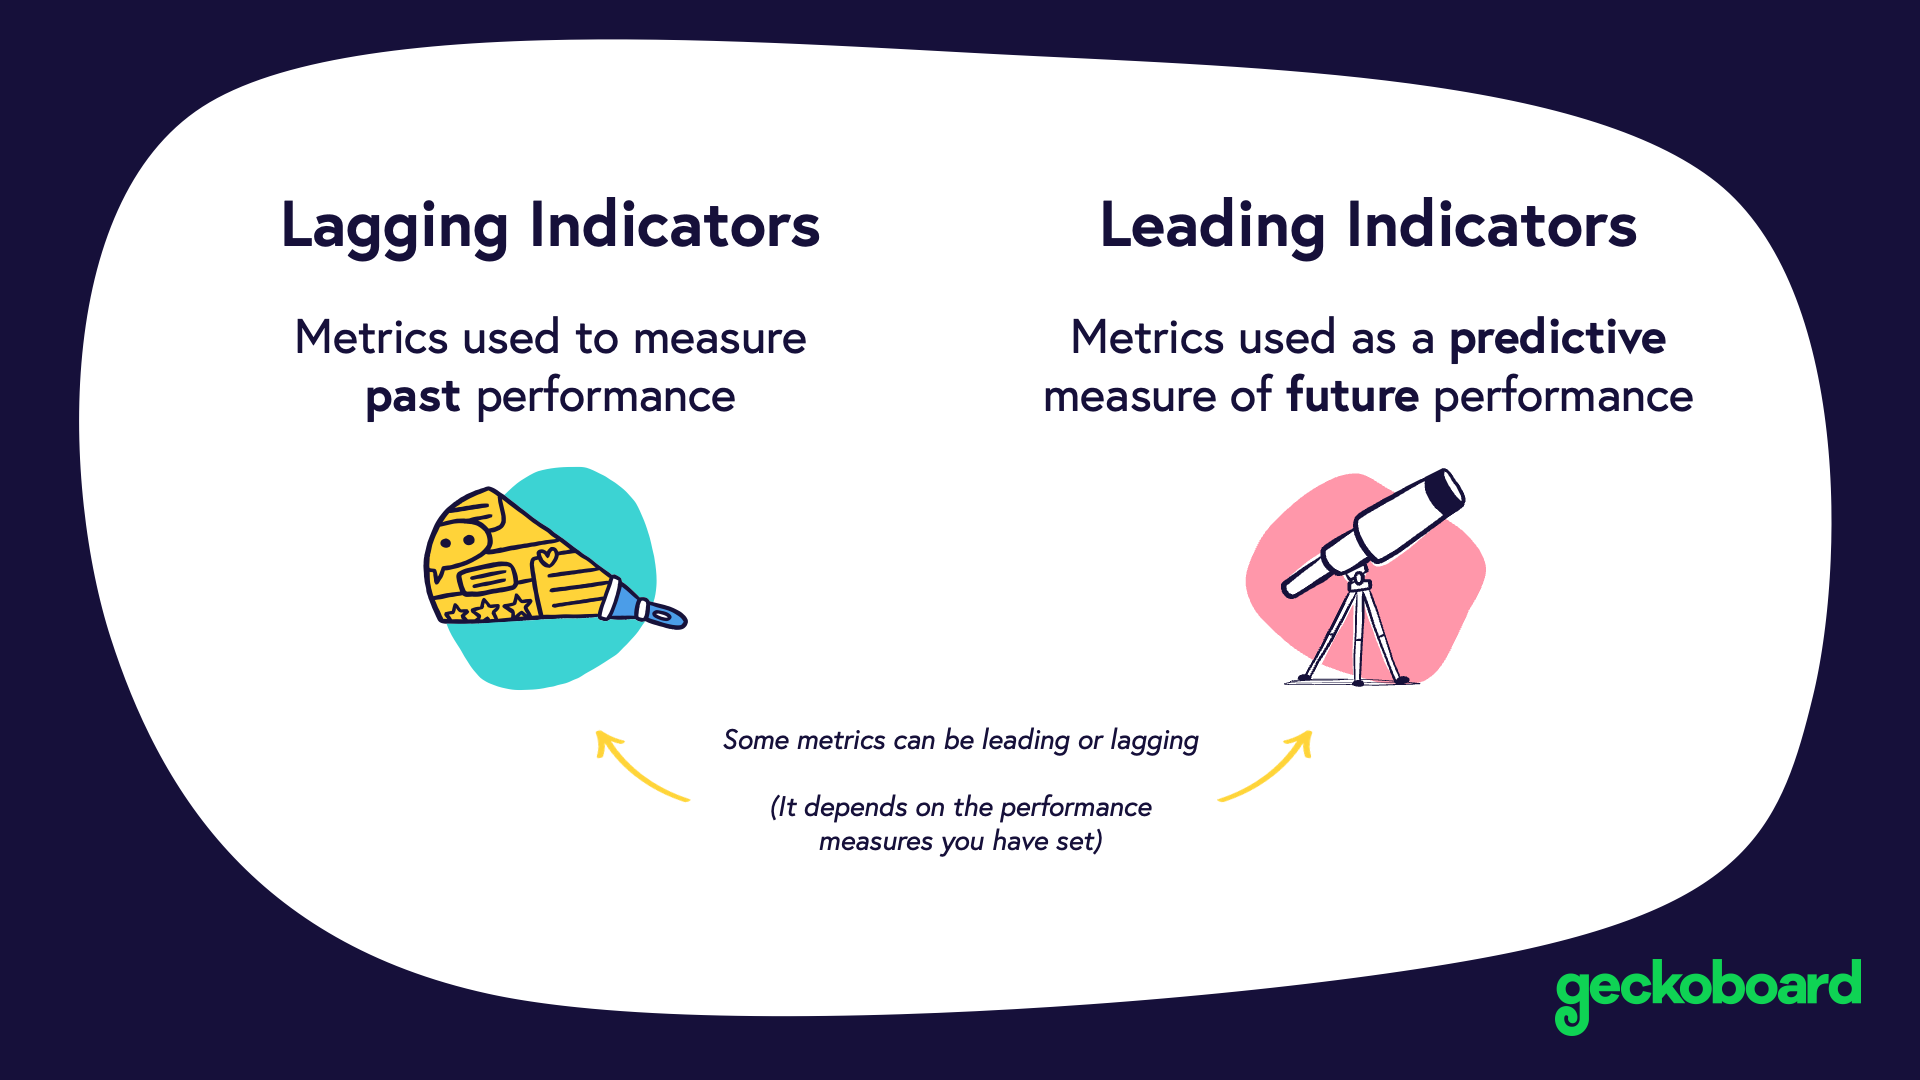
In practice, we are generally most interested in lagging indicators. But if those lagging indicators take a long time to materialize (such as Revenue per Quarter) then it’s a good idea to track leading indicators as well, in order to make better day-to-day decisions.
Don’t make these common KPI mistakes
Here are some common mistakes to avoid when developing or using KPIs.
Using bad proxy measures
Sometimes we can’t measure the thing we want to measure, so we measure a KPI we think is related – we call this a proxy measure. This is often the case when we want to track a lagging indicator, but this isn’t possible, so we use a leading indicator instead.
We should be careful with proxy measures because many are, in fact, bad proxy measures. An increase in new leads doesn’t always result in an increase in new sales. An increase in social media followers doesn’t always result in an increase in positive brand sentiment. A decrease in average resolution time for customer calls doesn’t always mean an increase in customer satisfaction. We therefore need to use proxies intelligently.
Measuring actions not results
KPIs should be used to measure performance, not activity. Often you will see people write their KPIs like this:
- Complete 10 sales calls per day.
- Post 5 updates to our Facebook page
These are not KPIs, because there is no way to discern (or measure) performance. Sometimes we refer to these types of targets as quotas.
Instead, it might be better to write
- Generate $500 of revenue through sales calls today
- Post content to Facebook which records at least 5,000 impressions
If it is genuinely not possible to measure performance with a KPI (for example, because the only good measure of performance is an unknown lagging indicator) then quotas may be the only thing you are able to track. But this does mean you will need to continually check that these activities are contributing to good performance, through some kind of qualitative review.
Invisible KPIs
What’s the worst type of KPI? It’s the one that nobody looks at.
KPIs should inspire action. Arguably, the visibility you create for a KPI is just as important as the KPI itself. A KPI should be as visible as possible, for as much time as possible. Ideally, they should be displayed on a KPI dashboard on your office wall. Or if you work remotely, they should be automatically, and regularly, shared between your team.
You should also consider that a KPI is a form of communication. By setting a KPI you are indicating what is important (and what is less important). Good awareness of KPIs can help teams focus, prioritize better, and create opportunities for spontaneous new ideas.
Forgetting to review
You should create regular opportunities to review your KPIs. This is about appraising whether your current approach is creating the progress you would expect.
Again, KPIs should inspire action. If you only review your KPIs at the beginning and the end of a project, then you have lost several opportunities for review, where you could have honed or changed your approach.
Weasel words
Weasel words are words that suck the life out of the words around them. Like ‘effective’, ‘optimize’, ‘capacity’, ‘streamline’ or ‘best practice’. In general, they’re annoying, but in goal-setting they are downright dangerous.
Weasel words may make goals sound grand or more important, but they aren’t measurable. Avoid weasel words in goal setting, and question them when others try to use them. (We’d recommend Stacey Barr’s blog on how to respond to goal-setters who use weasel words.) Instead, use the SMART ASSES framework to create goals that can be measured, and use KPIs to measure them.
Originally published on 14 October 2019, updated on 11 November 2021
