A SQL dashboard is a powerful tool that allows you to visualize data stored in a database such as MySQL, PostgreSQL or Snowflake. These dashboard tools require you to use SQL (Structured Query Language) to select the specific data (in a database) you wish to visualize.
SQL dashboards enable you to visualize your data in different ways, and are often used to give a wider audience access to key information stored in the database – particularly people who do not have the time, technical skills or opportunity to access the database.
Watch: How to create a SQL dashboard in minutes
What are the different types of SQL dashboard?
There are many different types of SQL dashboard tools available, depending on your requirements. However, most SQL dashboards can be grouped into two categories which fulfill two distinct business needs:
- Analysis – for people who need to investigate and analyze data
- Communication - for people who need to communicate live data and KPIs to a wider audience
Business Intelligence, BI tools and analysis
When it comes to using SQL dashboards to analyze data, people generally think about Business Intelligence tools (BI tools) like PowerBI or Tableau. These can be enormously helpful if you regularly need to run queries or investigate trends within your data.
With a BI platform like Tableau, you can use SQL to access specific datasets within your database, then use the dashboard to perform analysis of the data. Here, data visualizations help the user to spot trends and relationships between different datasets.
You could also use popular database analysis tools like Redash to perform this task.
Beware however, if you are using any SQL dashboard for the purposes of analyzing your database, you will need to be confident writing SQL on a regular basis
KPI dashboards and communication
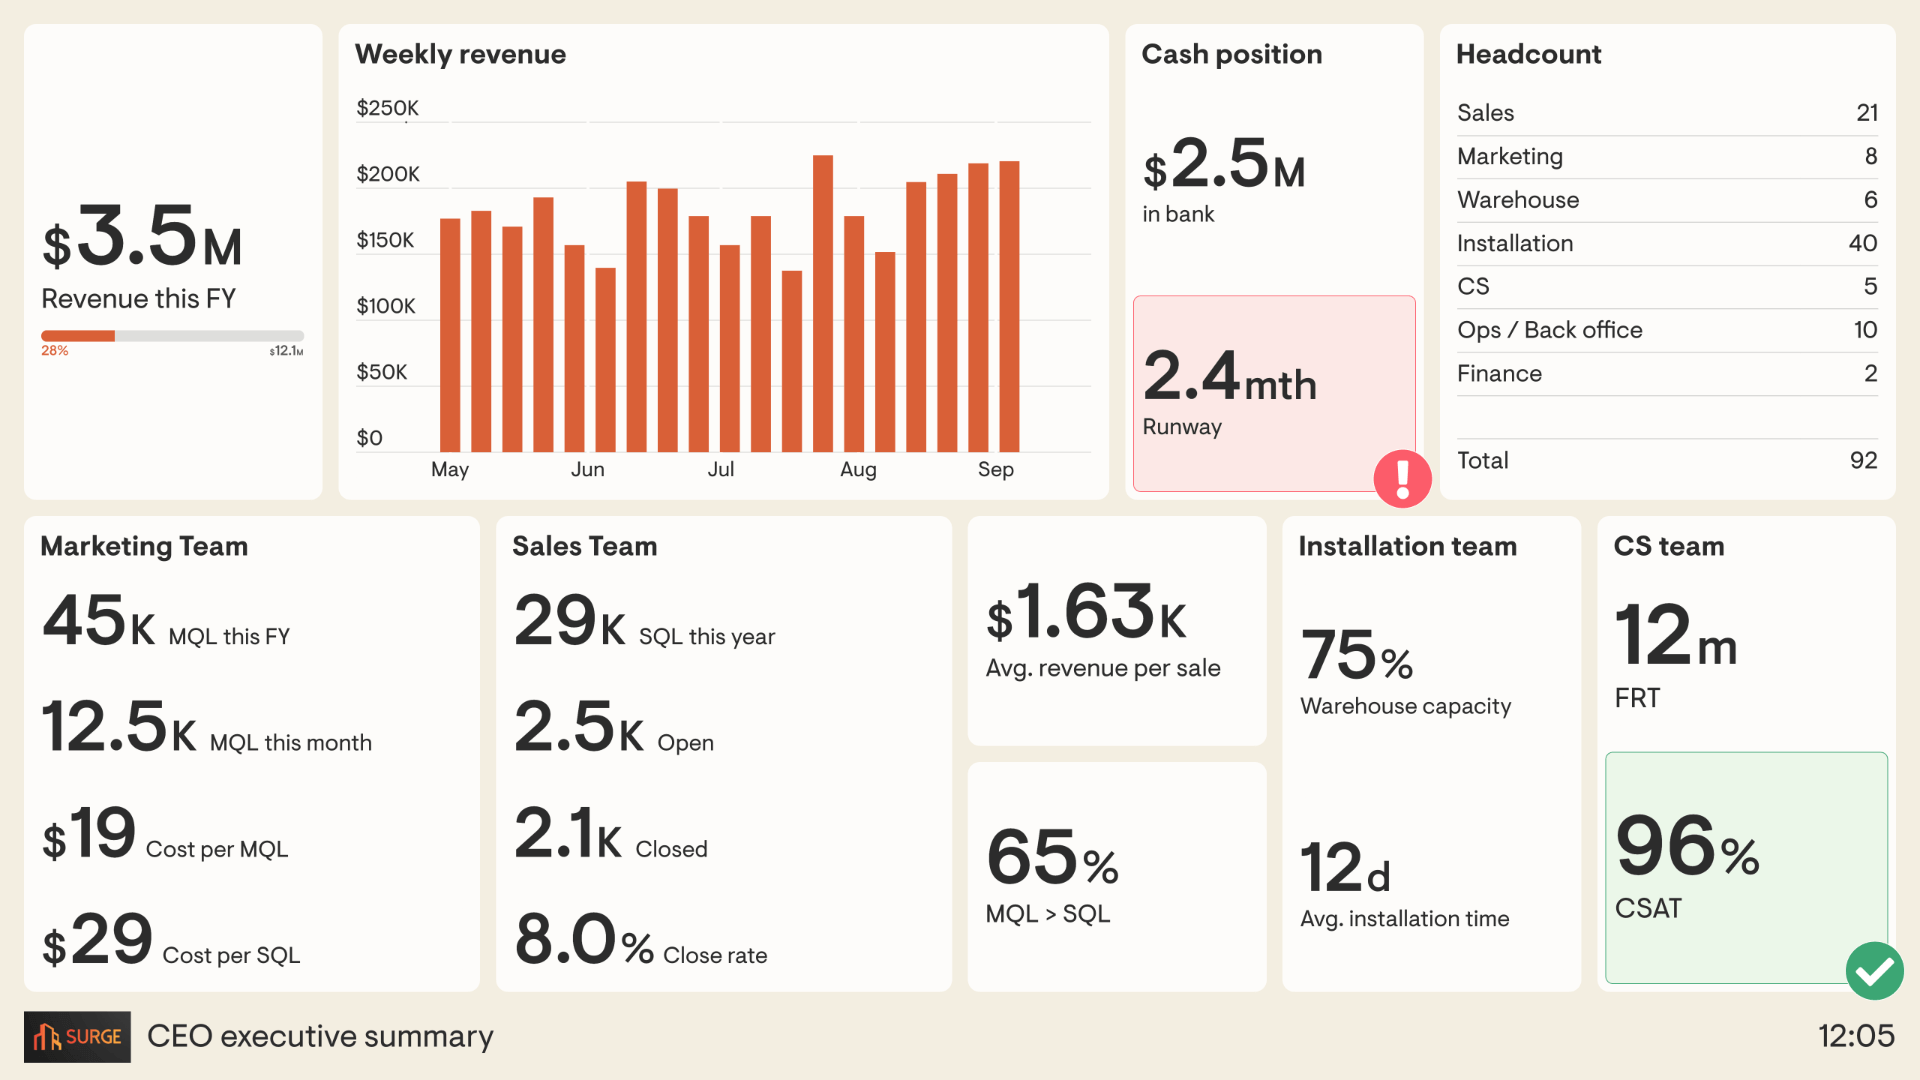
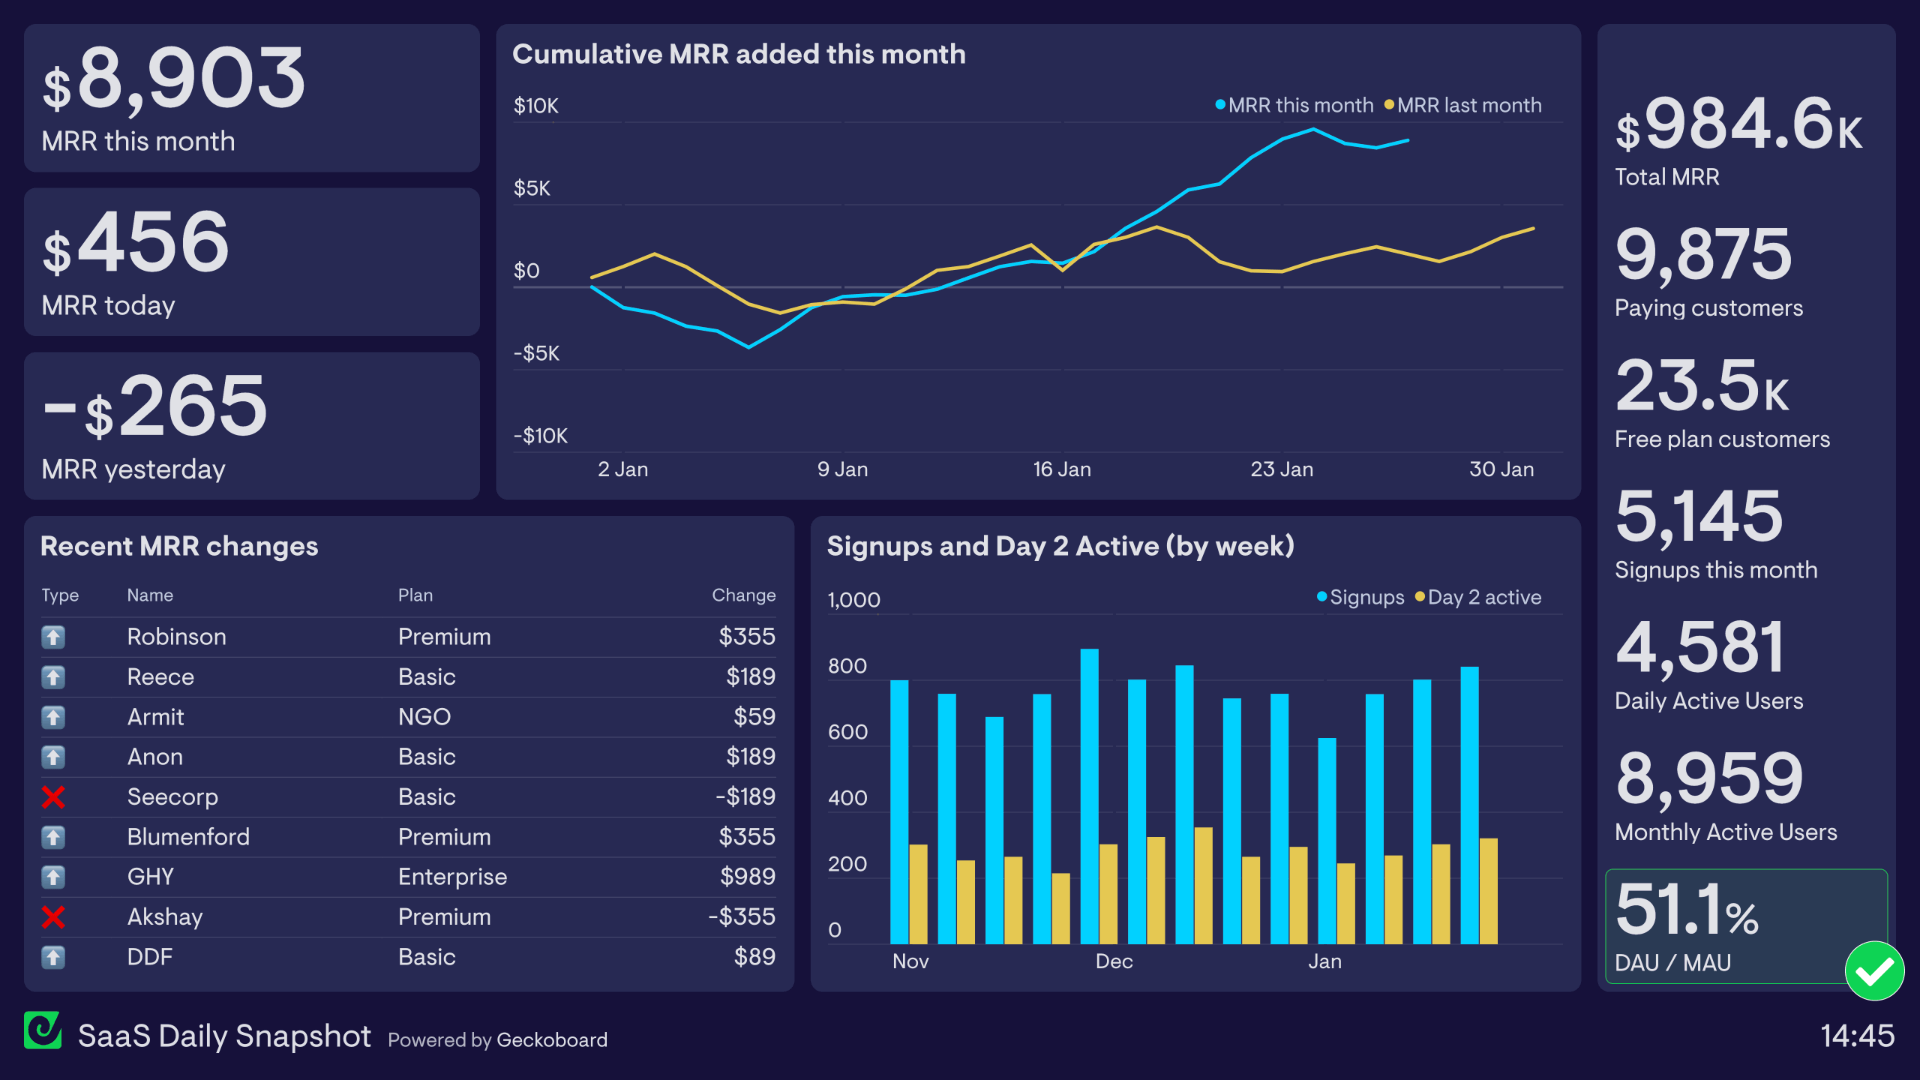
If your intention is to communicate data to a wider audience, then the best tool for the job is a KPI dashboard tool, which can integrate with SQL databases, like Geckoboard.
Here, it’s less important that the tool allows for exploration and analysis, and more important that the tool is optimized for visual consumption. You may need to think about:
- How visually impactful the dashboard is - does it communicate data in a way that is meaningful and understandable?
- How effectively does it highlight changes in the data?
- Is it optimized for your preferred method of sharing – for example TV display, sharing online or scheduled updates.
Which type of SQL dashboard should I choose?
If you work alone, or need to investigate lots of data, it’s likely you will need a BI tool or other analysis tool that is capable of slicing and dicing your data in many different ways.
If you don’t need to perform much data analysis, but do need to motivate your team with KPIs, it’s possible you will need a KPI dashboard tool, but not a BI tool.
However, it’s also possible you will need both.
The problem is, it can be hard to find an affordable tool that performs both functions equally well. Often it’s cheaper and more efficient to use different tools for different jobs.
For example, many CTOs might use PowerBI to perform analysis and also use Geckoboard to communicate company-wide KPIs and North Star Metrics.
Can I use a SQL dashboard, even if I don’t know how to write SQL?
It sounds like a dumb question, but honestly, the real answer is – it depends.
If you need to use SQL dashboards to perform regular analysis of data in your database, then yes – there’s no getting around it – you are going to need to learn SQL. It will be a crucial part of your workflow. We highly recommend Adam Finer’s YouTube channel as a great place to start.
However, if you just need to set up a consistent KPI dashboard for your database, then depending on the tool you use, the amount of SQL coding required is really not very much. You could find someone who does know SQL to help you set up the dashboard. (With Geckoboard, this task could be completed in less than an hour.)
From then on, you would be able to gain the value from the dashboard (improved awareness and understanding of your data) without ever needing to touch the code.
What’s the best way to combine SQL databases with other data sources?
Once again, the answer to this depends on whether you want to analyze data from multiple data sources, or communicate data from multiple data sources.
Analyzing data
If you wish to analyse data from your database, along with metrics from other sources (let’s say Google Analytics and Salesforce), then best practice dictates that you need to bring all that data together into one place – a data lake or data warehouse, for example.
This can be a complex and challenging process, requiring data connectors like Supermetrics. However once you have brought all the data into one place you can use a BI tool to perform investigation and analysis, as you would with any other database.
Communicating KPIs
However, if you wish to create a dashboard that simply communicates KPIs from multiple data sources, including a SQL database, then there is a much simpler way of doing this.
With a dashboard tool like Geckoboard, you can use SQL to create visualizations using metrics in your database, and display them side by side with visualizations that pull metrics directly from over 80 different data sources including Google Analytics, Salesforce, and Spreadsheets.