Written by Zendesk Consultant, Jude Kriwald.
Go beyond Zendesk Talk’s default reporting with five custom metrics (and one essential attribute) that reveal what’s really happening on your voice channel.
Zendesk Voice (previously Talk) comes with a range of built-in reports, but most teams quickly find they need more flexibility as they try to drill into what’s really going on. The default metrics are often too broad to give real insight into what is happening in any meaningful way that can be actioned. To make smarter staffing decisions, identify problems earlier, and manage agent performance fairly, you need custom reporting.
Here are five of the most useful custom metrics (well, one is a “guest of honour” attribute) from the Geckoboard custom metrics and attributes library. Together, they give you a clearer, fairer, and more actionable picture of your voice channel.
Why custom Talk metrics matter
- Default Talk metrics hide the “why” behind customer calls.
- Inconsistent reporting across phone lines makes trend analysis difficult.
- Agents can be unfairly penalised when abandonment metrics include calls they never had a chance to answer.
- Without custom metrics, you miss early warning signs that staffing, IVR design, or wait times need attention.
Phone Line Name (Attribute)
We start with an attribute, not a metric, but it deserves a place on this list because of how useful it is—and it can be paired with any of the metrics that follow it. By default, Zendesk Analytics (formerly Explore) shows phone lines as raw numbers with international dialling codes. That makes reports hard to scan.
The Phone Line Name attribute replaces those numbers with readable labels, such as “Customer Support” or “VIP Line”. This makes charts instantly easier to understand, especially when you are comparing volumes across multiple lines.
Copy
IF([Call Talk number] = "+448001234123")
THEN "Customer Line"
ELIF([Call Talk number] = "+44205678567")
THEN "Client Line"
ELSE "Other"
ENDIF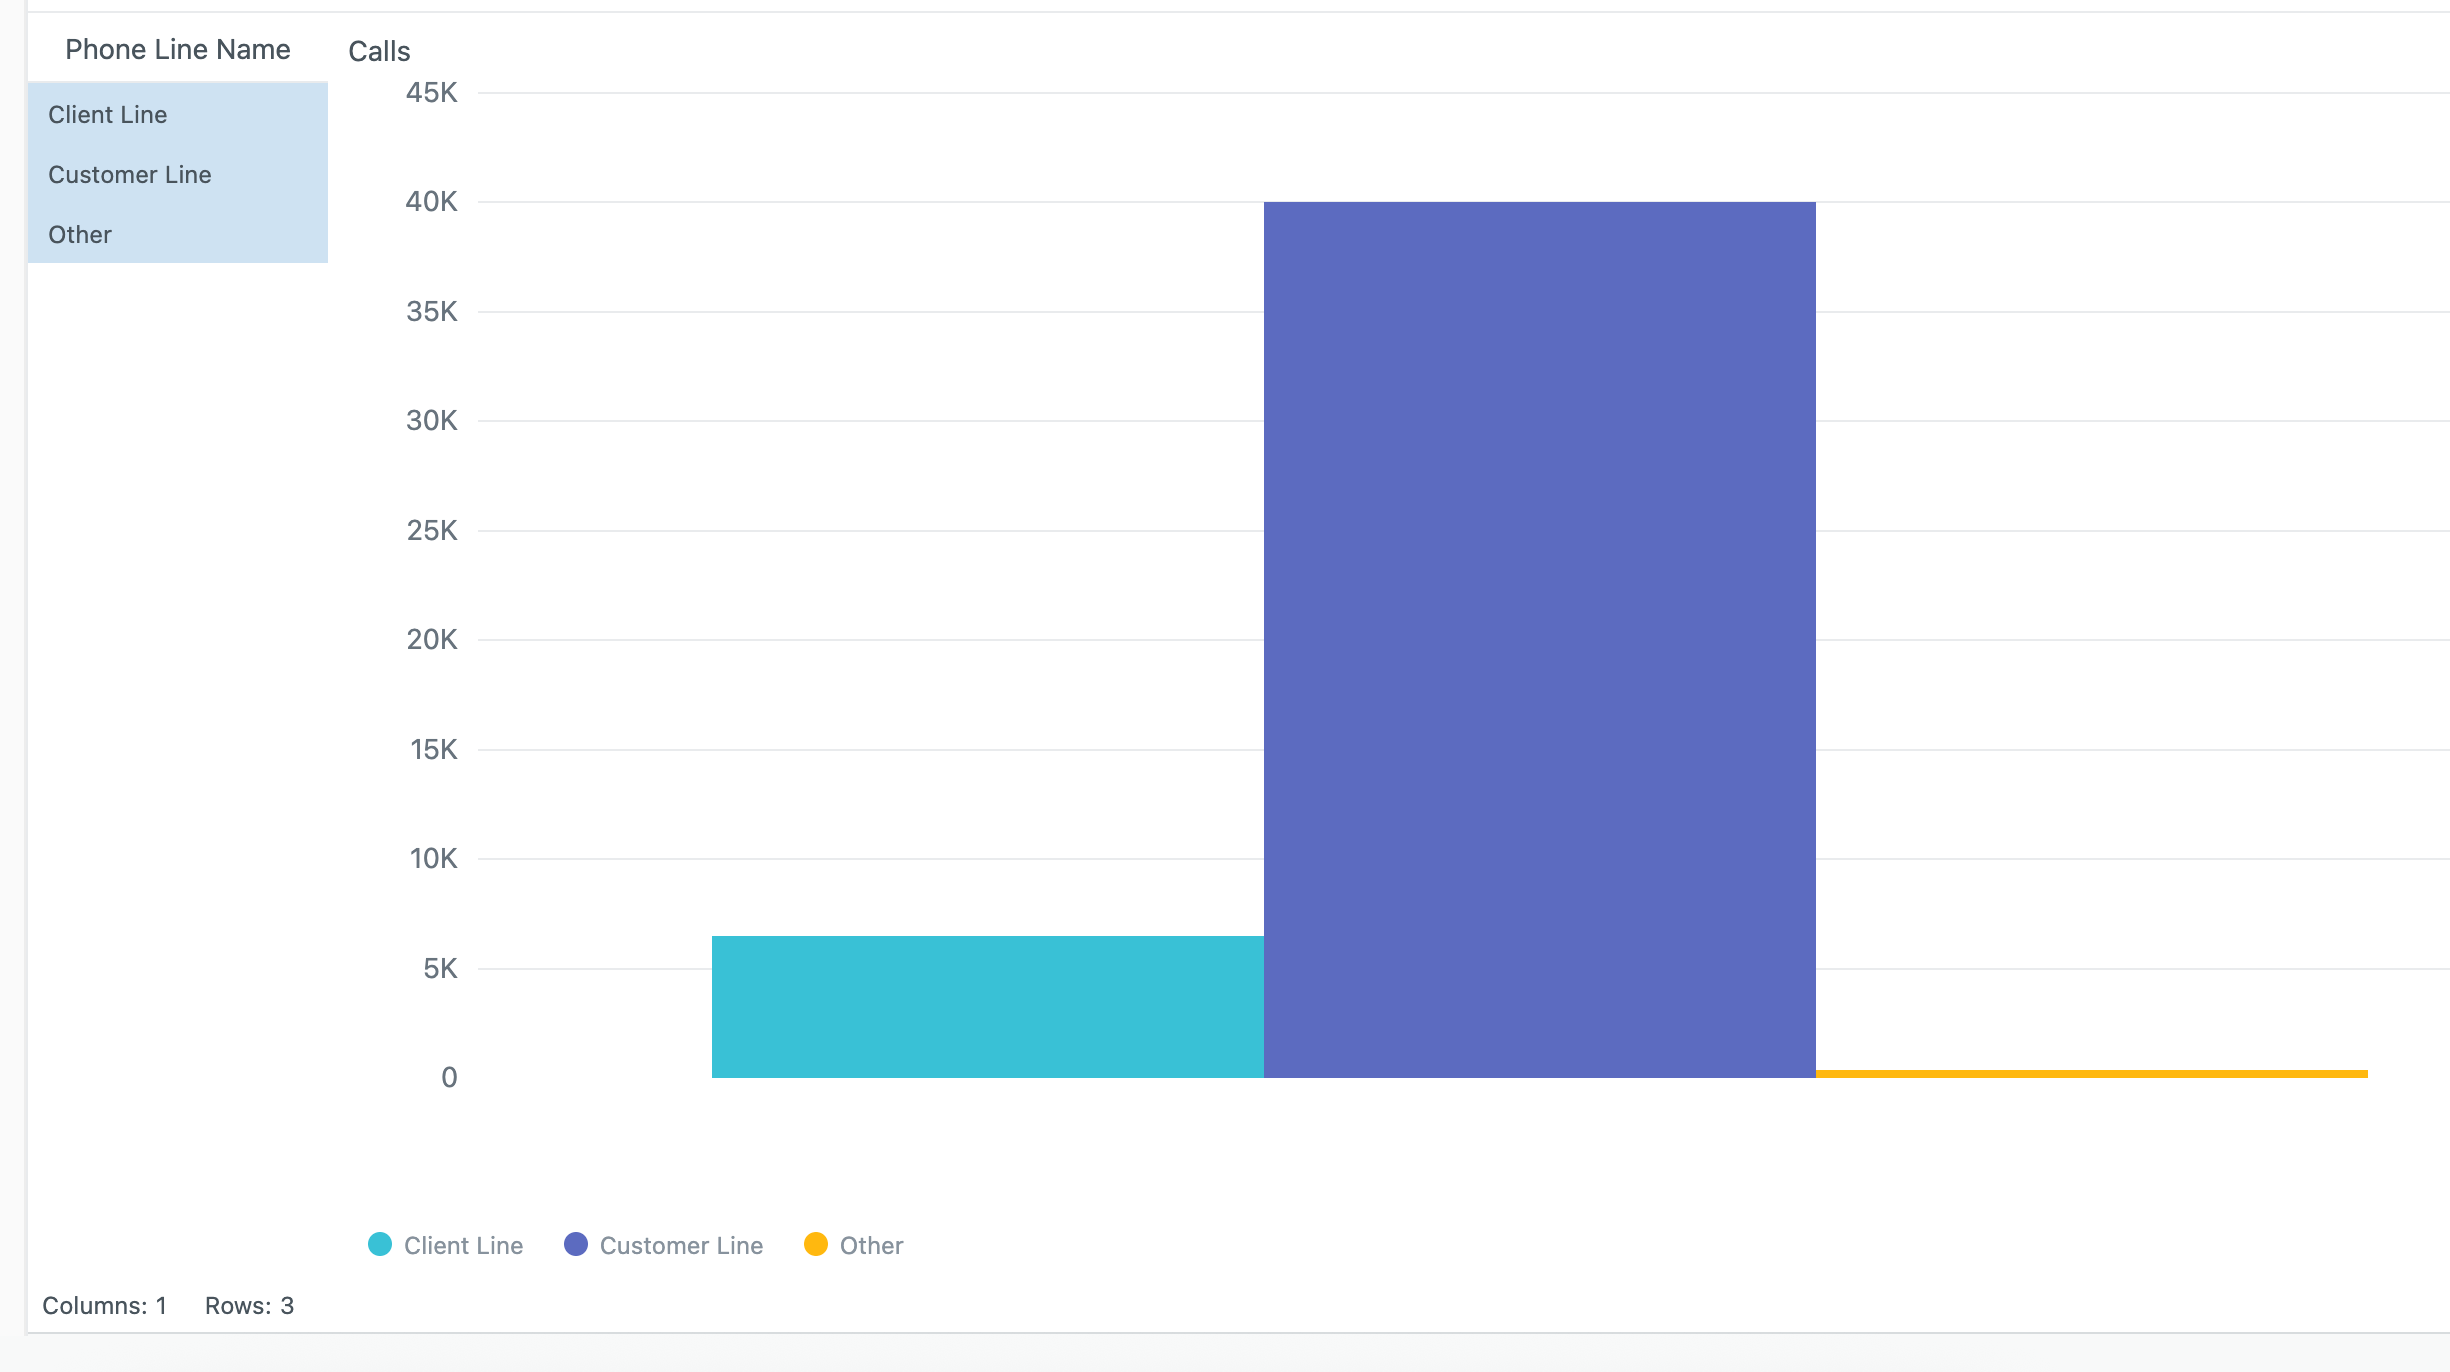
Abandoned Inbound Calls
This metric calculates the percentage of inbound calls where the customer disconnected before reaching an agent. High abandonment rates usually point to long waits, poor routing, or staffing gaps, so this is a core KPI for any contact centre.
Zendesk Analytics supplies abandoned inbound calls as an absolute number, but that’s somewhat meaningless without the context of how many total inbound calls there were. Viewed as a ratio of all inbound calls, we get an idea of what percentage of customers are getting through to your team when they need them most.
This metric is particularly useful when combined with attributes like Abandon Location inc. Short-Abandoned, so you can break down why customers hang up rather than just seeing the overall number.
Copy
D_COUNT(Abandoned inbound calls)/D_COUNT(Inbound calls)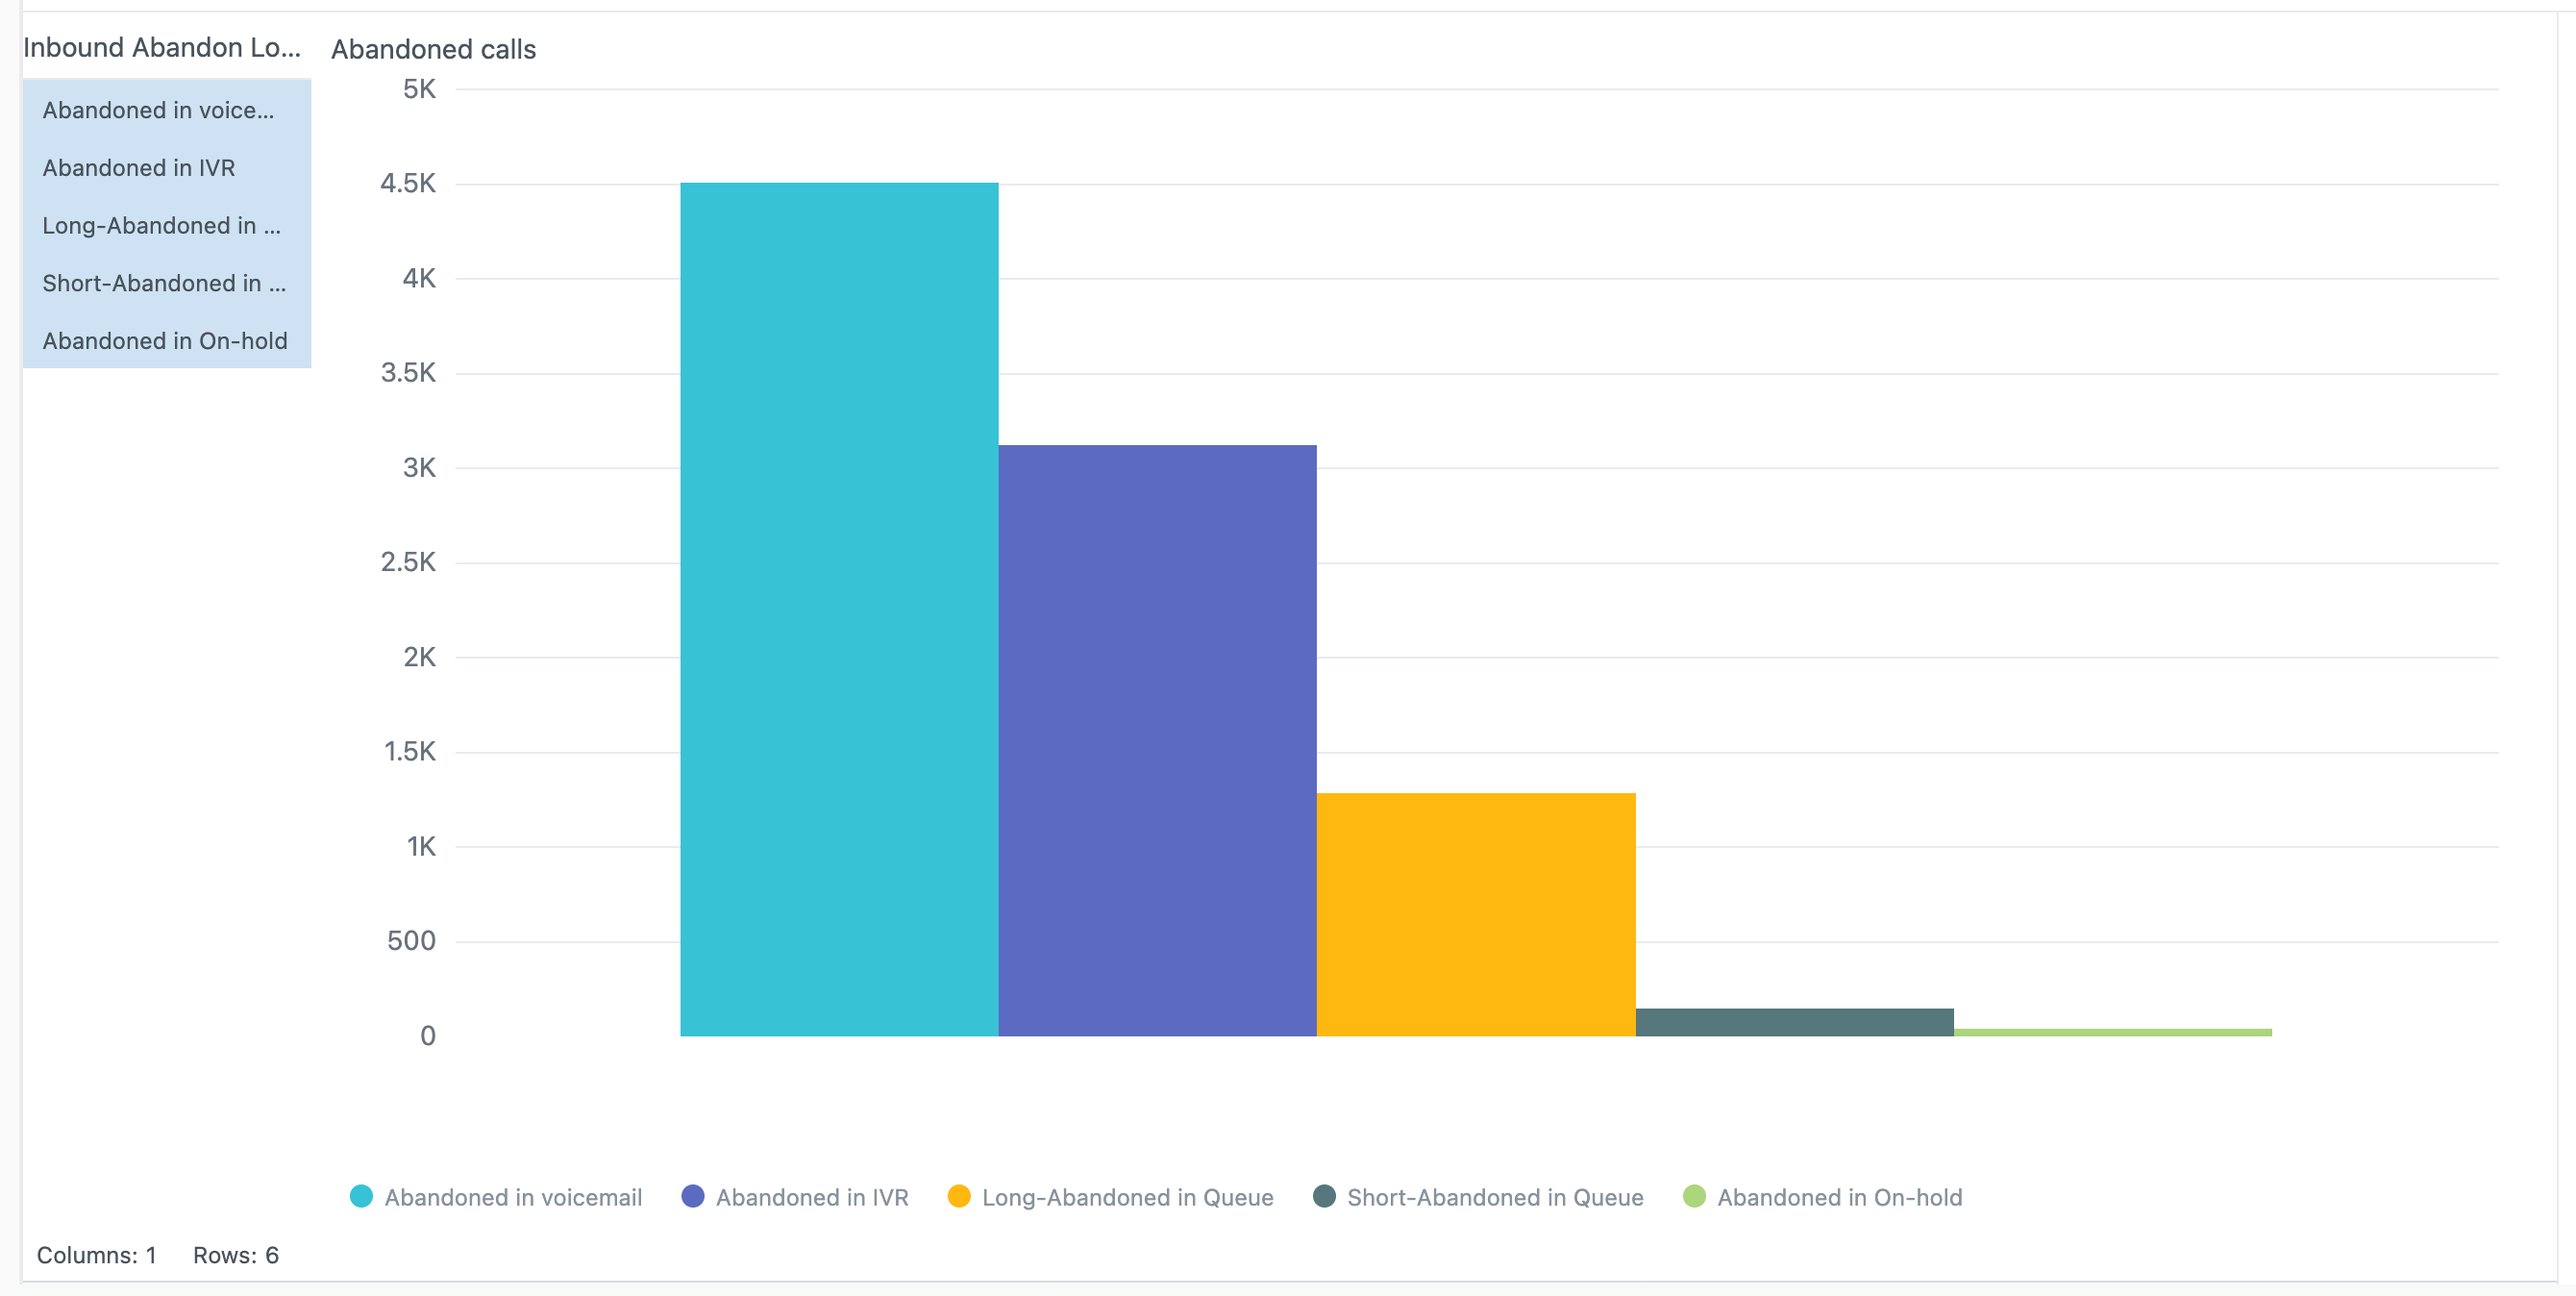
In this example, we’ve paired our custom metrics with time-based attributes to produce a graph that instantly highlights an issue with abandoned calls at the weekends. If we viewed abandoned calls as an absolute number rather than a percentage, we might not spot the issue, as there may be fewer calls at the weekend, hiding the spike in abandoned call rate.
Abandoned in IVR Calls
Sometimes abandonment happens before customers even reach a queue. This metric isolates calls dropped inside the IVR menu, which are easy to miss in default reporting.
High IVR abandonment can mean the menu is too long, the options are confusing, or callers do not find what they are looking for. By pulling these numbers out separately, you can see whether the problem is with staffing or with menu design.
Copy
IF (([Call direction]="Inbound")
AND ([Call completion status]="Abandoned in IVR"))
THEN [Call ID]
ENDIF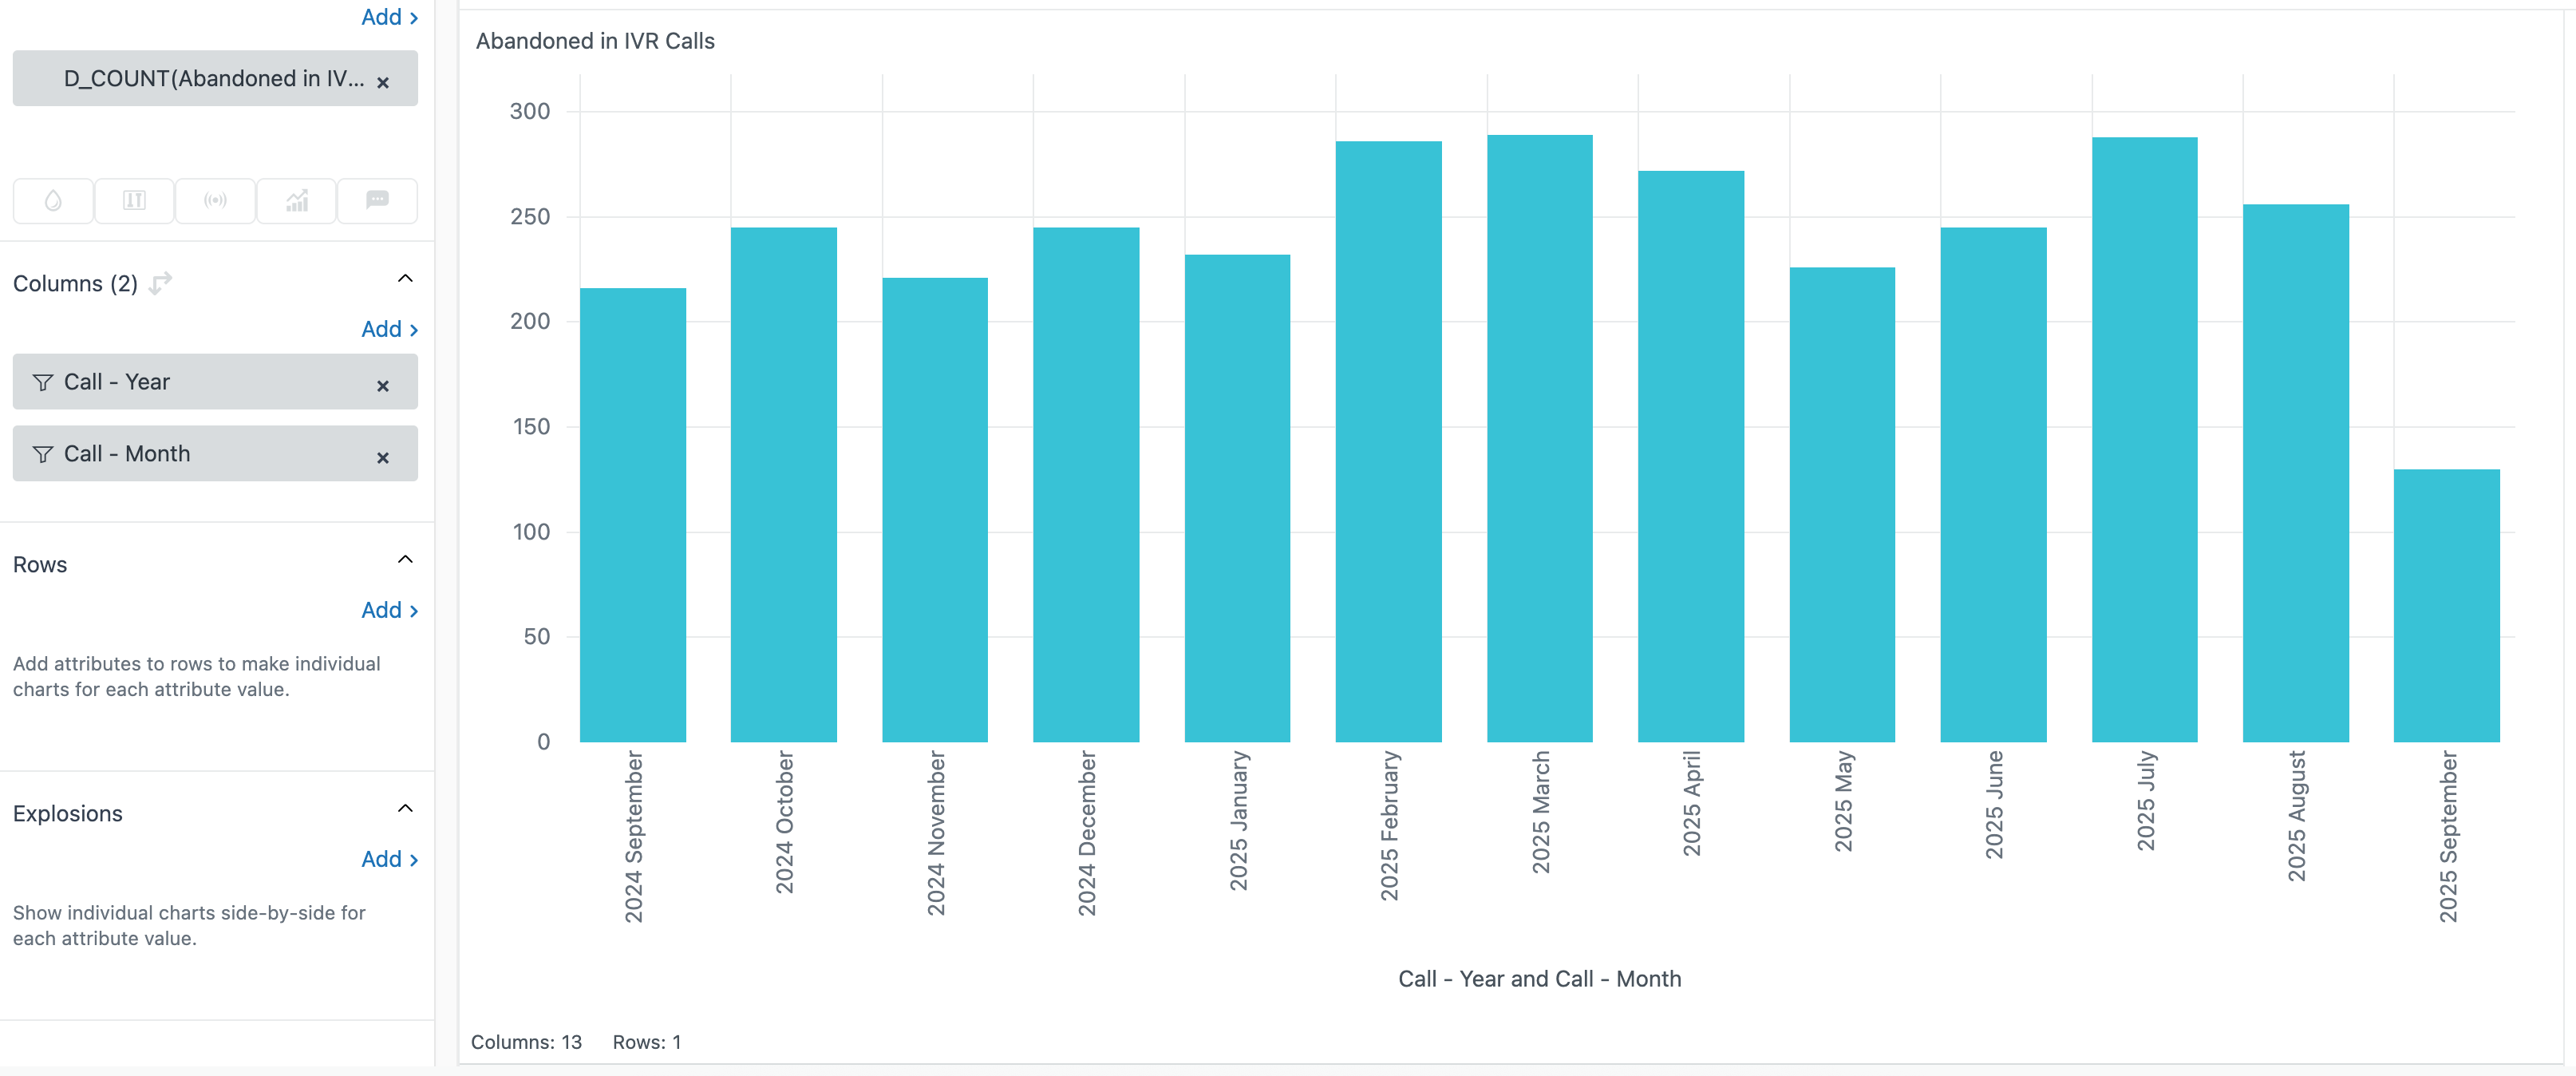
Short-Abandoned Calls (Metric)
Not all abandoned calls are equal. If a customer hangs up after 2 or 3 seconds, that does not really say much about your queue or agent performance. Many managers prefer to remove these cases from the main abandonment rate and track them separately.
This metric does exactly that by (dis)counting calls abandoned within the first 10 seconds in the queue. You can adjust the threshold if your team defines “short” differently. This metric is a key building block for the next, even-more-useful metric in our list.
Copy
IF (([Call direction]="Inbound")
AND (VALUE(Call wait time (sec)) < 10)
AND ([Call completion status]="Abandoned in queue"))
THEN [Call ID]
ENDIF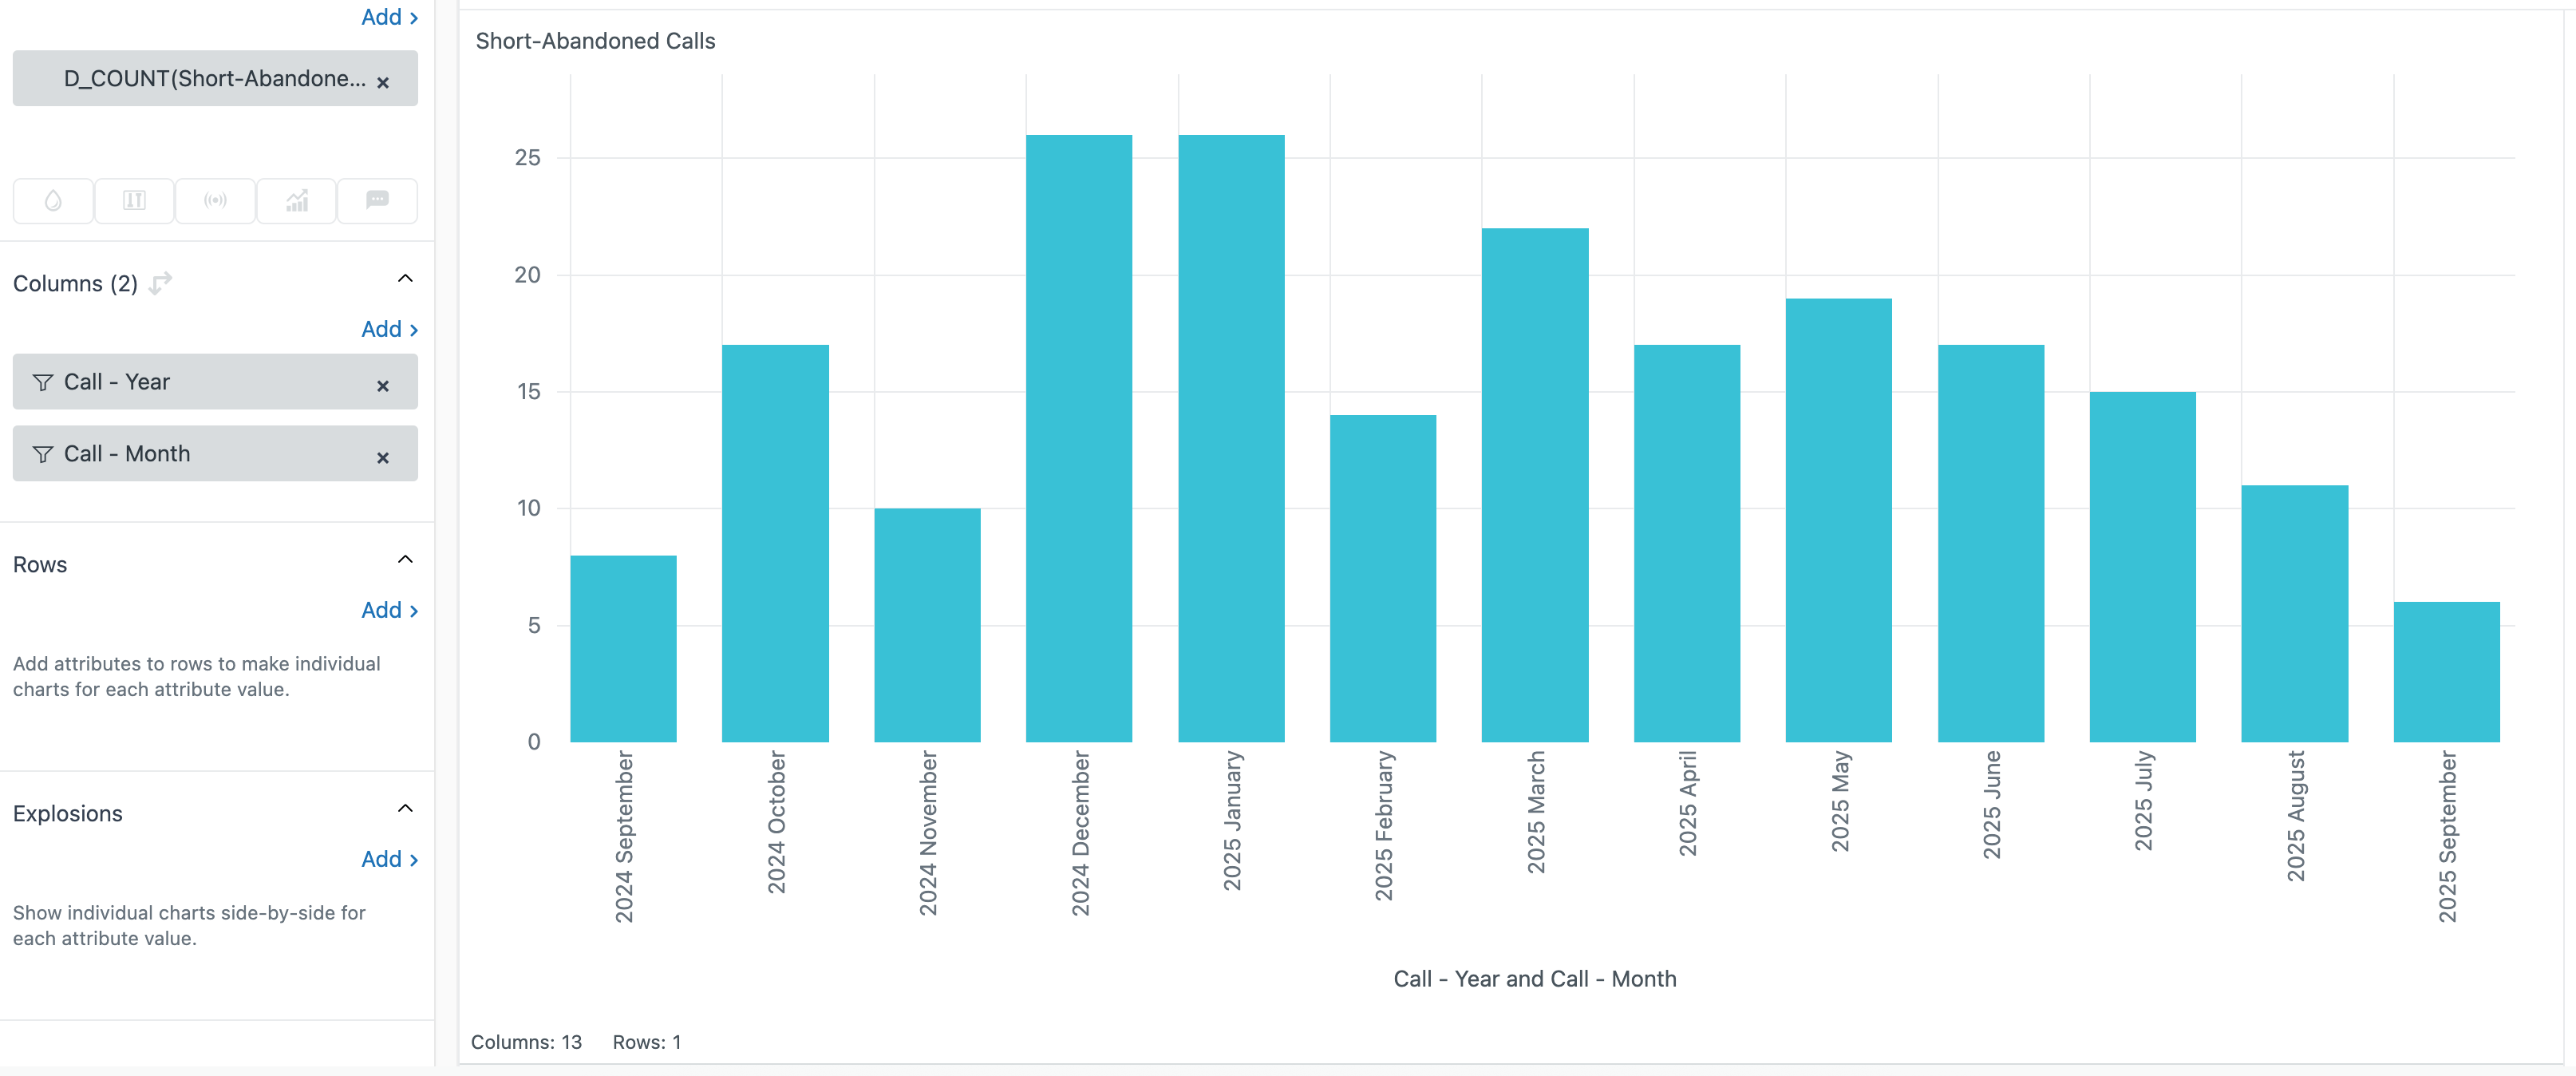
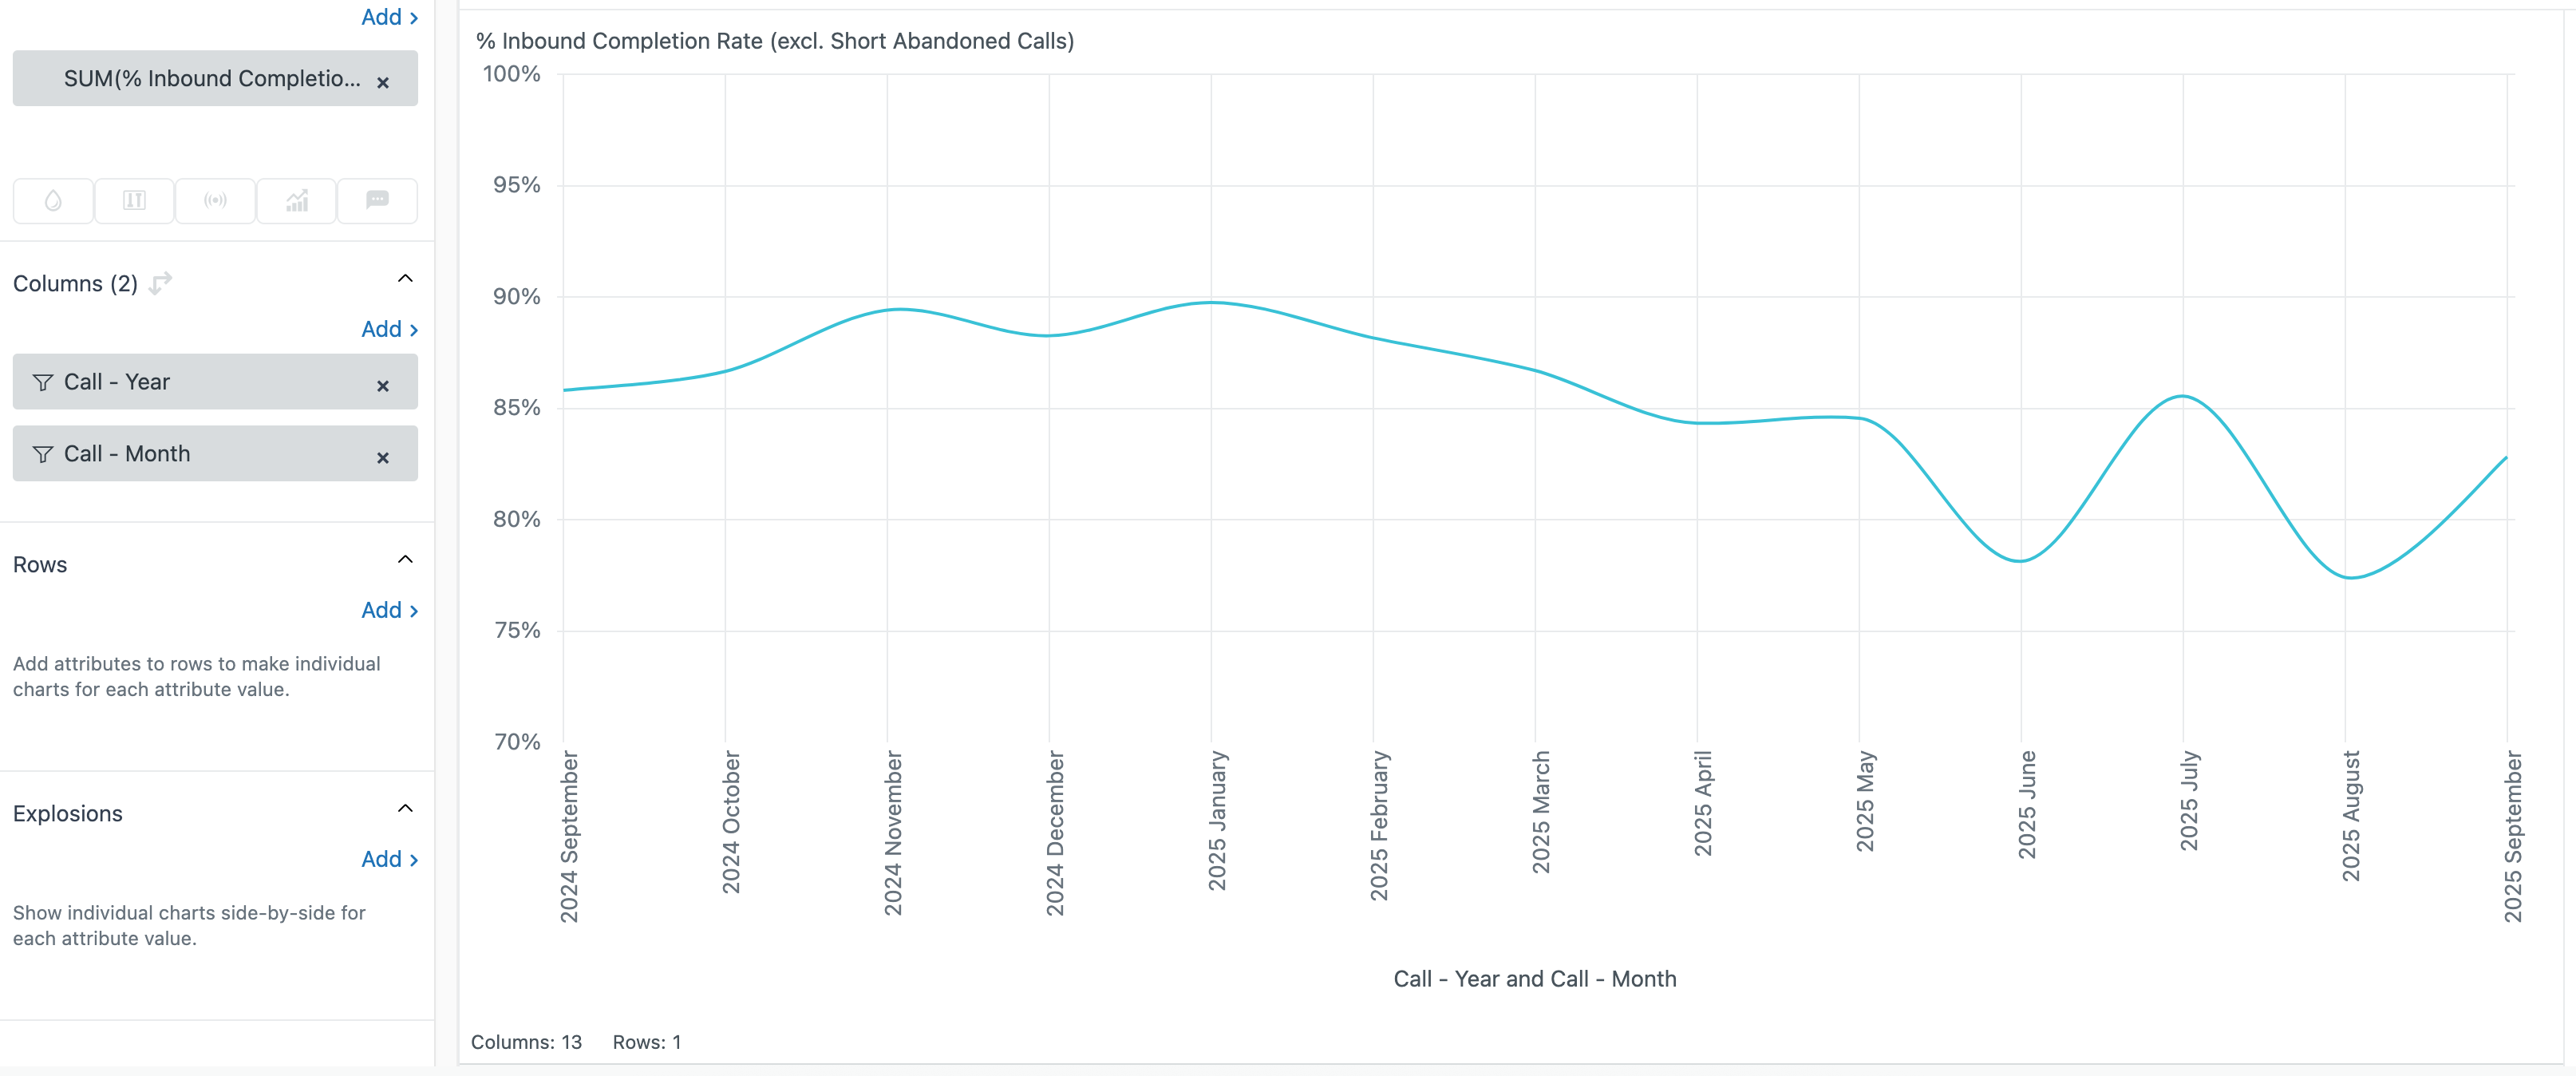
Inbound Completion Rate
Inbound completion rate is a standard KPI, but the raw number can be misleading. It includes abandons that are not the agent’s fault, like IVR drop-offs or callers who hang up within a few seconds of joining the queue.
This custom metric produces a fairer picture by excluding those cases. That way, you can measure the completion rate for calls that agents actually had a chance to handle. It’s an incredible metric as it avoids penalising staff for situations outside their control and gives a clearer picture of service quality.
Comparing this metric to the overall inbound completion rate gives you an idea of where the biggest gains are to be made.
Copy
D_COUNT(Completed inbound calls) /
(
  D_COUNT(Inbound calls)
  - D_COUNT(Short-Abandoned Calls)
  - D_COUNT(Abandoned in IVR Calls)
)
Conclusion
These four custom Talk metrics, and one attribute, give you a much stronger handle on what is really happening on your voice channel. From fairer completion rates to more accurate abandonment reporting, they let you separate unhelpful data from that which matters most. It also sets you up to edit thresholds as you see fit, as only you know your team best.
By adopting these into your dashboards, you move beyond surface-level metrics and gain insights that you can use to drive meaningful change to your Customer Support department.

