Written by Zendesk Consultant, Jude Kriwald.
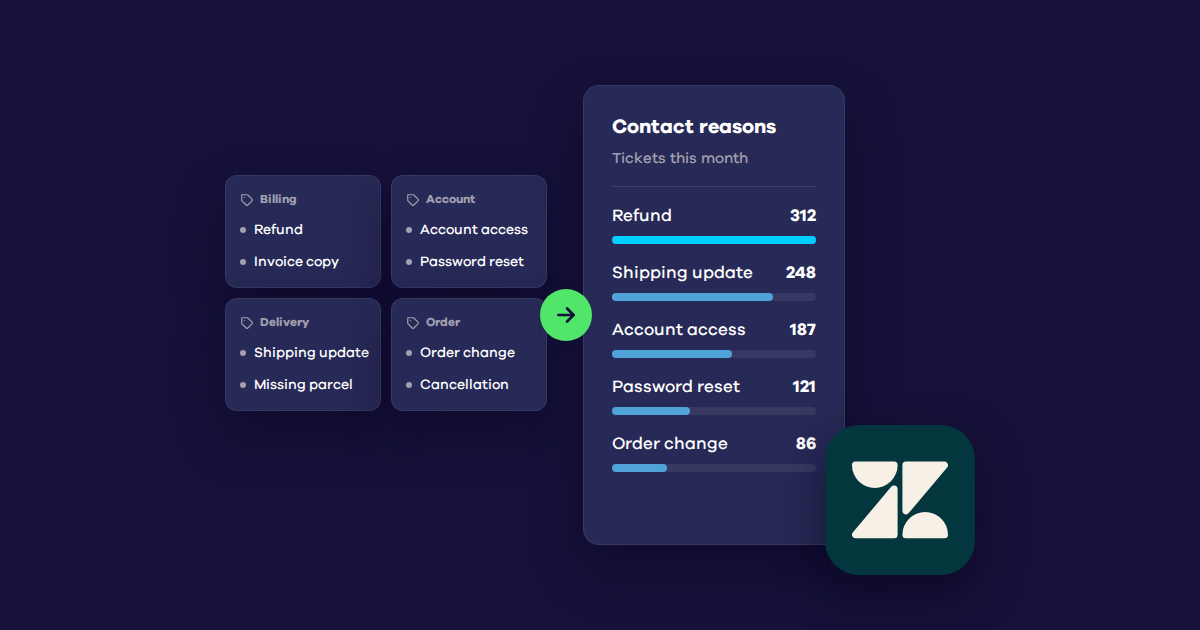
Learn how to merge conditional ticket fields into one Explore attribute so you can report on every contact reason in a single view.
Zendesk Analytics (formerly Explore) is powerful, but one area where it falls short is in handling conditional ticket fields with any ease. Many teams use these fields to capture detailed contact reasons under different parent categories. Not being able to report on these is like not knowing why a sales team’s sales are dropping — it’s simply info you can’t afford not to know.
For example, your top-level field might be “Category” with values like Billing and Purchases, Account Inquiries, General, and Legal. These are just that—categories. They are not the reason your users are contacting you.
Each of those categories has its own conditional second-level field, such as:
- Billing and Purchases – Issue
- Account Inquiries – Issue
- General – Issue
- Legal – Issue
The values for these second-level fields might be, in the case of “Billing and Purchases – Issue”, for example: Refund, Faulty Item, Unpaid Invoice, Shipping Update, and so on.
These second-level fields contain the real detail about why customers are getting in touch. They are the true drivers of contacts. But because Zendesk Analytics treats them as separate attributes, it can feel almost impossible to report on them consistently in one place, side by side.
That is where the Second Categories Combined attribute comes in. By merging multiple second-level fields into a single calculated attribute, you can finally view all detailed contact reasons side by side.
Why this matters
Without combining these fields, reporting becomes fragmented. You might end up with four separate charts, one for each parent field, which makes analysis harder and less reliable. As a CS manager you need to be able to clearly answer “What are our top contact reasons?”—not give four partial answers that need piecing together in a separate spreadsheet every month.
Bringing second-level fields together into one unified attribute ensures you can:
- Report on all detailed contact reasons in a single view.
- Keep dashboards consistent without breaking things down by parent field.
- Identify true drivers of support demand at the most granular level.
It is also easier for agents and managers to read. Instead of switching between different charts, you get one clean list of categories that everyone can understand.
The structure
The logic here is simpler than many other calculated attributes. You do not need IF/THEN/ENDIF, just a formula that combines the different second-level fields:
Copy
[Billing and Purchases - Issue] +
[Account Inquiries - Issue] +
[Legal - Issue] +
[General - Issue]
Zendesk Analytics reads this as “take whichever of these fields applies on each ticket and return the value”. The plus sign does not add numbers together—it merges text from multiple fields into a single reporting output.
The result is one attribute that works across all tickets, regardless of which top-level category they came from. You can then pair it with other metrics to see effort and speed by detailed reason.
Step-by-step: building the combined attribute
Follow these steps to create the attribute in your own account:
- Go to Analytics → Report Builder and select the Support - Tickets dataset.
- Click the Calculator icon and choose Standard calculated attribute.
- Paste in the formula:
Copy
[Billing and Purchases - Issue] +
[Account Inquiries - Issue] +
[Legal - Issue] +
[General - Issue]
- Update the field names so they match your actual custom field names. If you are unsure, use the Select a Field drop-down to make sure you pick the right one. You can also go back to the Support ticket interface, change the top-level Category field one value at a time, and see which conditional second-level fields appear. These are the ones you want to add here.
- Check that you have the green tick at the top of the code box.
- Save the attribute with a clear name, such as “Second Categories Combined”.
- Try adding it as a row to your report. Set the metric as
D_COUNT(Tickets)and add your top-level category as a row above your custom attribute. This will neatly label all your second-level categories so you have the full context of their category as well as the detailed contact reason. - Sort the report by value, descending, to see which contact reason is creating the most tickets for your team.
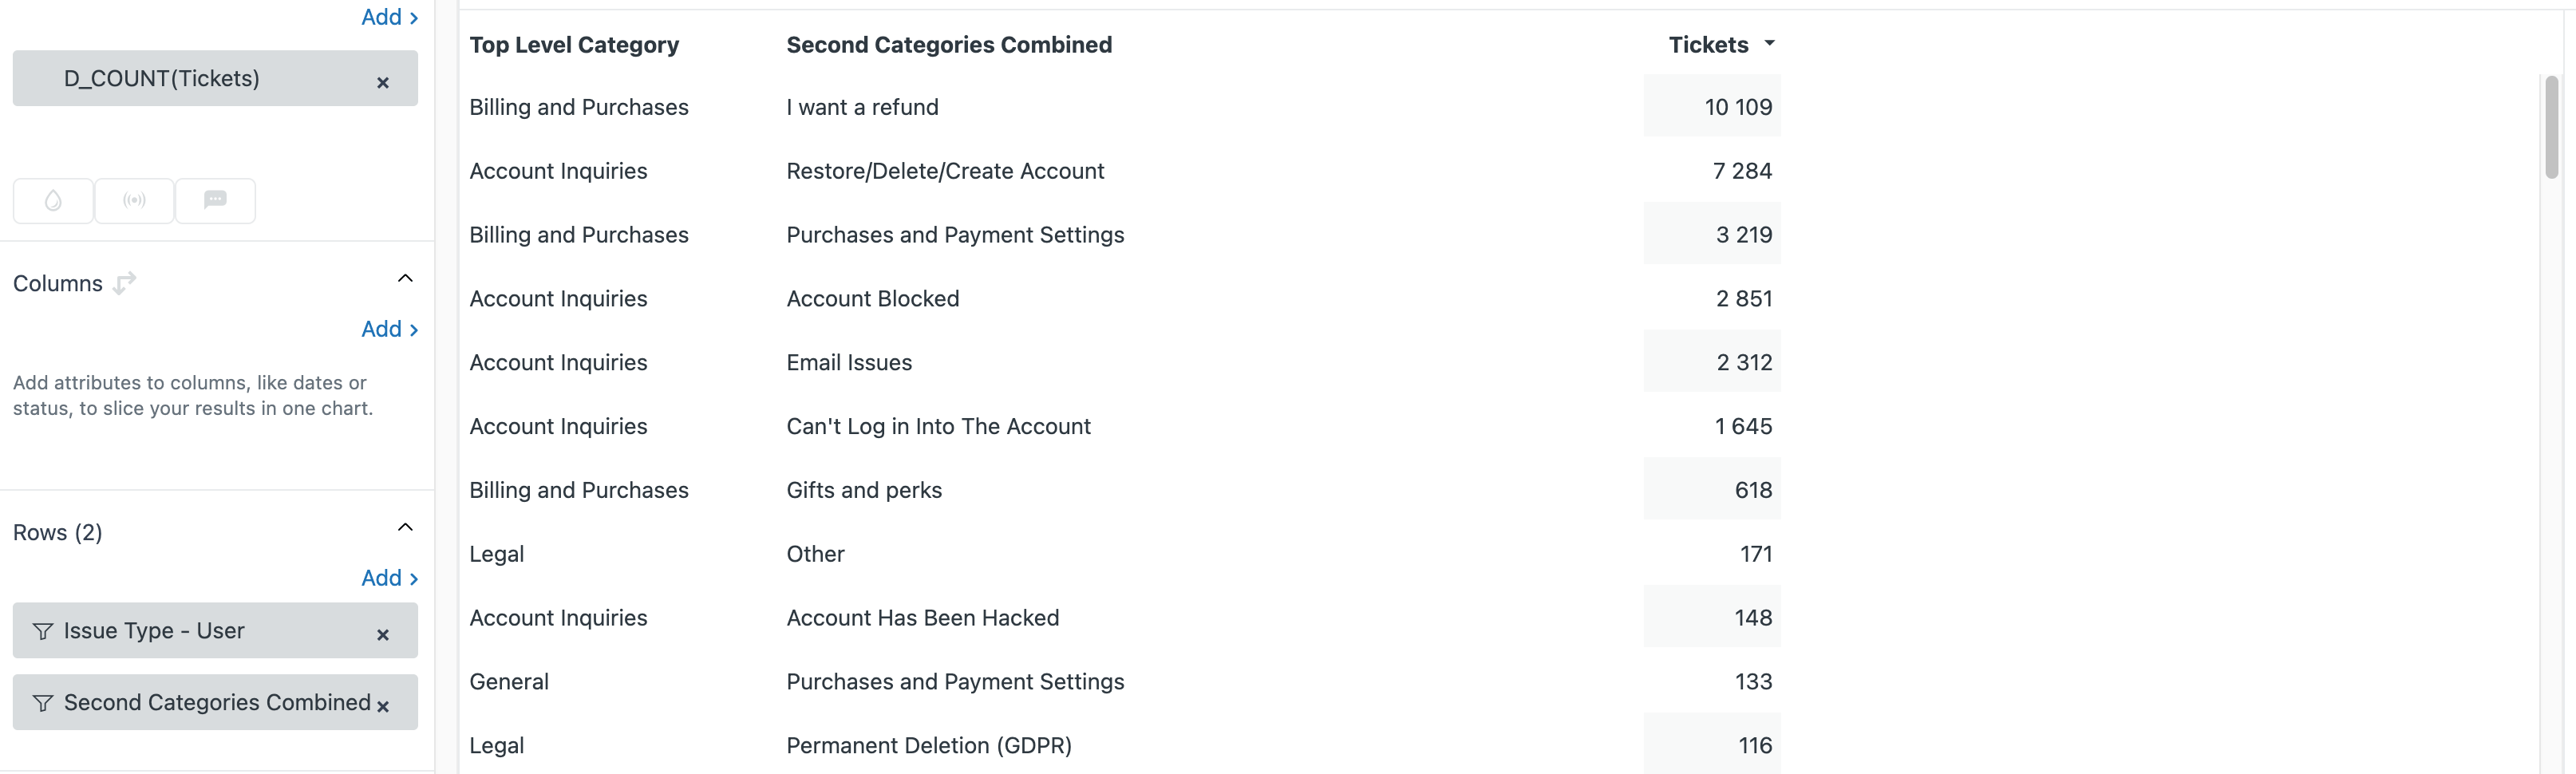
Looking at the above example report, we now have a hugely useful insight into the fact that refund requests are the largest cause of contact in this example dataset. If we were only viewing the Billing and Purchases data, without looking at it alongside Account Inquiries and other fields’ data, we wouldn’t be able to easily see what the top contact driver was.
Validation tips
- Spot-check tickets from each parent field to confirm their second-level values are showing correctly.
- Double-check you haven’t accidentally added a top-level field into the formula, as this will throw your results off.
- Make sure every conditional field you care about is included, otherwise it simply won’t appear in the combined view.
Caveats and considerations
- Consider which other metrics could be hugely insightful to look at on a per-contact-reason basis. Imagine being able to see CSAT or AHT per contact reason—that’s incredibly useful data! You can also add SLA lenses to track fast resolutions by reason.
- You will need to update the formula if new conditional fields are added in the future.
- The combined attribute pulls values exactly as they are stored in Zendesk. Use the Select a field button to select correctly.
- It is best practice to use this combined attribute as your default “reason” dimension, rather than relying on the individual parent fields. This avoids confusion and ensures reporting stays standardised.
Summary
The Second Categories Combined attribute removes one of the most frustrating challenges in Zendesk Analytics. It merges separate but crucial conditional fields into a single attribute, so you can track all detailed contact reasons consistently.
By doing this, you avoid fragmented dashboards with repeated reports, and gain clearer insights into the true drivers of demand on your support team. You can now look at average handle time per contact reason, ticket volume per contact reason, CSAT per contact reason, and more.
With this attribute in place, your reporting becomes more accurate, your dashboards more user-friendly, and your analysis of customer contact reasons much more reliable.

