
For customer support teams, real time data can be a total game changer, as our recent post outlined. [Read: Why is real-time reporting so important for customer support teams?]
Unlike periodic reports Zendesk Explore, or business intelligence tools, real time dashboards have the power to let your team take meaningful, timely action on data that’s seconds or minutes old, rather than days or even weeks old.
This can be transformative, speeding up response times, motivating your agents, improving service levels, and reducing day-to-day workload for managers.
Should you ditch your existing reports entirely?
Not at all. There will always be a time and place for analysis and reporting that can help you identify longer-term trends, dig deeper into the minutia affecting performance, and help with strategic planning.
But if you’re considering using real time dashboards in your support team, then we’ve got some suggestions for some metrics that will have more impact than others when tracked in real time, based on conversations with hundreds of Geckoboard + Zendesk customers.
Live support ticket volume
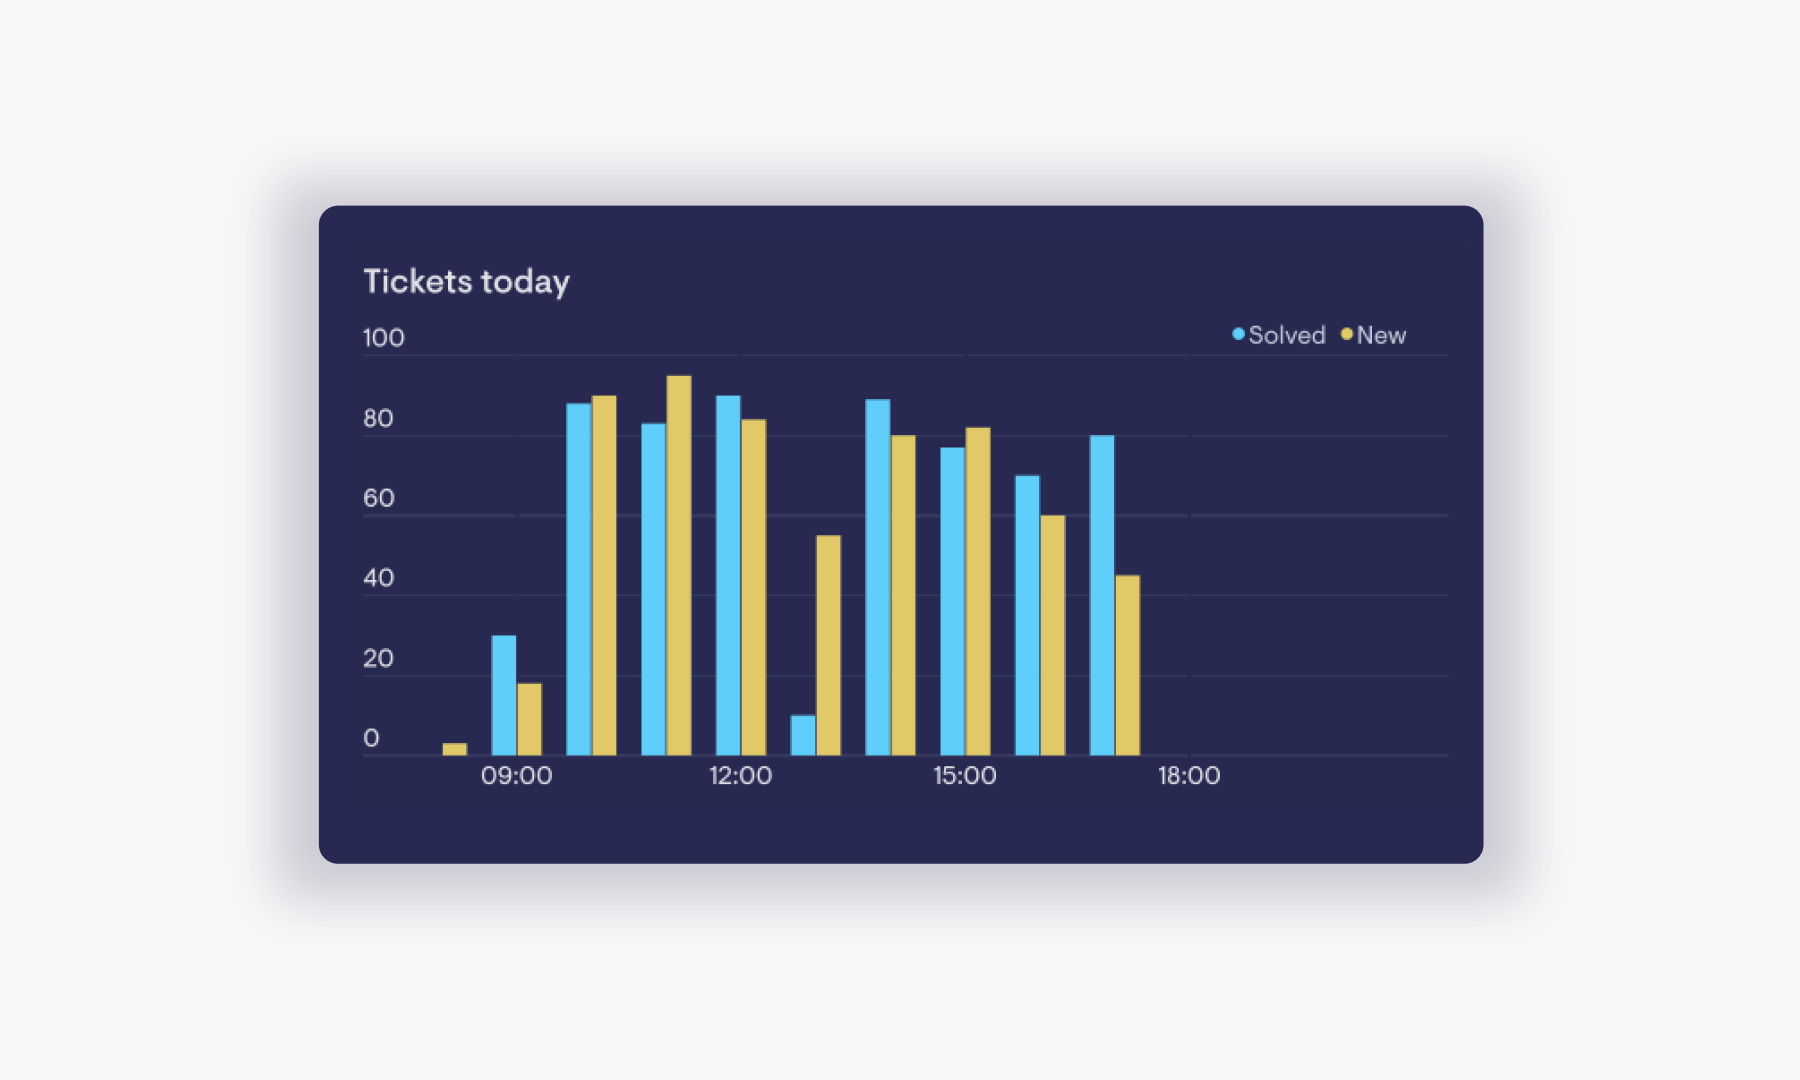
Tickets are the main currency in most support operations, so if there’s one thing you need to monitor closely, it’s how many tickets are hitting your inbox.
Your weekly or monthly reports probably already include a summary of this, which can help with identifying longer term trends or ticket themes.
But what if there was a spike in ticket volume right now? How long would it take you to know this was happening, and whether there’s an issue unfolding?
Most support team managers’ answers could be measured in days, or would be based on their sixth sense for how busy things are, rather than hard data. Instead, having an up-to-the-minute view of ticket volume, and getting in the habit of monitoring it throughout the day, gives your team the ability to quickly spot fluctuations as they occur, rather than days or even weeks after they happen.
And that means you’ll be able to take appropriate action much faster, as Oliver Jackson, Head of Customer Happiness at Mailbird points out:
“Thanks to a line chart we were referring to on our Geckoboard, we were able to discover a surge in the number of tickets which were being created. This allowed me to jump into the tickets, take a look at the anomalous requests which we were receiving which were actually linked to a mass scale spoofing attempt. We were quickly able to mitigate the impact that this could potentially have had on our customers.”
Oliver Jackson, Head of Customer Happiness at Mailbird
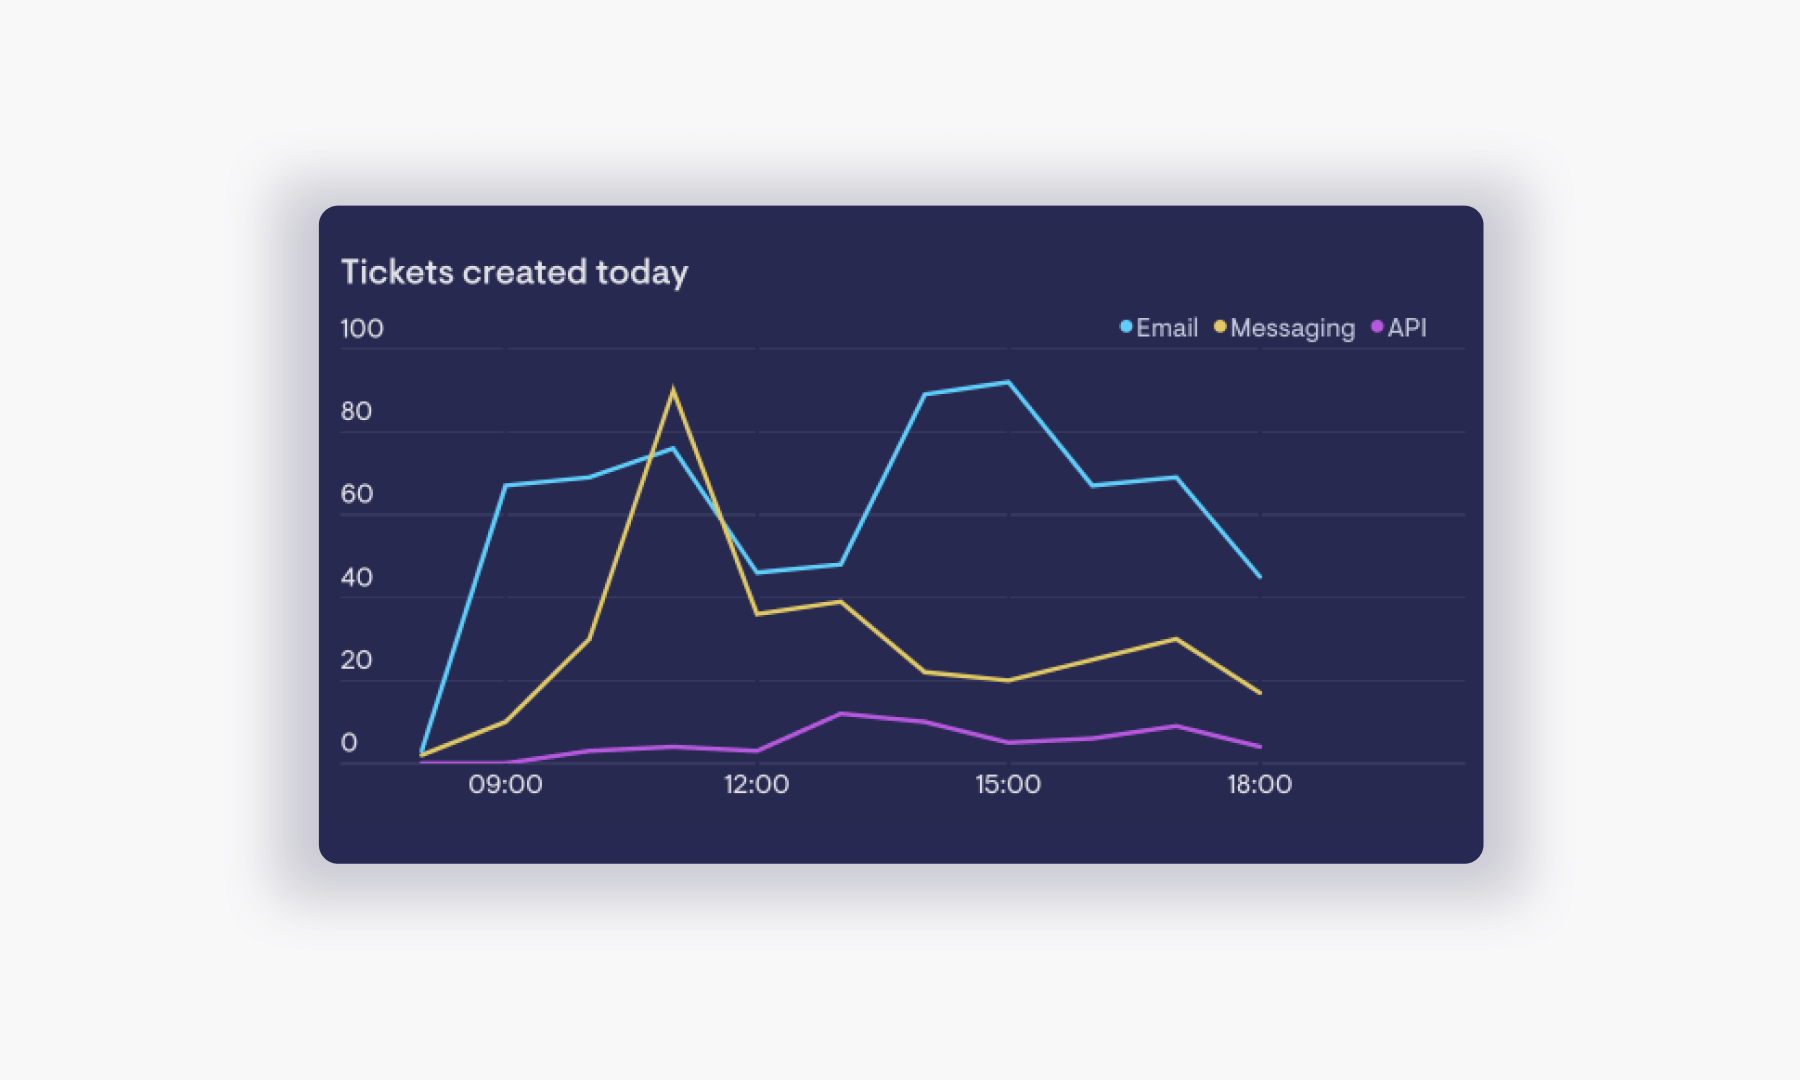
Volume by channel
There’s an even stronger case for monitoring live volume if you’re juggling multiple channels.
Aside from the fact that real-time channels like Chat, Talk and Messaging generally move faster, there’s huge value in being able to quickly understand the state of play for all of your channels (or indeed, brand or group) in one place at a glance, so you can quickly switch focus and resources between them.
Agent availability
Whilst it’s useful to see ticket, chat or call volume in real time, that’s often just one half the equation. The other half relates to how many agents are actually online and able to meet that demand. In other words, agent availability.
Ensuring you have the right number of agents online at any given time is crucial - too few, and your team will struggle to meet demand. Too many, and you’ll be running inefficiently.
Specialized tools like Tymeshift can analyze your Zendesk data and help you make those bigger decisions - like how many agents you should hire for the busy season, or how how to structure shifts. But seeing how many agents are online and available right now alongside your ticket/chat/call volume can massively help with making snap decisions throughout the day.
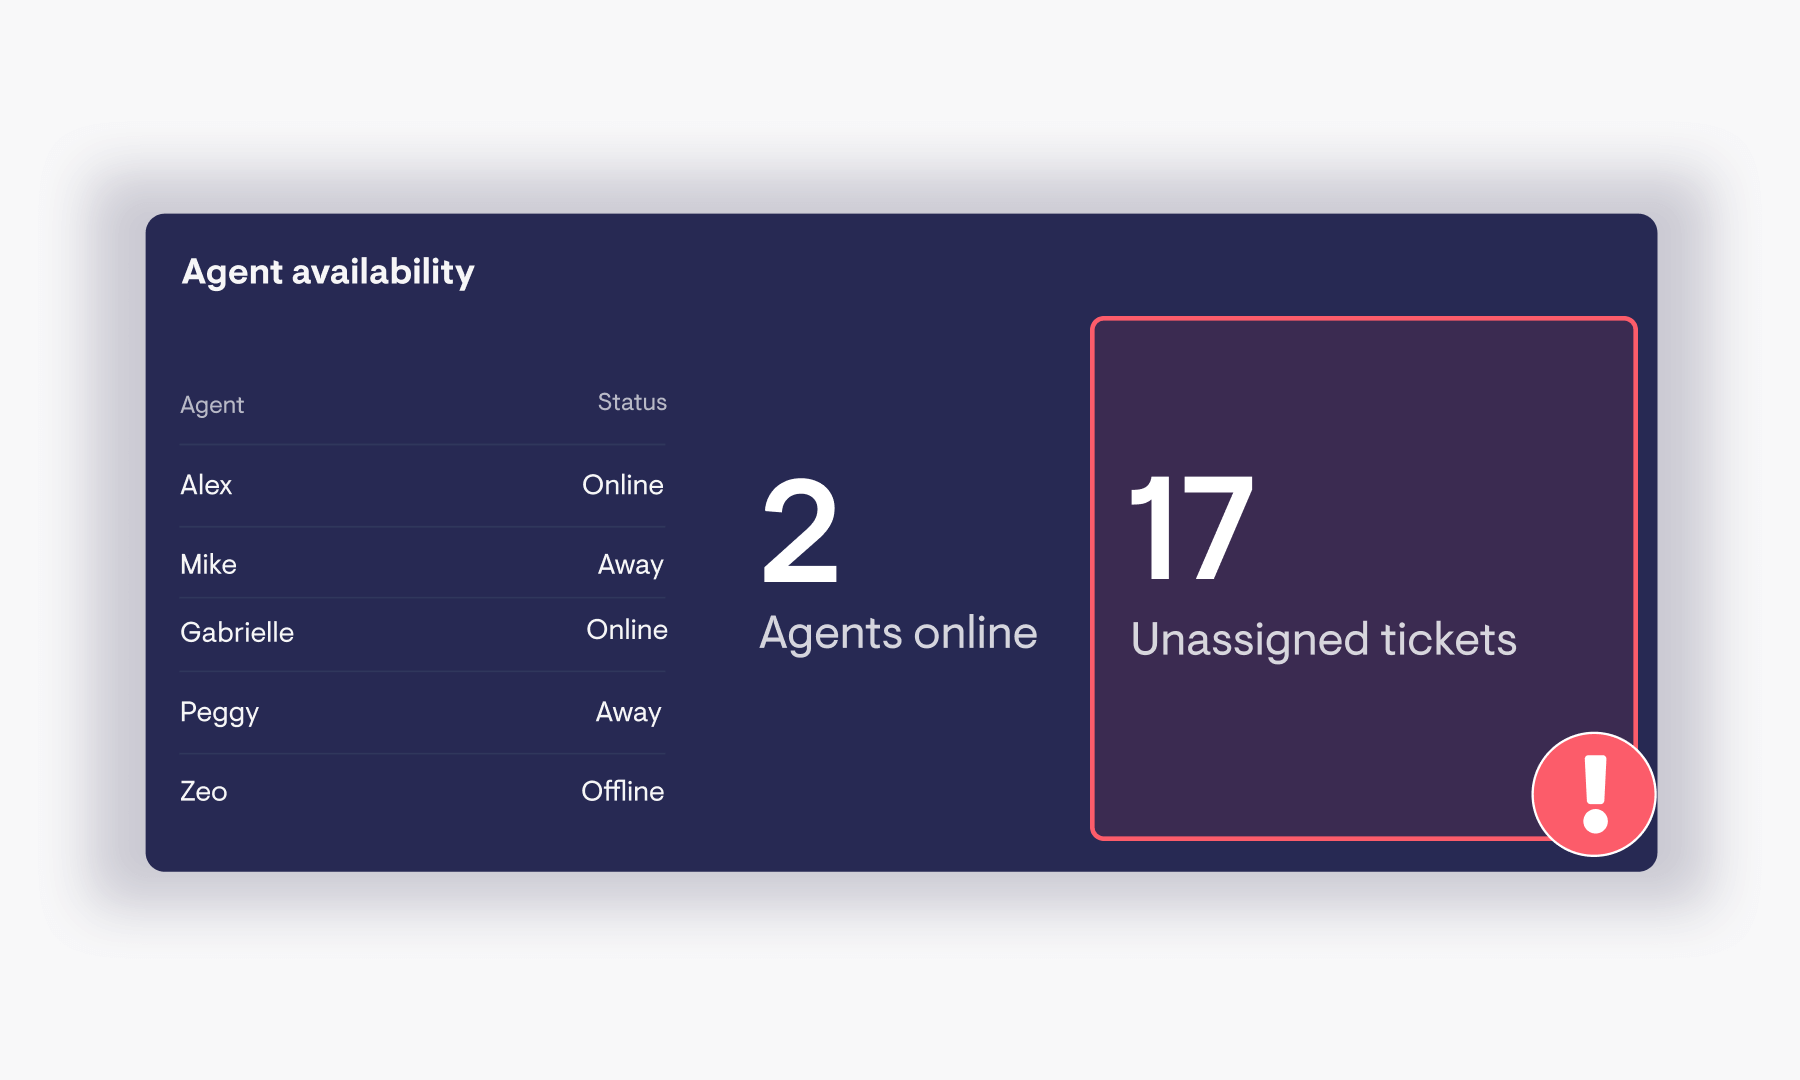
A dashboard containing these few pieces of live information lets managers quickly decide:
- Is the team able to meet current demand, or is some action needed?
- Do agents need to focus attention on a particular channel to meet increasing demand there
- Should you hop into the queue yourself to help?
- Is there capacity for agents to work on projects outside of the queue for a few hours?
- Are certain agents online too much or too little today?
Top ticket solvers
One way real time data can drive results in a support team is by giving agents a motivation boost, in ways that static or out-of-date data cannot. It’s more dynamic and engaging, and for agents in particular, it gives a window into how they’re contributing to a wider effort, beyond the queue they’re working.
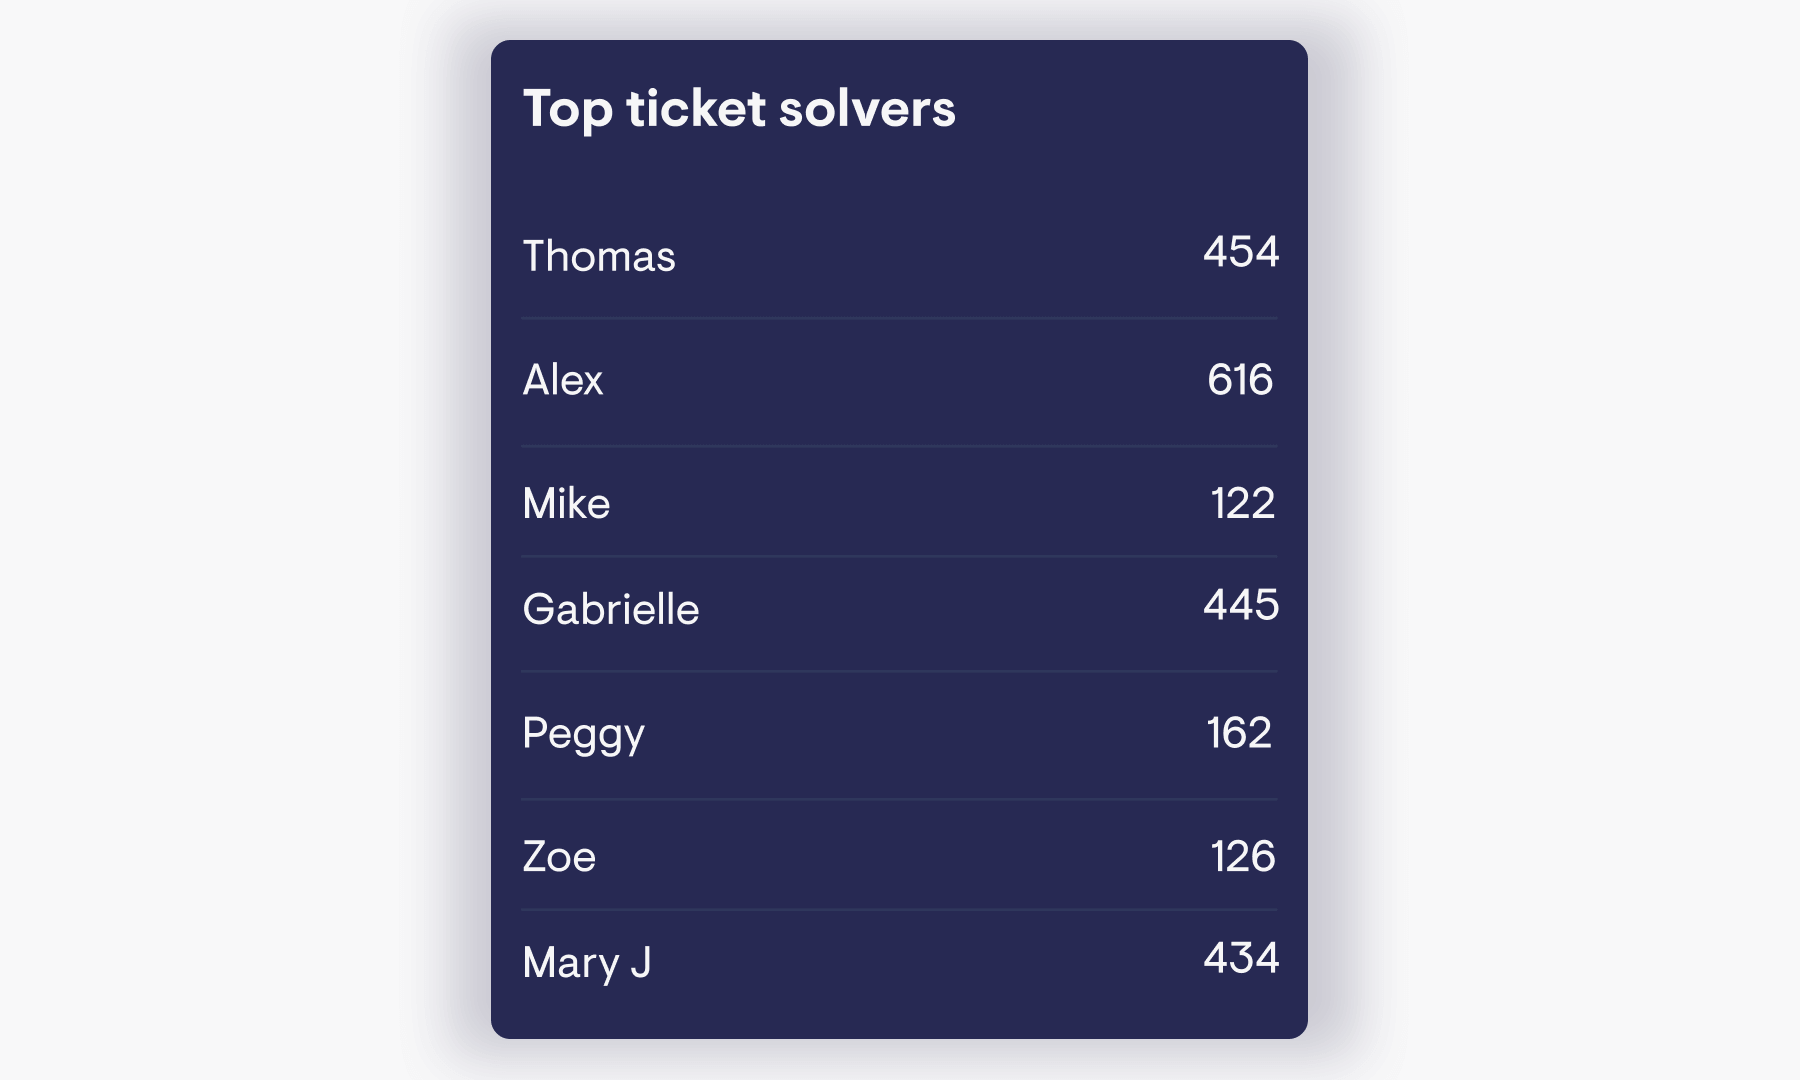
An increasingly common data point that teams are tracking for motivation reasons is top ticket solvers for the day,
When shown as a leaderboard - with agents ranked by number of tickets solved so far - a few very powerful effects begin to kick in.
- Agents who are near the top feel like their efforts are more recognised
- Friendly competition can develop between agents, in a bid to reach the top of the leaderboard, particularly when the team has personalities who are extrinsically motivated (read more about extrinsic Vs intrinsic motivation here)
- More productive agents will be able to see if other agents are struggling and perhaps lend advice or some of their time to help
- For managers, leaderboards can be a great prompt to call out individual performances throughout the day, or check in with agents who fall behind
“Our dashboard has created a competitive nature from seeing how many tickets have been solved. It gives agents a boost to see they’re top ticket solver. From a management perspective, if I see someone is closing significantly less tickets I am able to catch up with that person to see if everything is OK.”
Josh Hus, IT Services Manager at Veho
Tickets nearing SLA breach
If your team needs to work within specific Service Level Agreements (SLAs), then closely monitoring how you’re performing against those targets is crucial.
There are a whole host of SLA metrics that can, and probably should, be monitored in real time (for more suggestions, read how to track Zendesk SLA metrics). But tickets nearing SLA breach is undoubtedly the highest impact,
Quite simply, this is a list of specific tickets that are close to breaching one or more SLAs, like so:
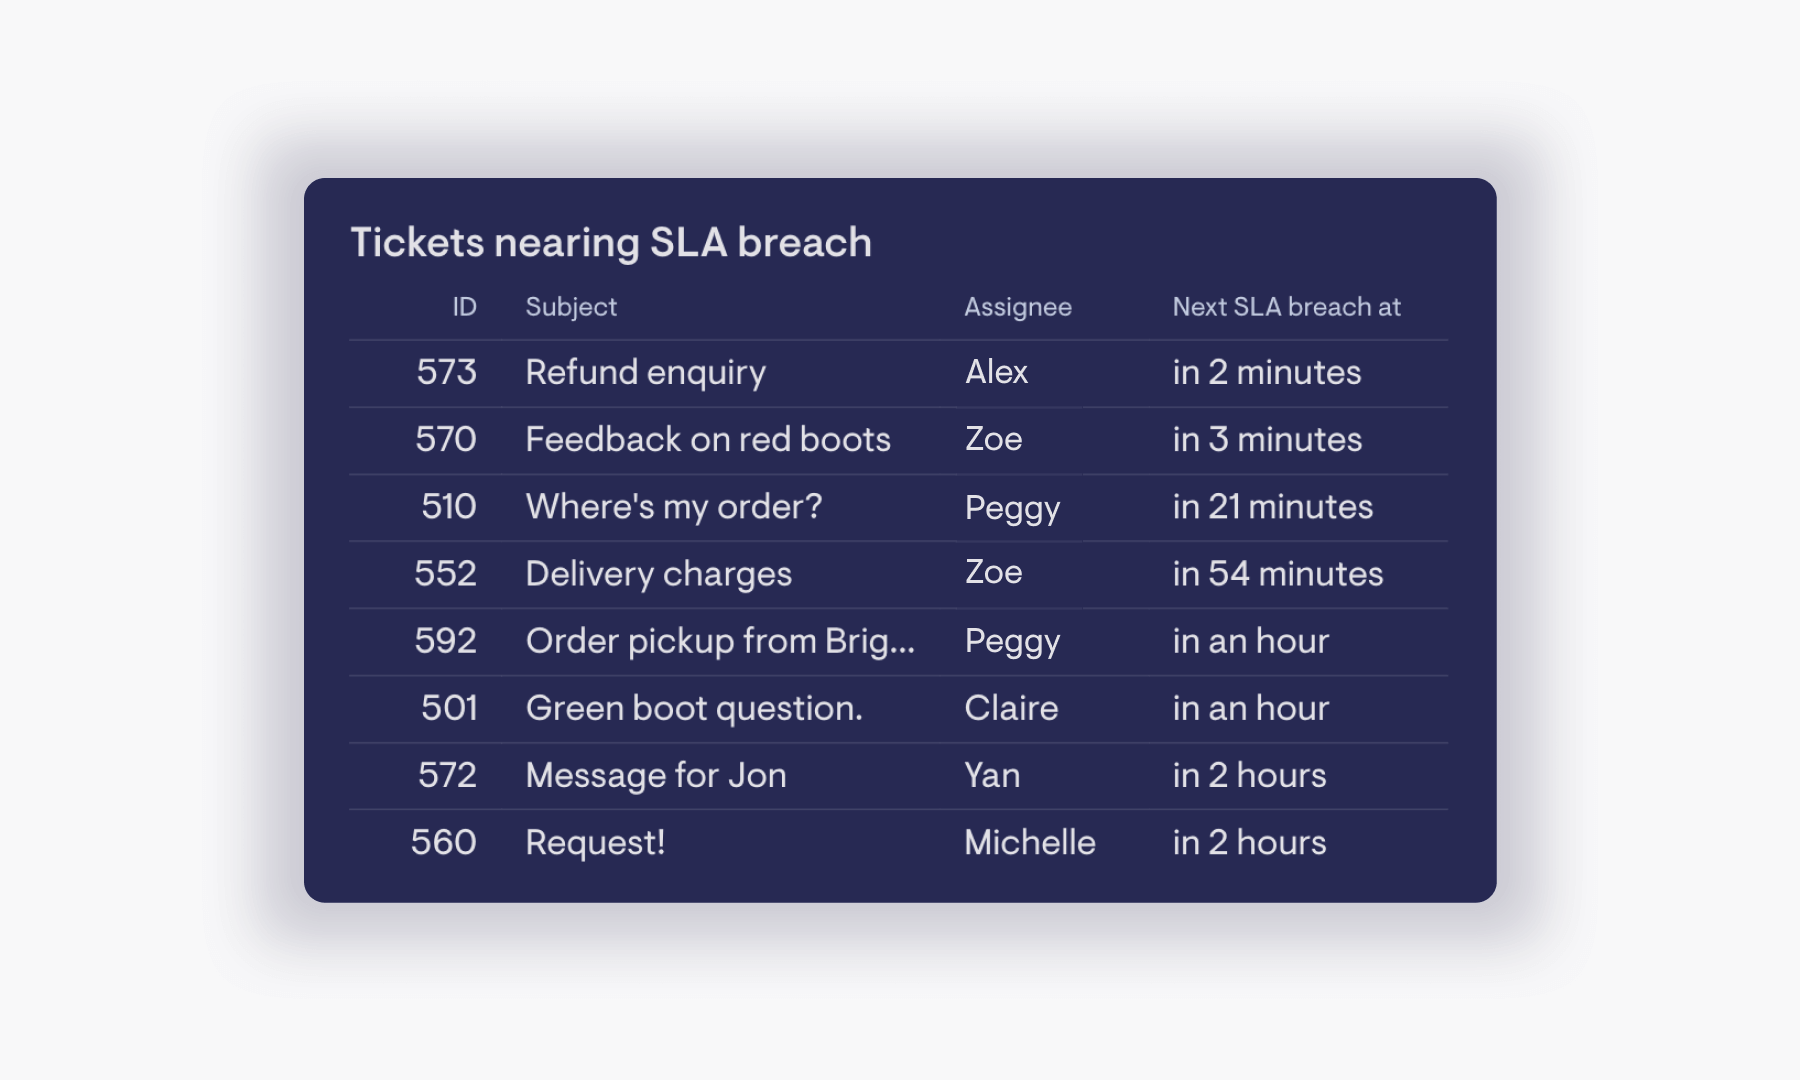
Monitoring this in real time gives a team a focused view of which specific tickets need their attention as soon as possible, ensuring agents can prioritize working on the highest-impact tickets first in order to meet their targets.
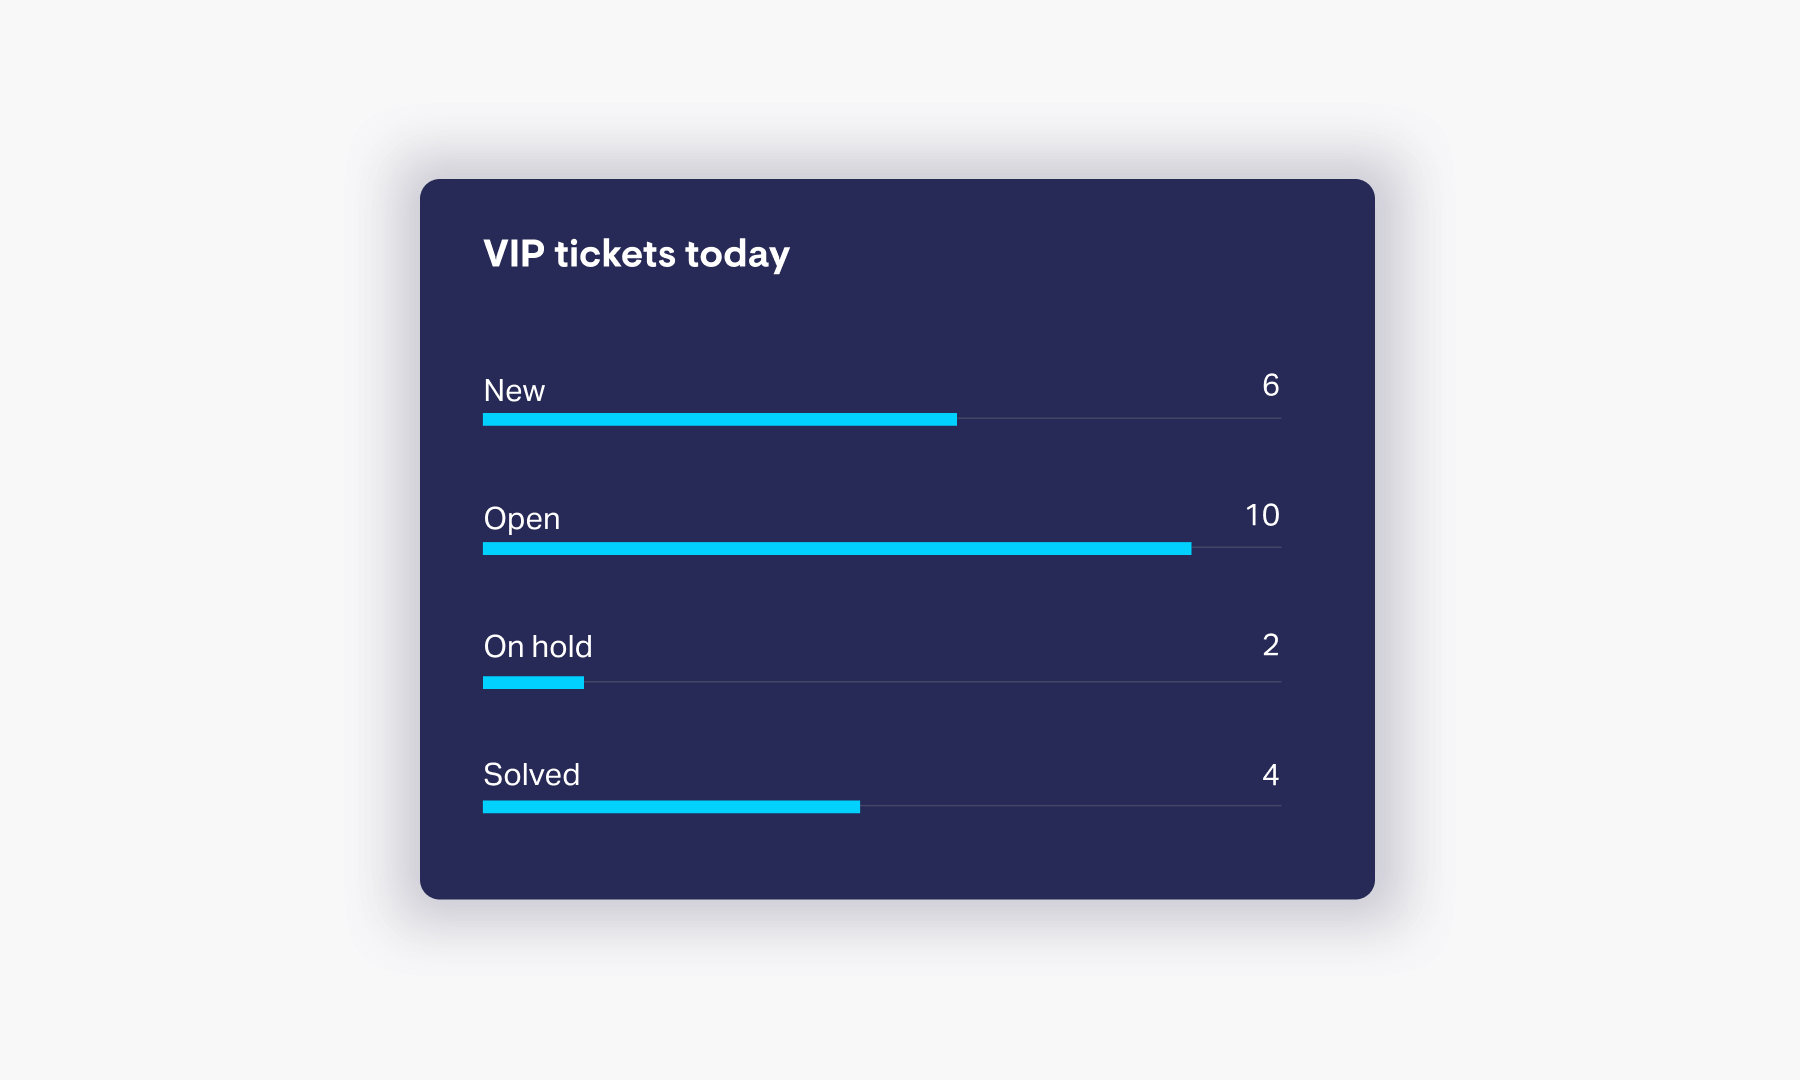
VIP tickets
A variation of tickets nearing SLA breach, is to tag and monitor ‘VIP tickets’, that come from high-value customers. Our own VP of Customer Success, Luis, recently wrote about how to use triggers in Zendesk to apply a ‘vip’ tag, and the benefits of monitoring occurrences of this tag in real time are much the same: more effective prioritization from the team, and better service for your best customers.
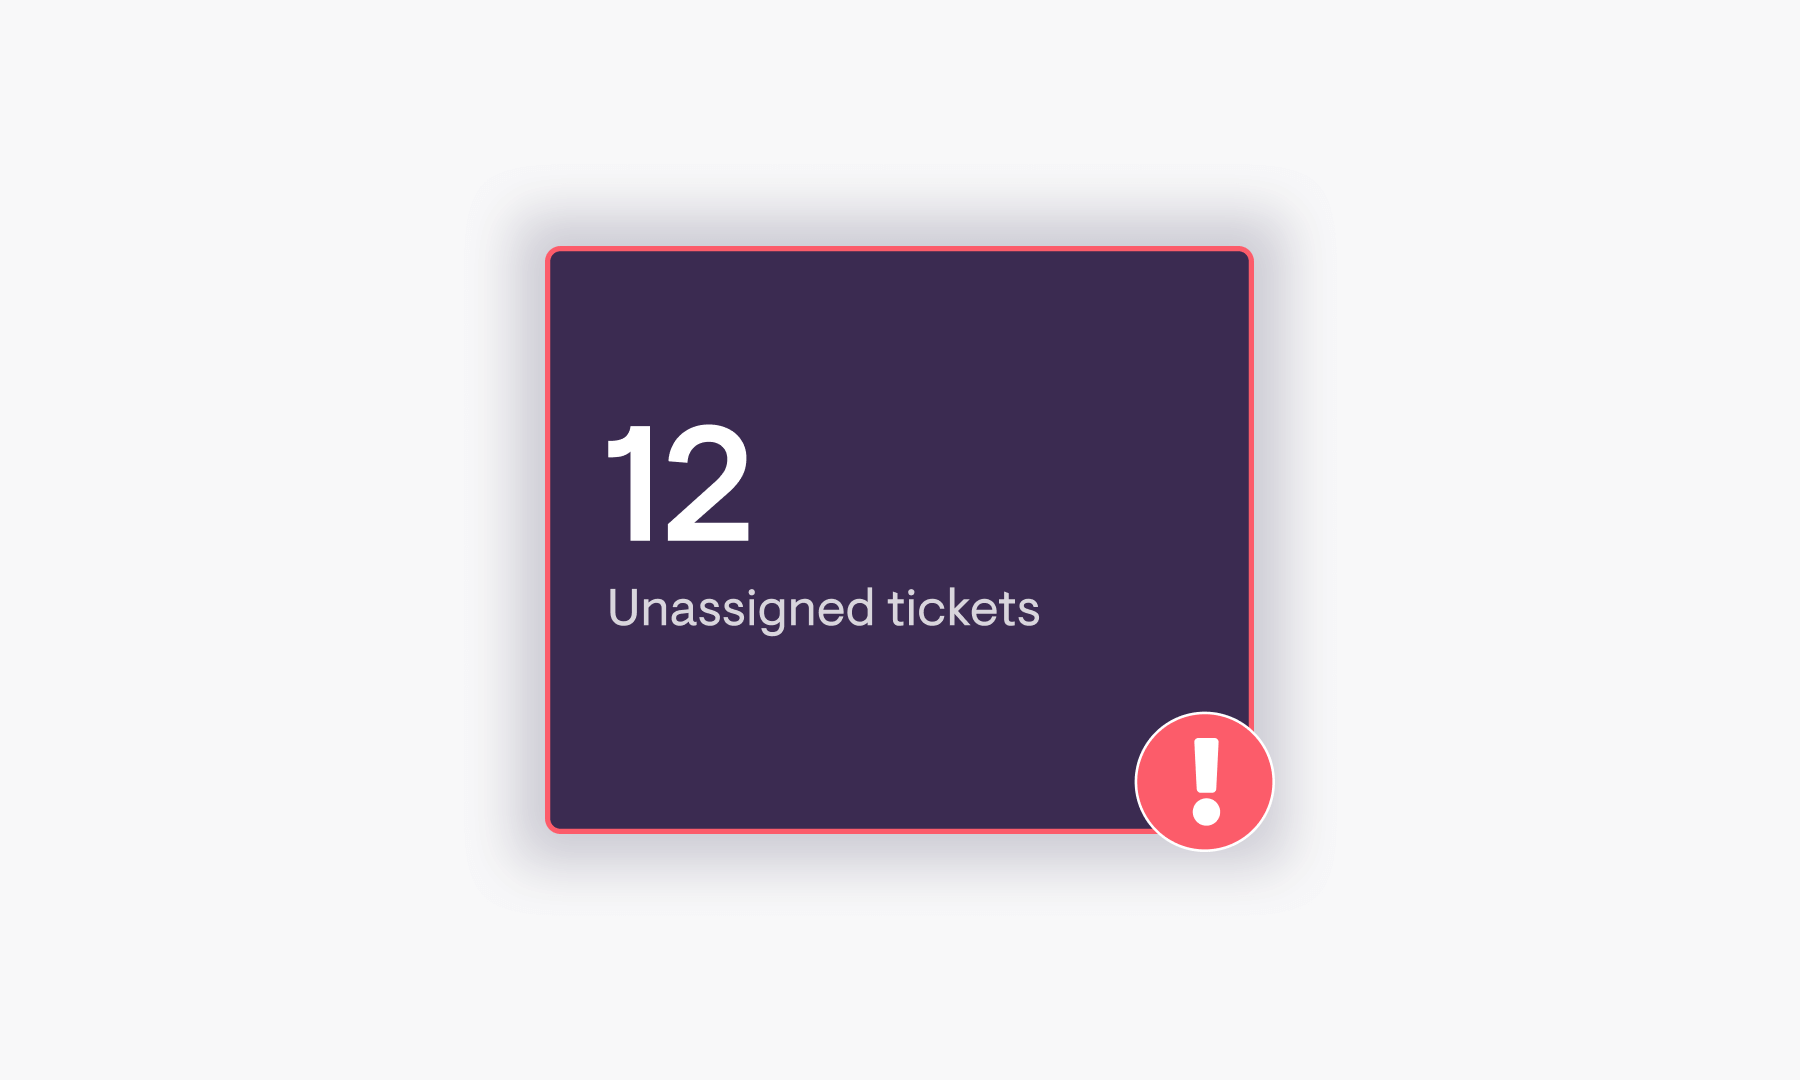
Unassigned tickets
Unassigned tickets is unique in this list, in that only makes sense to track in real time. After all, it’s pretty useless seeing this at the end of the month when your customers might have been left hanging all that time!
Having an up-to-the minute view of unassigned tickets gives everyone the ability to see instantly if there’s an opportunity for agents to swoop in and pick up a ticket in a timely fashion, keep first response times low, and make sure no ticket get missed.
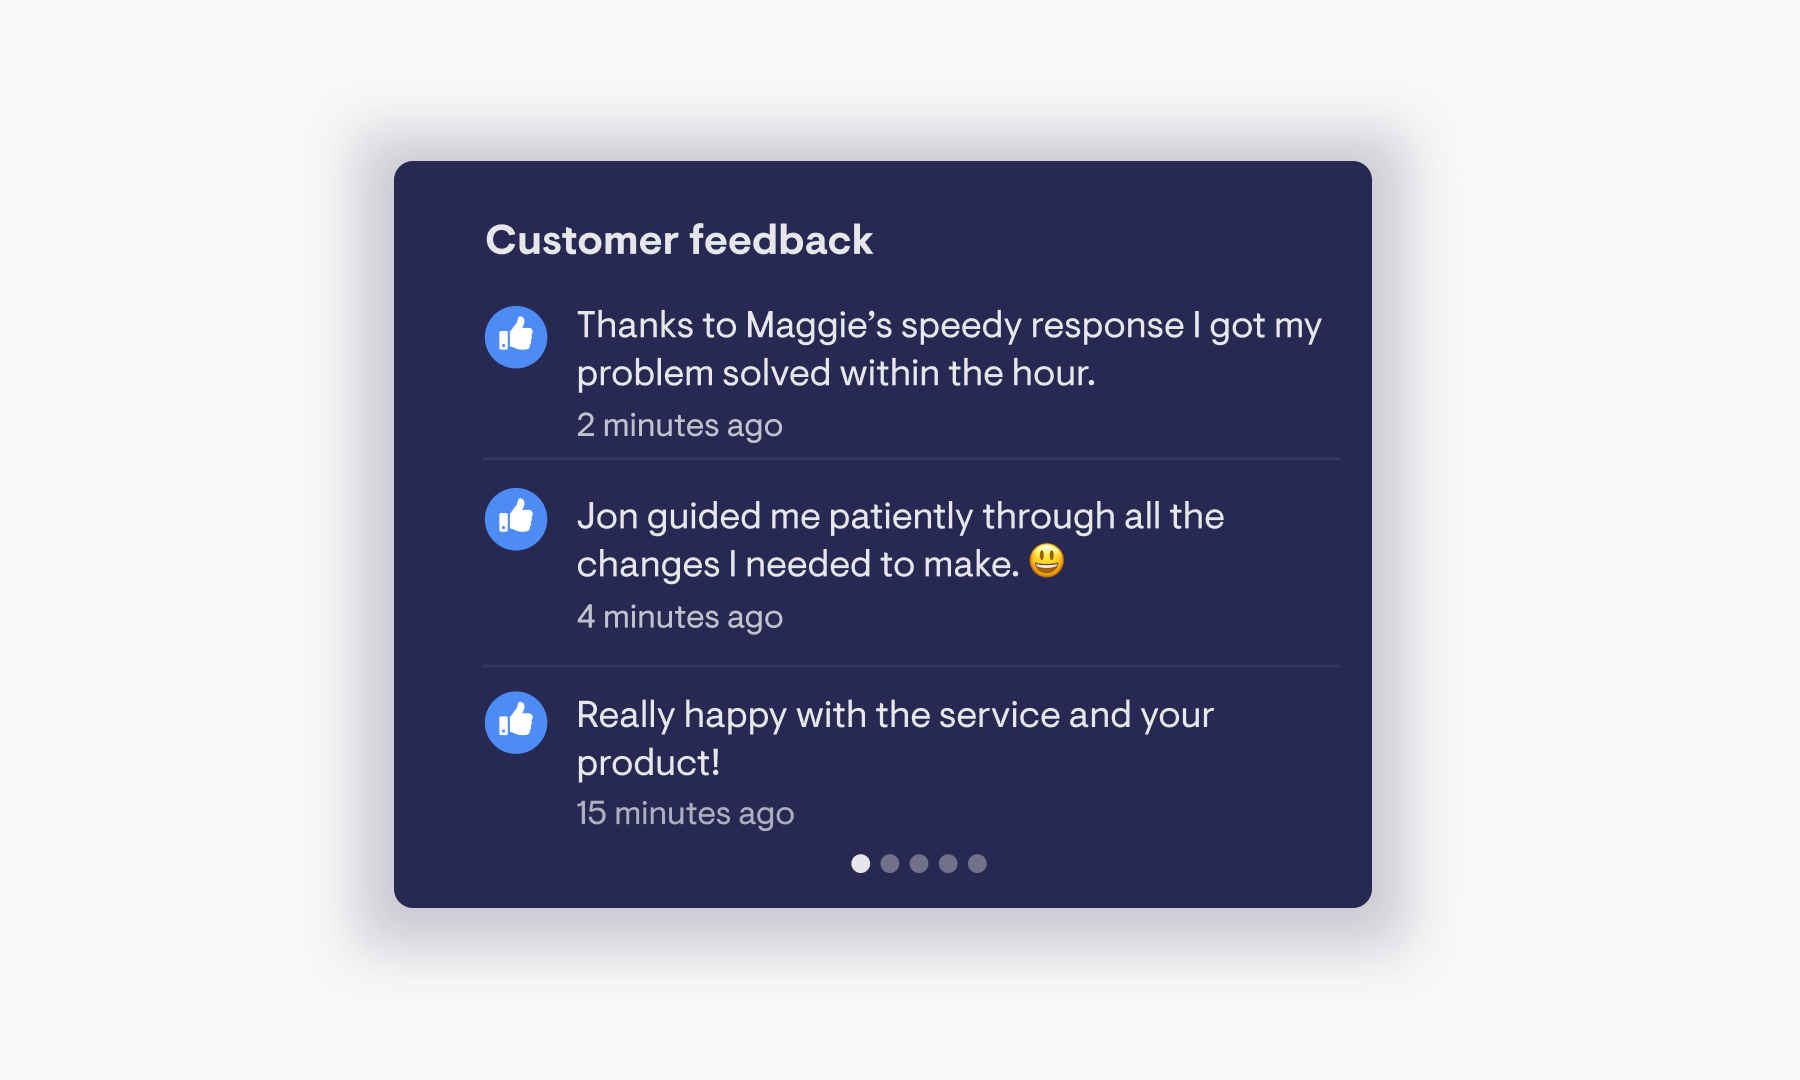
Customer feedback
Customer feedback isn’t a metric per se, but it's still a potent piece of information when monitored in real time, providing team leads and agents alike with qualitative feedback to reflect on.
When that feedback is positive, it’s a great way to surface and acknowledge the efforts of the team or a specific agent. There’s nothing quite like seeing some kind words of thanks pop up on a TV dashboard, a few minutes after solving a tricky issue, for driving that feel good factor.
Equally, though it might be challenging to see them, negative comments can serve as an early warning system of sorts, showing the team areas that could be improved or even flagging wider issues with your product or service as they pop up.
“When we receive negative feedback, we’ll jump in and look at the details. That’s great for helping agents learn and improve.”
James Billet, Customer Experience Manager at Jigsaw
Share real time Zendesk data for less
If this article has inspired you to start monitoring some (or all) of the metrics mentioned here in real time, then try Geckoboard out using this link for a free 14 day trial. Just connect your Zendesk account, and you’ll be able to build and share custom real-time dashboards within a few minutes.
The best part? Plans start at just $79/month if you choose to continue after your trial. Depending on your Zendesk plan and number of agents, that’s a saving of hundreds of dollars per month vs. upgrading to access the fastest version of Zendesk Explore.
Sign up to Geckoboard here, or check out our reviews on the Zendesk marketplace!
