
In business, we use summary metrics all the time.
A summary metric is just another way of saying you have summarized a series of data into a single data point – like a total or an average. Most of the time, when you report on business KPIs like Revenue, Customer Satisfaction, Acquisition Cost, or Lifetime Value, you’re doing so in the form of a summary metric.
But summary metrics can be misleading, because they reduce complex patterns in your data down to simple, singular figures. As a result, you can miss important trends that are only ever revealed when you graph your data in the form of a data visualization.
Ancombe’s Quartet
Perhaps the most famous example of how summary metrics can be misleading was proposed by the British statistician, Frank Anscombe.
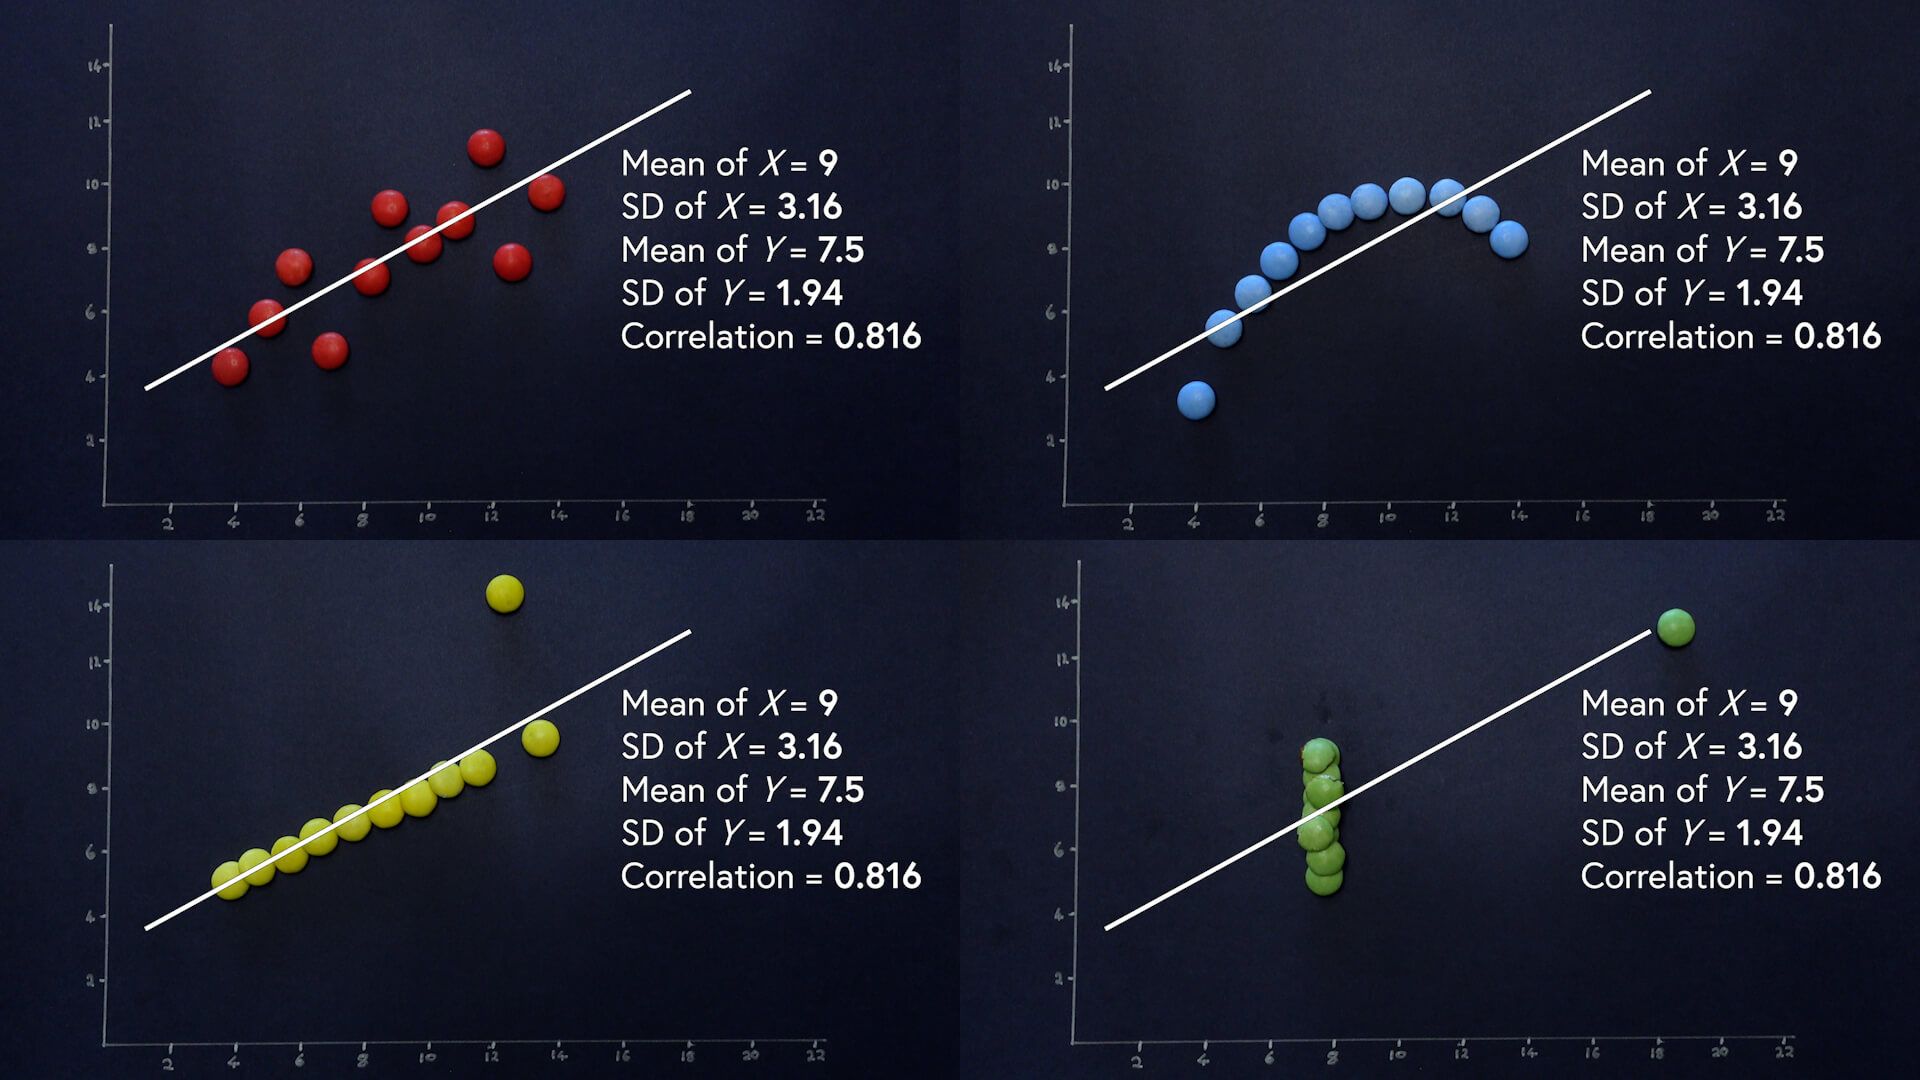
Anscombe’s Quartet shows how four entirely different data sets can be reduced down to the same summary metrics.
Here are the data sets from Anscombe’s Quartet – both as raw data, and plotted on a chart:
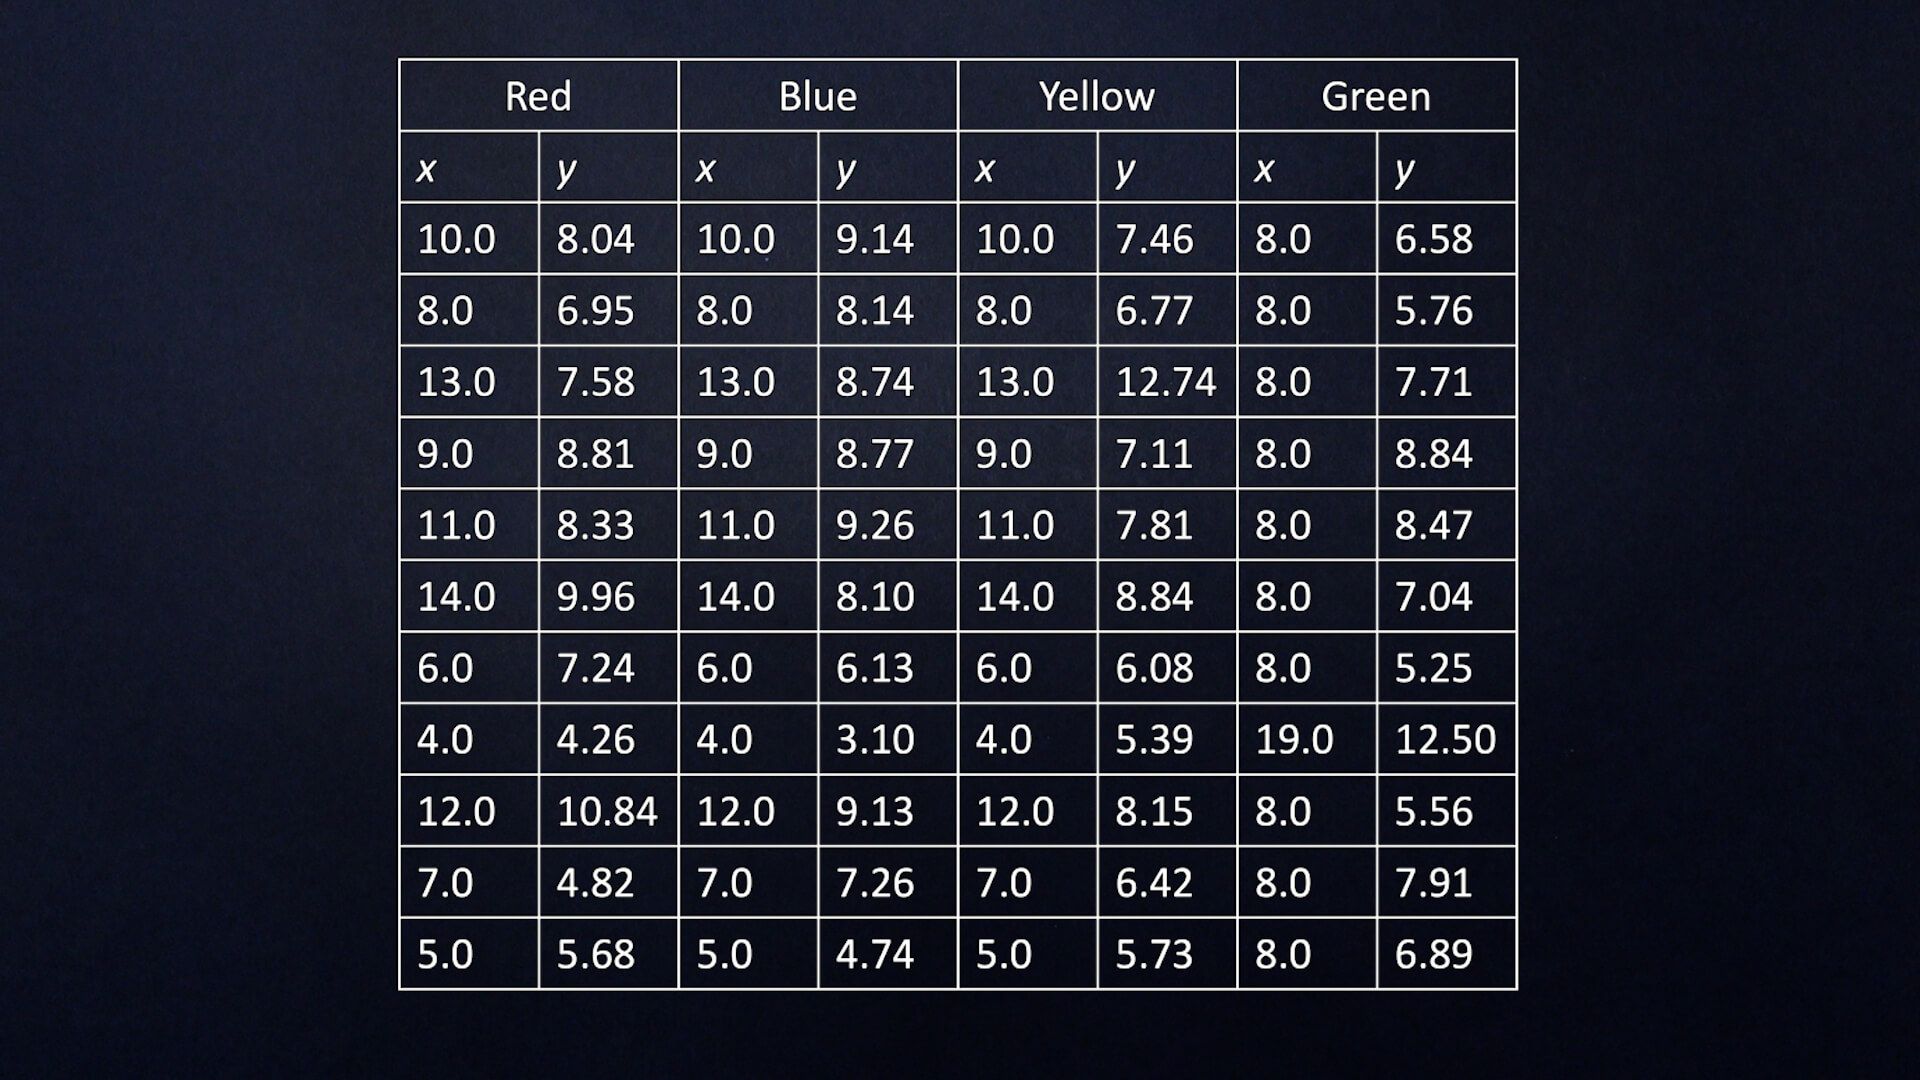

You can tell just by looking that these data sets are very different. However, each data set is practically identical when you calculate the following summary metrics:
- Mean of X = 9
- Standard deviation of X = 3.16
- Mean of Y = 7.5
- Standard deviation of Y = 1.94
- Correlation between X & Y= 0.816
- The linear regression (the line of best fit) is also the same
So what does this all mean for your business reporting?
Well, it means that if you don’t want to miss important trends, you need to visualize your data and break it down.
Monthly Recurring Revenue (MRR)
Here’s an example from a dashboard, which visualizes a SaaS company's Monthly Recurring Revenue Change (MRR Change).
MRR Change simply indicates whether your MRR has increased or decreased that month. It’s a great metric for companies who are tracking continuous growth.
The problem with MRR Change (and indeed, with MRR in general) is that it summarizes (and simplifies) a lot of complicated revenue changes across hundreds, if not thousands, of accounts.
In most SaaS businesses, MRR is not just about new customers and cancellations, it’s also about plan changes (including upgrades and downgrades) and reactivations of old accounts. By breaking down the metric and visualizing it with a data dashboard, a business leader can see more clearly what is driving their MRR change.
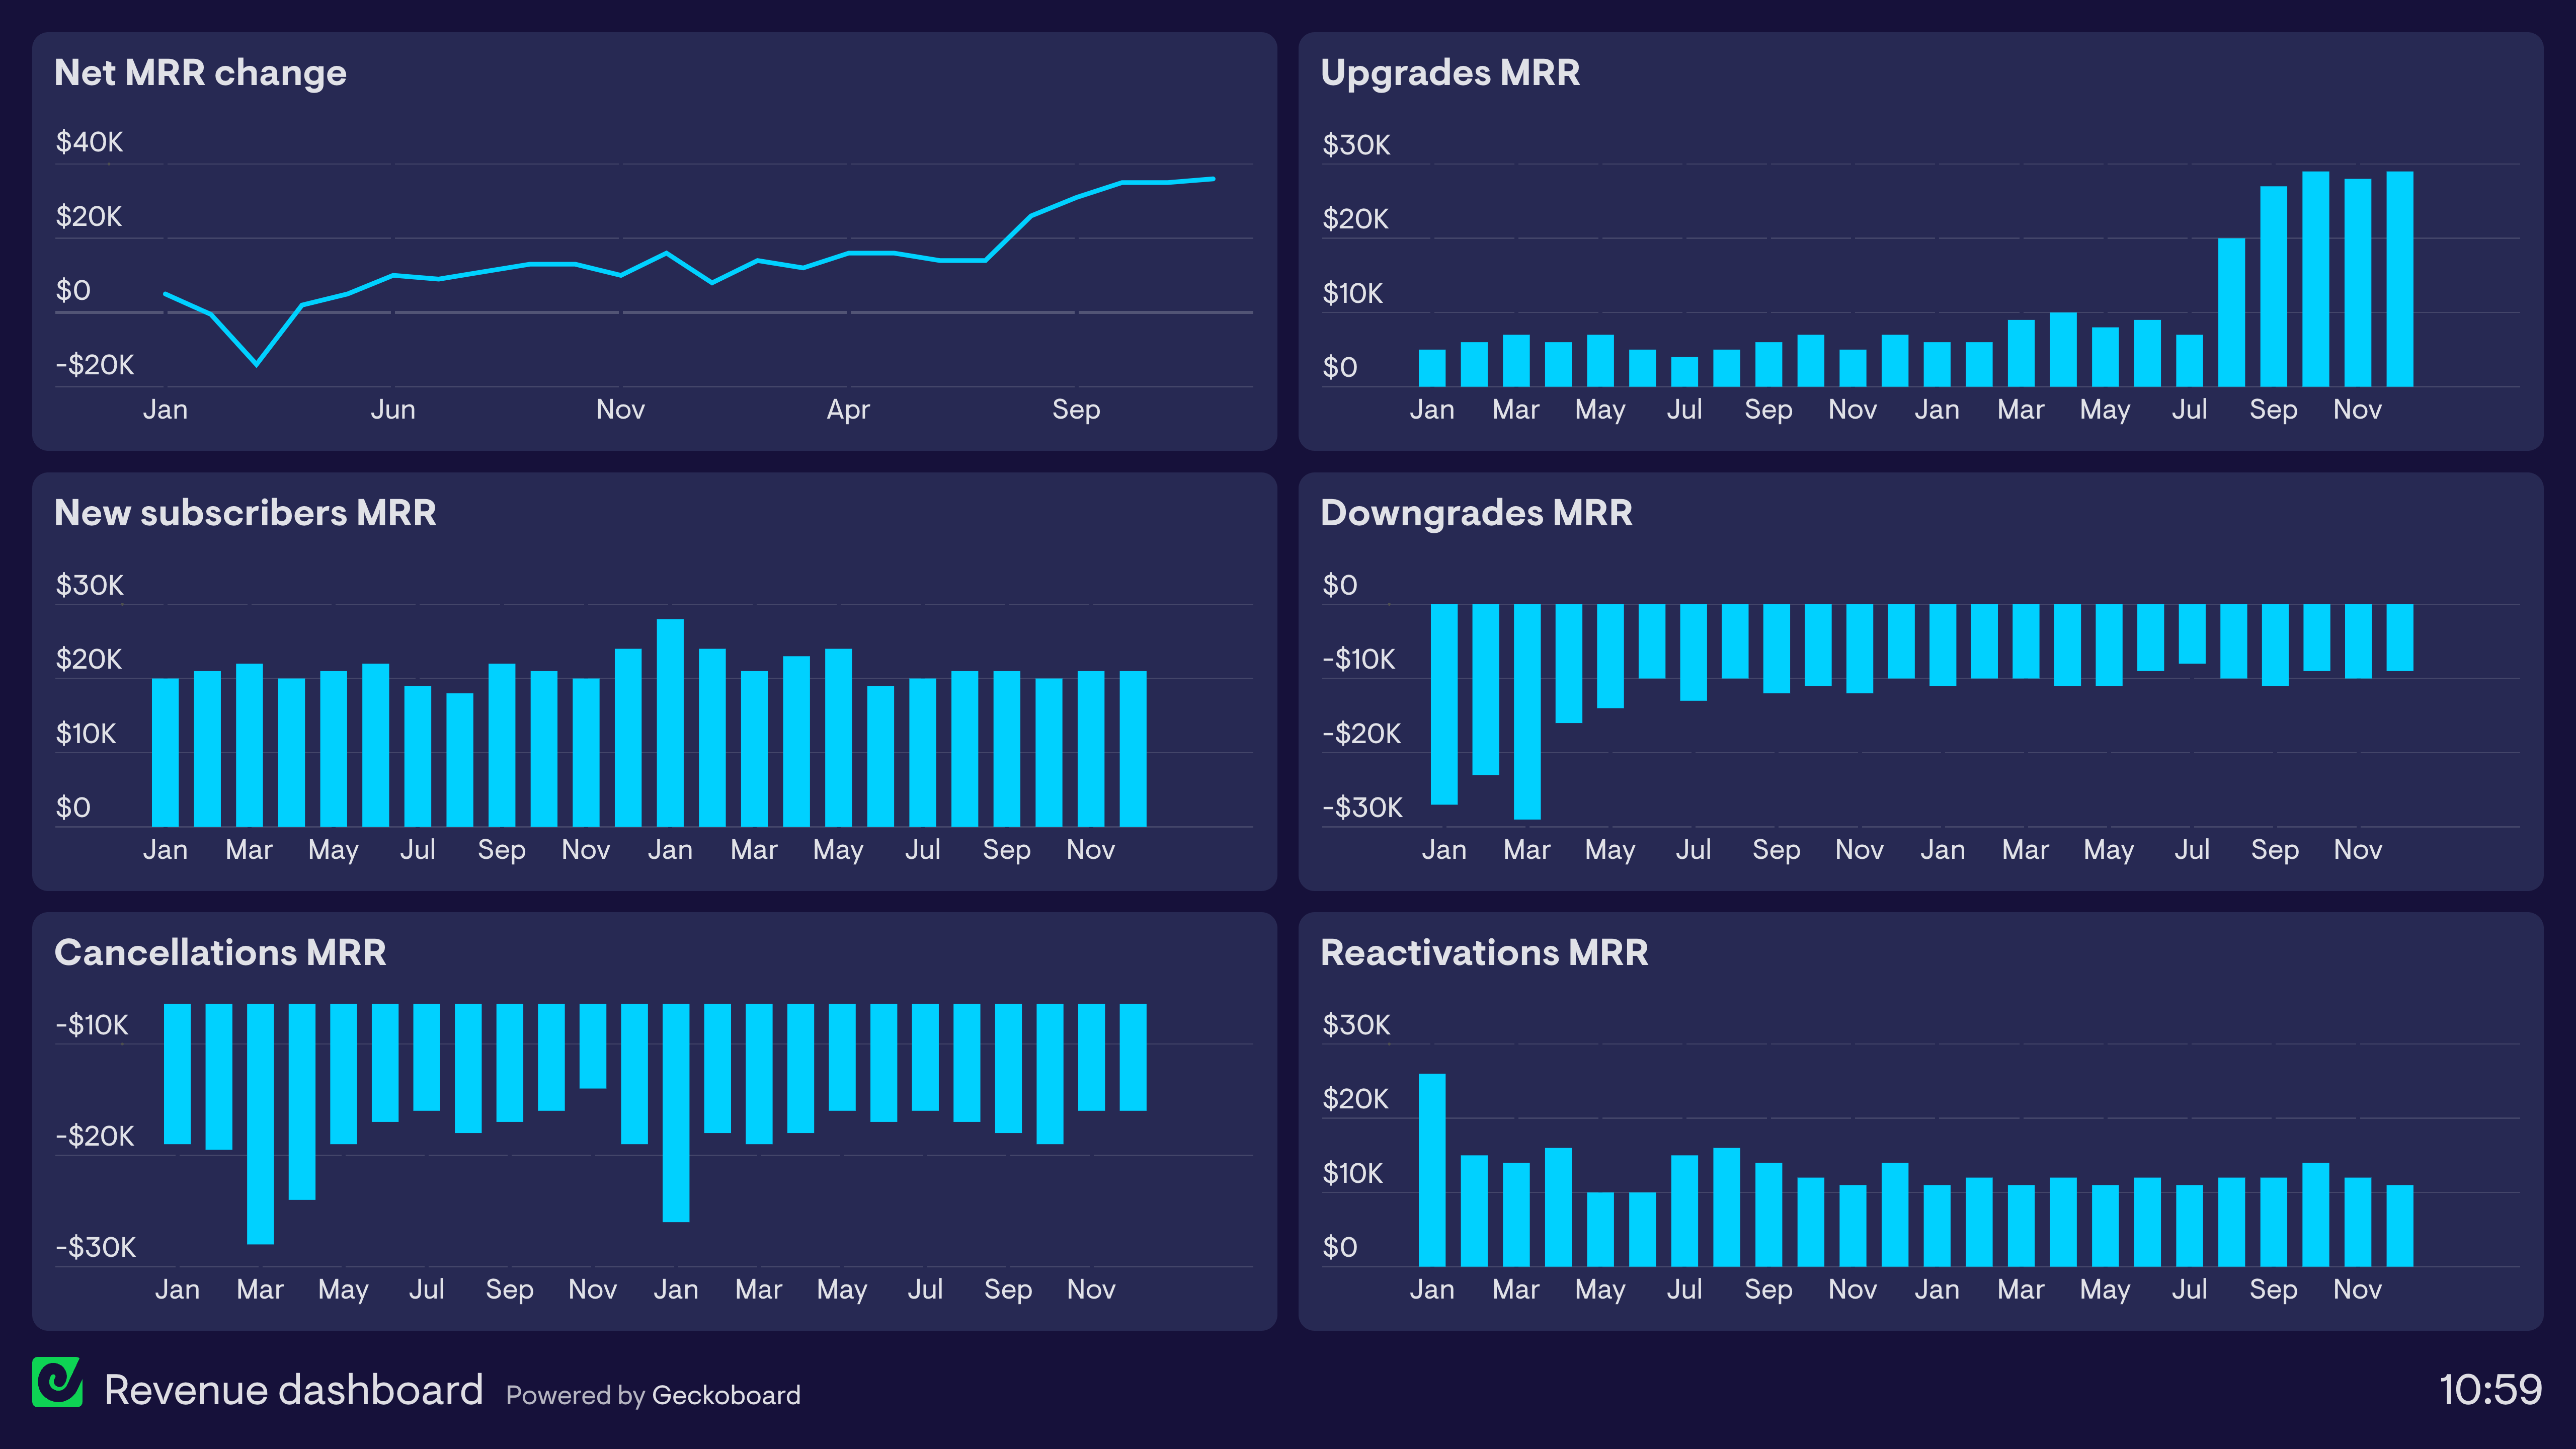
In this case, the recent uptick in revenue has not been driven by new customers as many might have assumed, but by a notable increase in MRR from account upgrades. (Sometimes referred to as Expansion MRR).
First Response Time
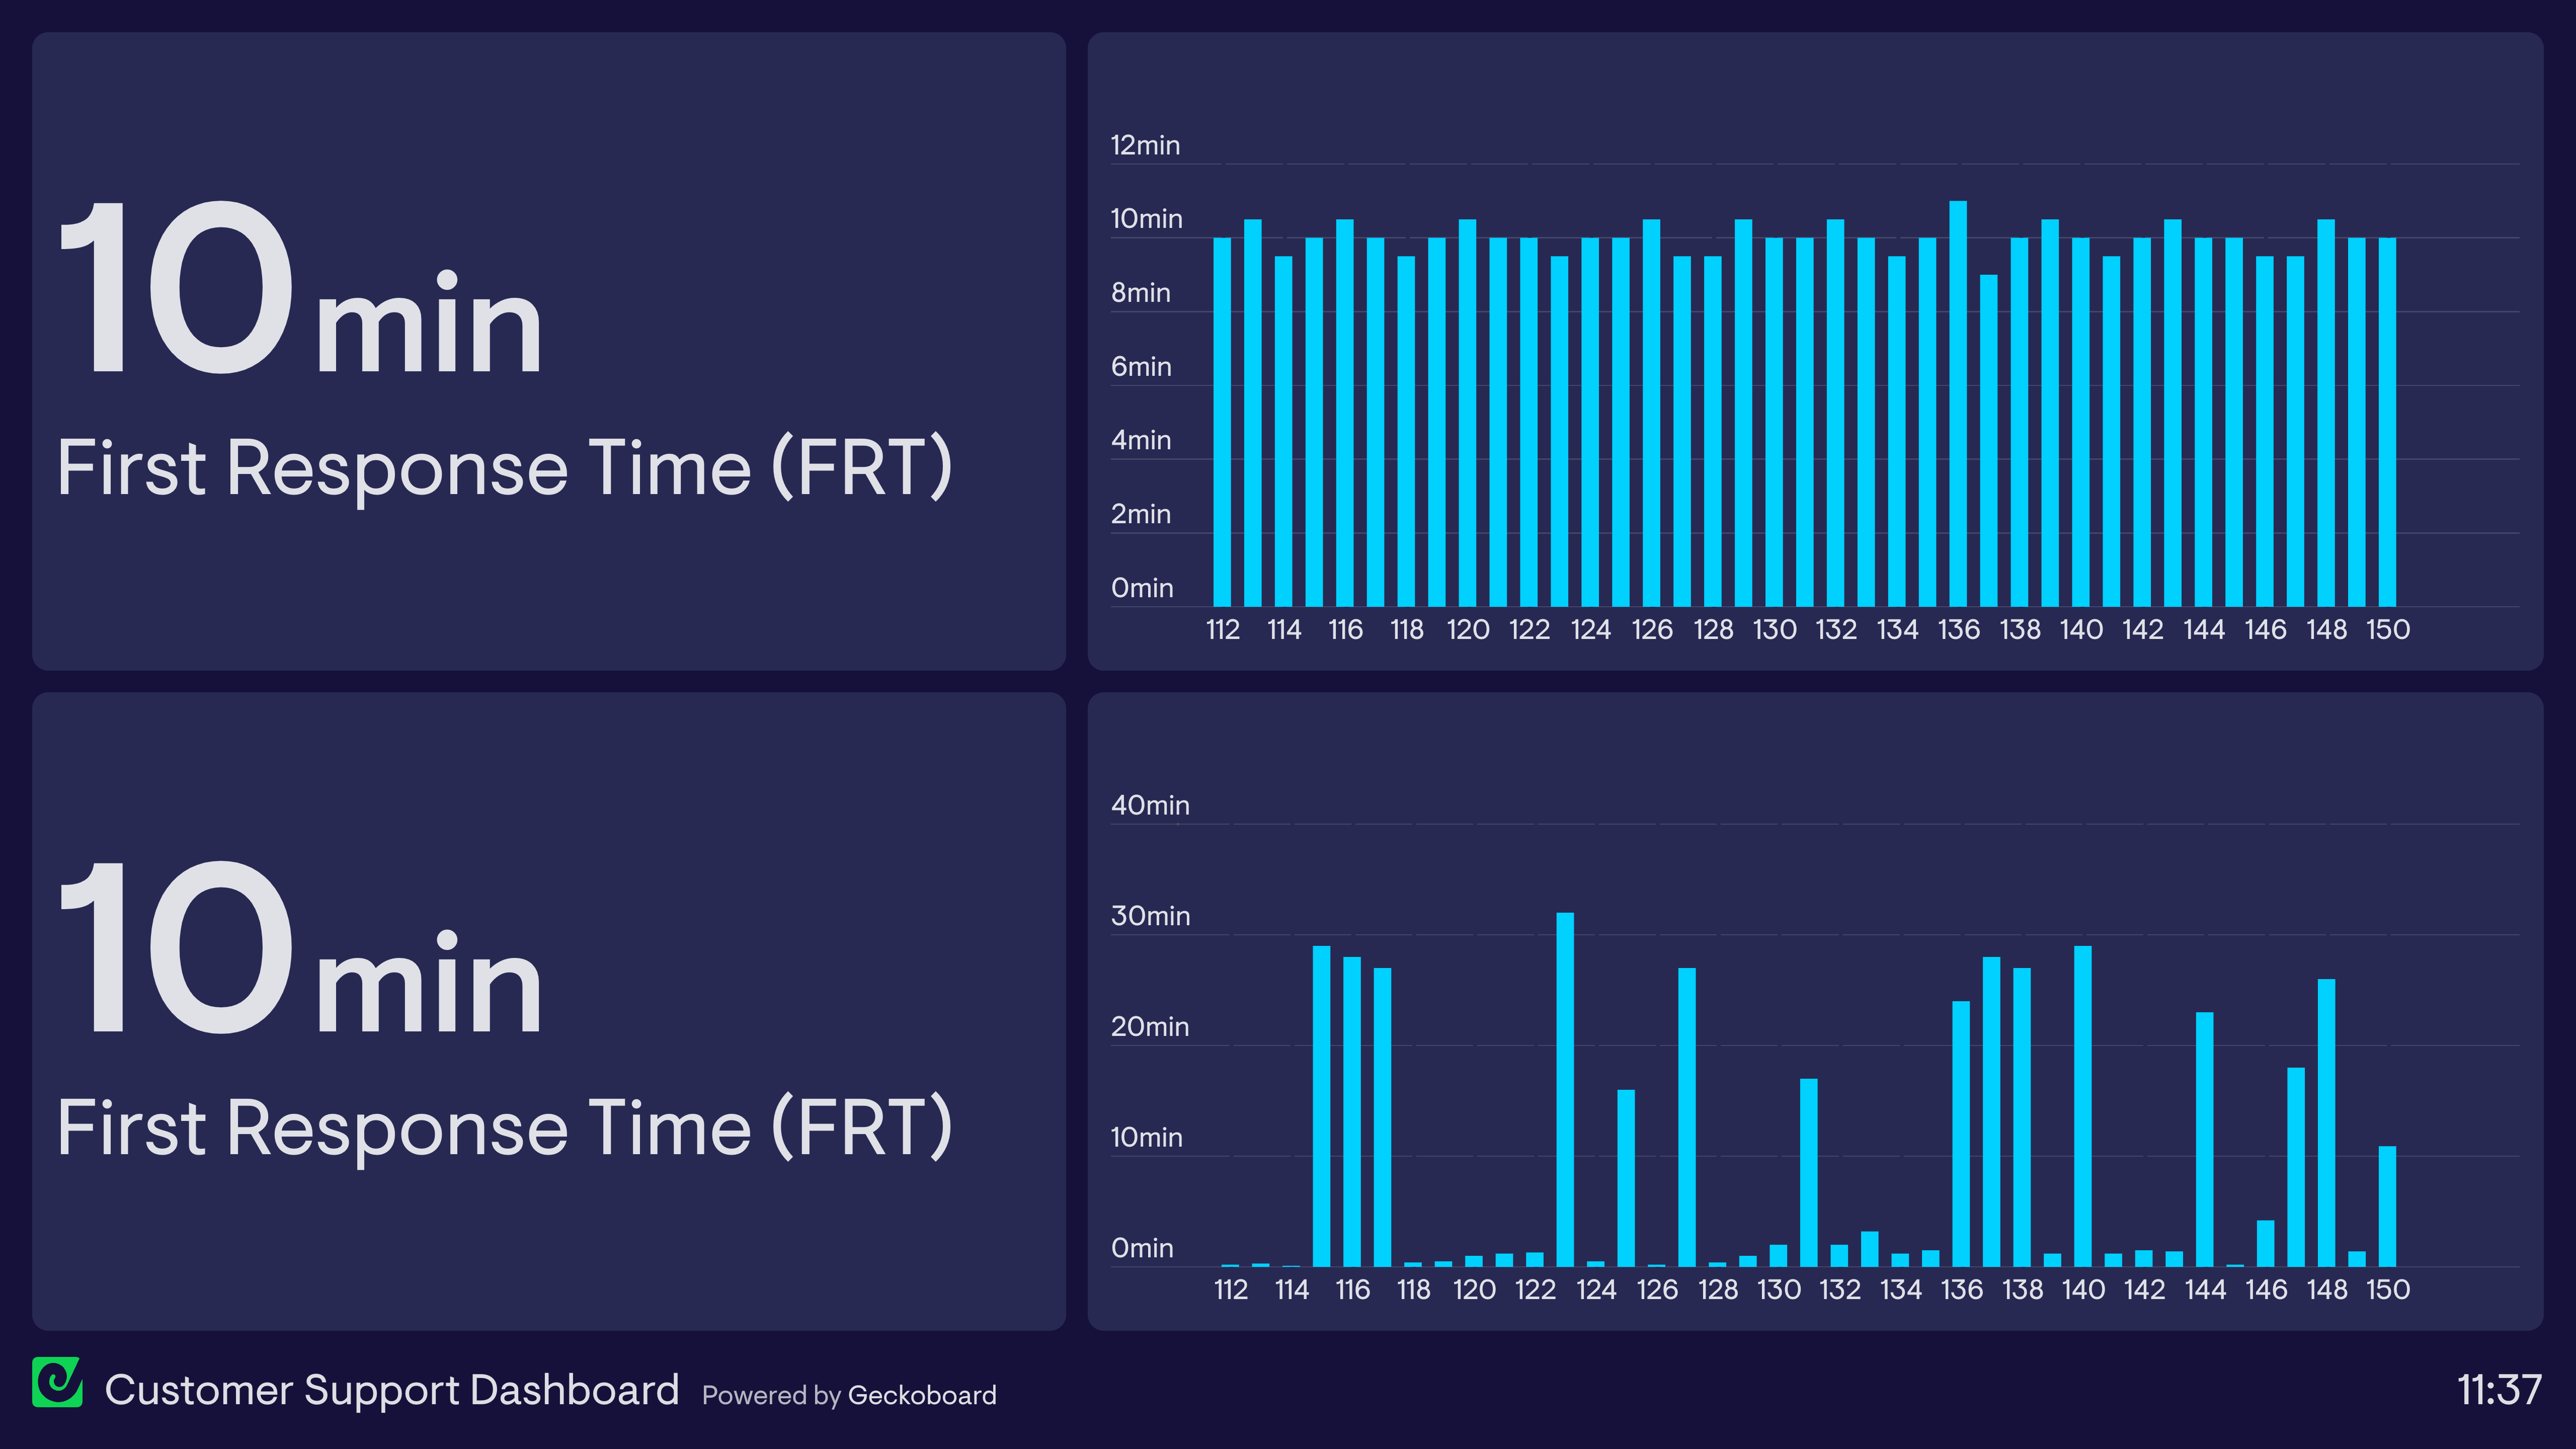
Another common example of a misleading summary metric is First Response Time (FRT).
FRT is a crucial KPI for customer support teams because it indicates how long customers are waiting to be connected to an agent.
However, FRT is an average, which means it can gloss over important trends.
For example, an FRT of 10 minutes could mean that every call is being answered in 10 minutes flat. Or it could mean that some of your customers are receiving responses in seconds, and some are waiting for a very long time indeed.
This is highlighted by the dashboard below. Both data sets average out at an FRT of 10 minutes, even though the first data set does not have a single call waiting longer than 11 minutes, where the second data set has many individual customers waiting between 20 and 30 minutes.
Conclusion
Summary metrics can provide a helpful snapshot of business performance, but they can also mislead. The best way to see what’s going on with your business KPIs is to visualize them, so you have a clearer picture of how and why your metrics are changing.
If you’re looking for an easy way to visualize your data in real time, check out Geckoboard. Geckoboard integrates with over 80 different data sources, and makes it easy to build live KPI dashboards.
