
You want to grow and strengthen your company, but you can’t do that if all of your important data is buried in spreadsheets or held by dozens of different people across the organization.
Uncover key information with an executive dashboard. This display provides an overview of your most essential company metrics on a single screen, so you can easily get the insights you need to make crucial decisions. No more wasting time digging through different reports.
We’ve picked out eight of the most important metrics that company leaders should track on their dashboards to monitor key business objectives.
1. Monthly recurring revenue
Who should track: SaaS and subscription companies
Monthly recurring revenue (MRR) is the amount of revenue that your company expects to receive each month:
MRR = Average revenue per customer * total number of active customers
It's one of the most important metrics for subscription businesses, which must track MRR to predict cash flow and understand their company's financial health.
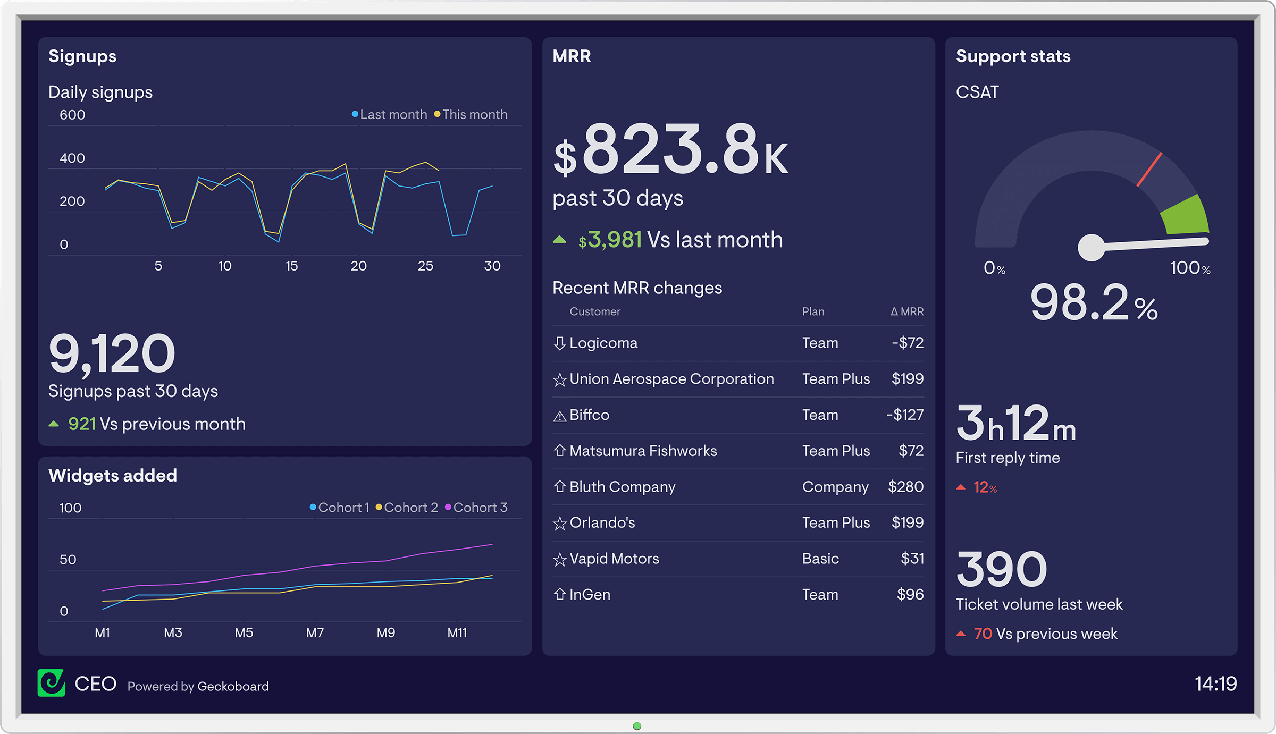
This example CEO dashboard in Geckoboard puts MRR right at the center. It shows how it’s changed over time to give the CEO additional context.
Venture-backed companies (or those looking to raise a round of funding) need to show investors reliable evidence of growth. MRR is one clear indicator of future revenue, so you will want to put this front and center on your dashboard. Because MRR is relatively stable, leadership teams can use this metric to build out financial forecasts based on predicted growth rates, so you can make plans for the future of your business.
On your executive dashboard, you could track MRR as a single metric to get an overview of your monthly revenue, or you could split it into categories to see how different areas of the business are performing:
- MRR gained from new customers
- MRR gained from upsells and account expansions
- MRR lost through customer churn
- MRR lost from downgrades and account contractions
You could also add a comparison against the previous month so you can track MRR growth over time.
2. Gross MRR churn rate
Who should track: SaaS and subscription companies
Gross MRR churn rate is the percentage of total monthly recurring revenue lost from customers that canceled or paused their contracts. It lets you see the financial impact of lost customers and downgrades on the company.
Gross MRR churn rate (%) = (Total amount of lost revenue / MRR at the start of the month) * 100
If you track net MRR churn (which is your gross MRR churn offset by any additional revenue gained from account upgrades and expansion) instead of gross churn, you might be accidentally sugar-coating your churn metrics and getting a false impression of your current performance. By looking at gross MRR churn, you can’t soften the blow by offsetting some of your churn with expansion revenue. Track gross churn on your executive dashboard to give yourself a clear idea of how many customers are leaving your business.
Need a primer on calculating churn? We’ve got an in-depth article on MRR churn rate.
3. Revenue per customer
Who should track: All companies
Revenue per customer is the average amount of revenue you generate from each customer. It helps you put a dollar value on your customers, averaged out across different order values and price points. Tracking this over time will help you understand if you’re generating more or less revenue from each customer, so you can predict revenue growth based on customer volume.
While there are many different ways to grow your business, many companies look to grow by moving upmarket and targeting bigger accounts. In this case, revenue per customer is an essential metric for your executive dashboard. Over time, you’ll see if you’re increasing or decreasing revenue per customer. If it’s increasing, that suggests you’re successfully attracting higher-value accounts, seeing more customer upgrades, or generating more repeat orders – all great signs of customer loyalty and business growth.
Every company can divide total revenue by the number of customers to track this metric, but you may want to vary how you track this figure based on the nature of your business.
- Ecommerce and transactional companies: Track average order value to understand how much customers spend when they make a purchase on your website. It’s a better measure than revenue per customer because customers may put in multiple orders in a month. Additionally, increasing average order value is one of the most effective ways for ecommerce companies to grow their revenue because they won’t incur additional transaction costs like they would if they generated more orders.
- SaaS or subscription companies: Track average revenue per account (ARPA) to understand on average how much revenue you generate per customer account. Subscription customers normally pay the same amount each month, so there’s less variance than with ecommerce companies.
Keep in mind, significant outliers (like one bulk order or one new enterprise account) can significantly skew revenue per customer, but it’s still a useful metric to track on your dashboard.
4. Burn rate
Who should track: Startups
Burn rate is how much money your startup spends in a month:
Burn rate = Total cash at the start of the month - Total cash at the end of the month
You should include all money spent when calculating burn rate – even one-off expenses such as a laptop for a new hire or replacing broken office furniture. Otherwise, you won’t have an accurate picture of your startup’s financial position.
By tracking burn rate on your executive dashboard, startup executives can keep a close eye on their expenditures and spot potential financial problems, such as increased operating costs or a hefty one-off expense.
Burn rate and cash runway (see the next section) go hand-in-hand. If one month you see a sudden spike in your burn rate, you know that’ll shorten your cash runway unless you’re able to cut costs or quickly bring in more revenue.
5. Cash runway
Who should track: Startups
Cash runway measures how long your money will last based on your current rate of expenditure:
Cash runway (months) = Cash balance ($) / Monthly burn rate (S)
The golden rule of startups is never to run out of money. For startup founders, cash runway is a metric you should know by heart. If you don’t track this figure, you could end up with the nasty surprise of not being able to meet financial obligations –like making payroll for employees.
Tracking cash runway on your dashboard will help you stay on track. You’ll know when you need to start your next funding round, increase revenue through more aggressive sales tactics, cut unnecessary spending, or even make layoffs.
6. Customer retention over time
Who should track: SaaS and subscription businesses
Subscription companies’ growth depends on their ability to retain customers. If you’re losing lots of customers each month, you need to replace the same quantity of customers just to maintain your monthly revenue, but if you can retain the majority of your customers, then the bulk of your new customers will bring in new revenue each month.
Gauge the health of your subscription business by tracking customer retention on your executive dashboard. You’ll be able to see at a glance how the metric is changing, so you can identify any warning signs before they become apparent.
A sudden drop in retention is a major cause for concern that you’ll need to investigate. Was there a product or pricing update that triggered a bunch of customers to cancel their subscriptions? A slow, gradual decline in retention is also concerning but less noticeable.
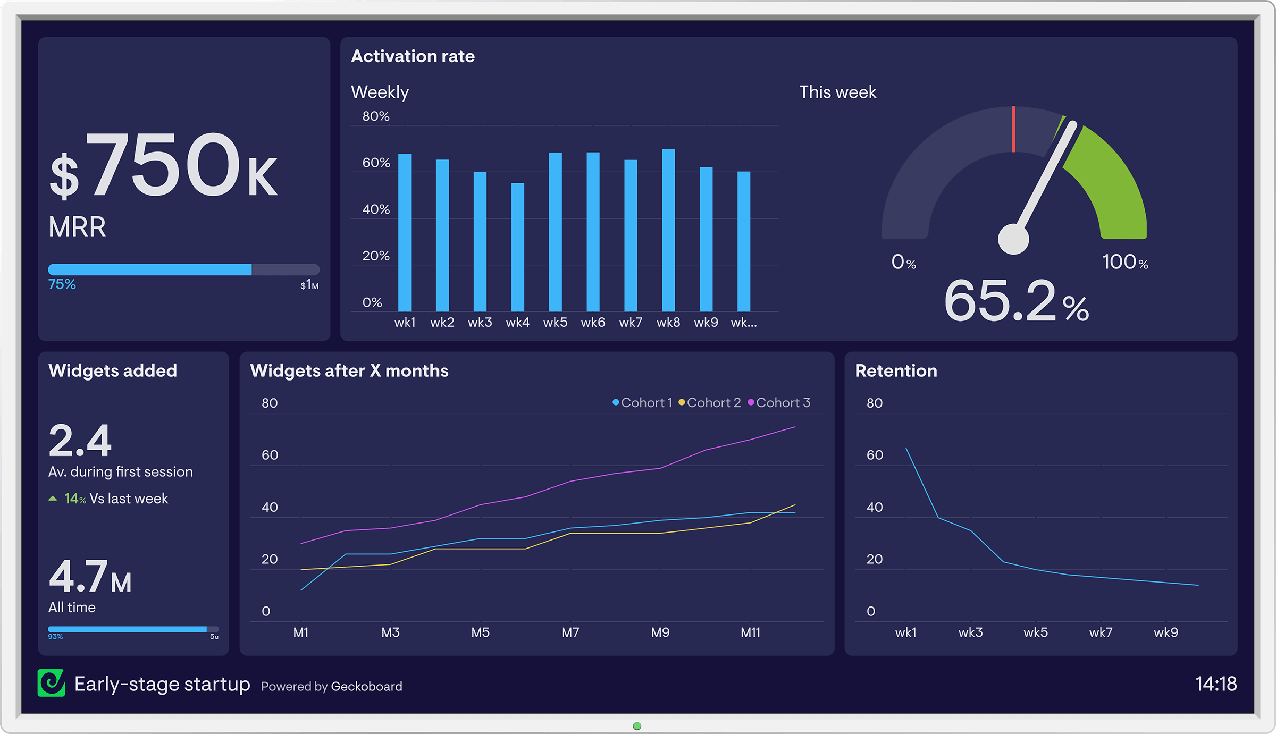
This early-stage startup dashboard in Geckoboard shows how customer retention drops over time.
Alternatively, you could track customer churn rate over time to see the percentage of customers lost in a given period. This will give you the same information but from the opposite view, looking at customers lost rather than customers retained.
7. Number of customers
Who should track: All companies
This metric is pretty straightforward: it’s how many customers you have. Tracking this number over time will help you see whether you’re gaining or losing customers overall.
Number of customers may seem like a bit of a vanity metric, but it's a good pulse check to see whether you're successfully growing your customer base. You should also consider context when tracking customers in absolute numbers. If you’ve recently raised your prices, then a stable or even declining customer number may not be a cause for concern.
Track the number of customers to see an easy-to-understand snapshot of your company's performance.
8. Customer satisfaction (CSAT) score
Who should track: All companies
CSAT is the percentage of customer satisfaction survey responses you receive that are positive:
CSAT (%) = (Number of positive responses / Total number of responses) * 100
Your customer service team sends customers a short survey after a support interaction asking them to rate the help they received. This is commonly a rating scale from 1-5 or good to poor, and it tells you how satisfied your customers are with the service they received.
Our Customer Support Experience Report found that CSAT was the most important metric for 48% of the support teams we surveyed.
If you consider yourself a customer-centric company, providing high-quality service shouldn’t only be a focus for your support team. Tracking your CSAT score on your executive dashboard shows that customer satisfaction is a top priority for you as the CEO and, therefore, the rest of the business. It elevates your customers' needs alongside your big picture company metrics and keeps your customers front of mind when making crucial business decisions.
Create an executive dashboard that helps you make your best decisions
An executive dashboard’s design should make it easy to see your company’s most important metrics. When designing your dashboard, less is more: a cluttered dashboard is difficult to read because you’ll be seeing so many graphs and numbers that you can’t spot what’s important and what’s not.
Be selective with the metrics you choose so that you’re only tracking the most important KPIs on your executive dashboard. This will help you get the insights you need at a glance. Download our dashboard design guide to learn the best practices for creating a dashboard that shows you all the information you need in a clear and easy-to-understand format.
