Logan Grooms, Director of Customer Care at Maisonette, talks us through how he’s improved efficiency and helped everyone understand the impact his team has on the business using Geckoboard. Having become a Geckoboard expert whilst consulting, he also shares his thoughts on where Geckoboard fits in around other dashboard tools, and some of the metrics Maisonette tracks to deliver a truly great customer experience.
Can you tell us a bit about yourself?
I'm the Director of Customer Care at Maisonette, a New York based online store that brings your favourite luxury and independent children’s brands into one place. I run a Customer Care team that will grow to around 30 people by the end of 2020. We're expanding tremendously, and we expect to double that head count within the next year. In the longer term we want to open an office out West so that we have Customer Care agents covering our two biggest markets.
I started off in the tech industry in Southern California (Qualcomm, Cisco) before becoming a customer experience consultant and improving customer experiences across a whole range of industries.
Later I joined Wayfair, one of the world’s largest online furniture retailers, in a senior customer care role, before joining Maisonette as Director of Customer Care, where I’ve been for almost exactly a year.
How did you first come to use Geckoboard dashboards?
I first found Geckoboard when I was consulting. I found it was the easiest way to be able to connect my client’s systems and visualize key metrics. Whether it was up on a TV screen (as we have them displayed at Maisonette) or sent out in a sharing link, I found it was a great way to show people what’s going on.
At the time I was frequently setting my clients up with Zendesk, and one common request I got was to find a way for agents (and everyone else in the business) to easily see how they were doing, and to see how the customer care department in general was doing.
After looking at many different data visualization tools, I found Geckoboard to be by far the easiest solution to quickly pull together a single view of live metrics like number of people in the queue, number of open tickets, and CSAT score, and then share that across the business with a single link. It was so easy to set up using the built in data sources - it would take me around 30 minutes to build one for a client, and I could then just give them the keys to run it. It’s easy to use and my clients loved it.
When I finished consulting, I took Geckoboard with me!
How did you get your clients to buy into the idea of a dashboard?
I focused on the front line agent experience. I got a lot of feedback that a lot of agents wanted to know how well they were doing, what impact their role is having and how the department is doing overall. Using Geckoboard, we were able to show them when they needed to take action and jump on the phones or answer tickets, and to show that CSAT had changed and as a result of their actions.
From the front line agents it then trickles up to the managers, who want to see that information all in one spot, rather than having to dig around in multiple platforms. They are able to share one link with all that information with more senior team members, and the information keeps going up the business.
That is what became the most valuable thing. The fact that I could send you a single link, and it has everything you care about in one place.
Another approach, if I still needed to convince somebody to invest in TVs and dashboards in their contact center, was to point to their engineering team, who would often have several dashboards up showing live information from the systems they’re maintaining. If they could see if things are operating OK or need attention at a glance, shouldn’t those on the front line caring for customers also be able to see information they need to maintain their system?
If you enter the engineering department it is plastered with TV screens showing data. I'd say ‘look at the engineering team, they have a bunch of dashboards up, they’re tracking the data they need to see, they know immediately if part of the site is down’. Drawing that parallel for people made it easy to show how valuable being able to access live data could be.
I have used Looker and Tableau which are both great tools if you want to build out a suite of complex dashboards, but that’s not what I needed. My goal was to quickly share the core information our clients needed to see every day, without them having to become an expert at using a new tool.
Talk us through setting up your dashboard at Maisonette
I got the dashboard set up at Maisonette within three weeks of starting the role. I had joined the company specifically to help build and scale the customer care operation (there were only four agents when I started). Almost right away I made it a priority to put TVs up in the office - not just in the space my team was using, but in other areas of the office too - as I wanted everyone to be able to see what was happening with our team, and to understand that we were critically under-resourced. Geckoboard wasn't a big investment that I needed to make a case for - we simply got the TVs in a Black Friday sale and we repurposed some Mac Minis that were lying around.
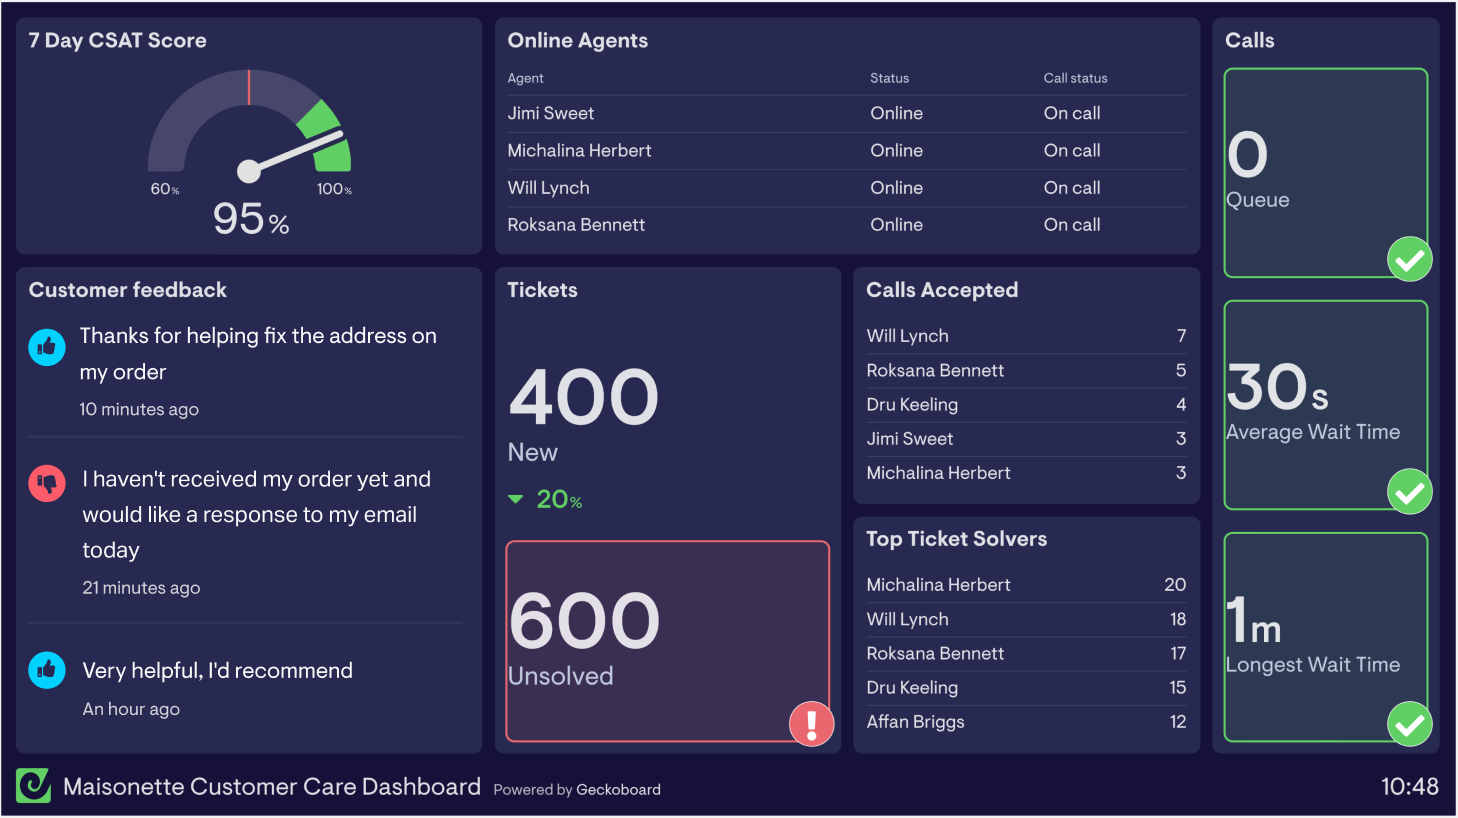
This went hand-in-hand with the implementation of a CSAT program. One of the advantages of having Geckoboard set up was that we could visualize CSAT and related information on our screens. If someone received a negative CSAT they could see it within a few minutes and see the impact on our overall CSAT score.

What made dashboards a success for the Customer Care team?
The fact that people could walk around the office and see what was happening within Customer Care, whether they were in the team or not.
Agents love it because they can see everything they need in one place. Before this agents had access to Zendesk but couldn’t always easily see things like the phone queue. There's a big advantage to being able to just sit at your desk, look up and see the exact number of people in the queue right now, and knowing when to jump on to help.
The rest of the company love it too because they simply didn't know what was going on in the Customer Care team before we had our dashboards up. It opens people's eyes to see that the team works so hard and gives visibility to the work they do throughout the organisation. I would say this is as important, if not more important than the agents seeing the dashboards themselves.
How did more visibility for the Customer Care team change things at Maisonette?
Before I joined there were assumptions about whether the Customer Care team was overstaffed or understaffed. A lot of people thought that the department was overstaffed because at the time, the way they were working was not efficient.
As I started visualizing what was going on with our dashboard, other departments could begin to see that four people couldn’t possibly handle 300 phone calls. It gave others outside of our department secondary context, it’s not just coming from a conversation with me.
How has your team been working since the Covid-19 outbreak?
Since the outbreak we have mostly been working remotely. One of our managers goes into the office, but otherwise the rest of the team works from home. We have sent the dashboard out as a sharing link and most of our agents have dual monitors with the dashboard on one screen.
What are your most important metrics?
Each department has OKRs but one of the biggest focuses throughout the whole company is improving Contacts Per Order, which is a useful indicator of how efficiently we’re performing in the Customer care team, and the company as a whole. We used to get 300 calls a day, but why? At that time we weren’t focused on first contact resolution but it was also affected by other teams and departments who could have been contributing towards creating a more successful experience for our customer.
Focusing on improving this metric has shown a way we can dramatically save costs within our department and for the business as a whole.
Finally, what other ecommerce metrics does Maisonette track?
We look at Average Order Value (AOV), daily sales, highest carts of the day (in case we want to get in touch for VIP treatment), bestsellers, and products selling well on a daily, weekly and monthly basis. We look for trends in terms of sales value and volume.
From the Customer Care perspective we’re tracking contact trends to see if there might be issues with particular products.
We run deeper analysis on a lot of this data and have a data team who pulls together the information we need to see.
It's good to use more complicated tools like Looker to do deeper analysis but Geckoboard is so important on a daily basis. I see it like this; deeper analysis tools are like a semi-truck where you need a team of people to help you get set up. It can do heavy lifting, but it takes a lot of effort. Geckoboard is like my fully equipped pickup truck that I drive every day. It gets everything I need done and it's really quick and easy.
Quickly and easily build a Customer Care dashboard with Geckoboard - no code required. Sign up for a free trial today!
