Martin Stigaard Skammelsen, Head of Marketing and Matchday Experience at Aalborg Håndbold, tells us how he took a whiteboard of daily metrics into a live dashboard that aligns multiple teams around goals that positively impact the whole handball club.
Hi Martin, can you tell us a little about your role and the company you work for?
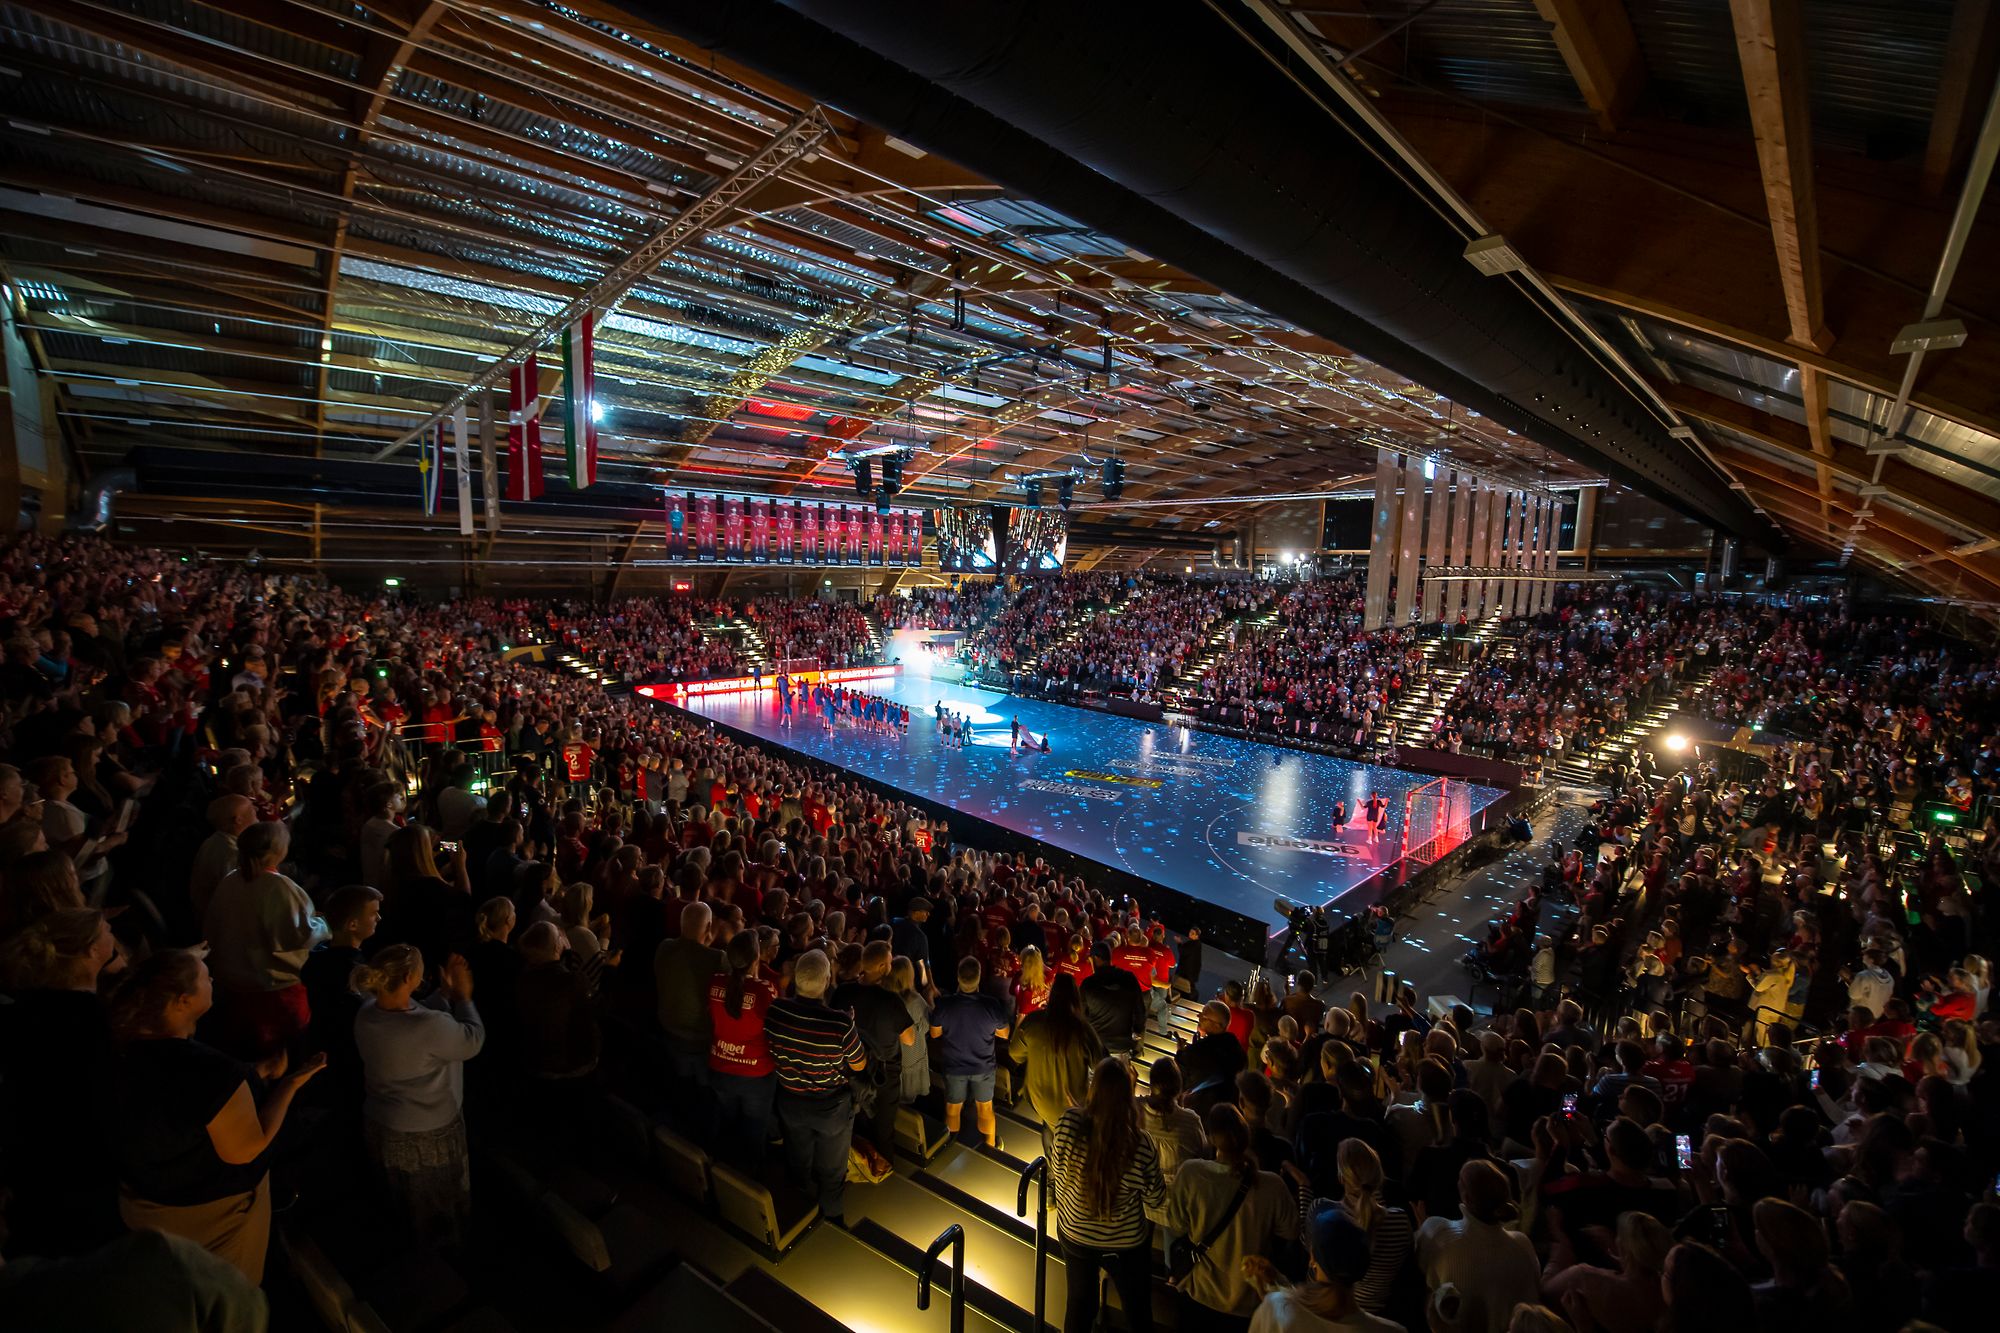
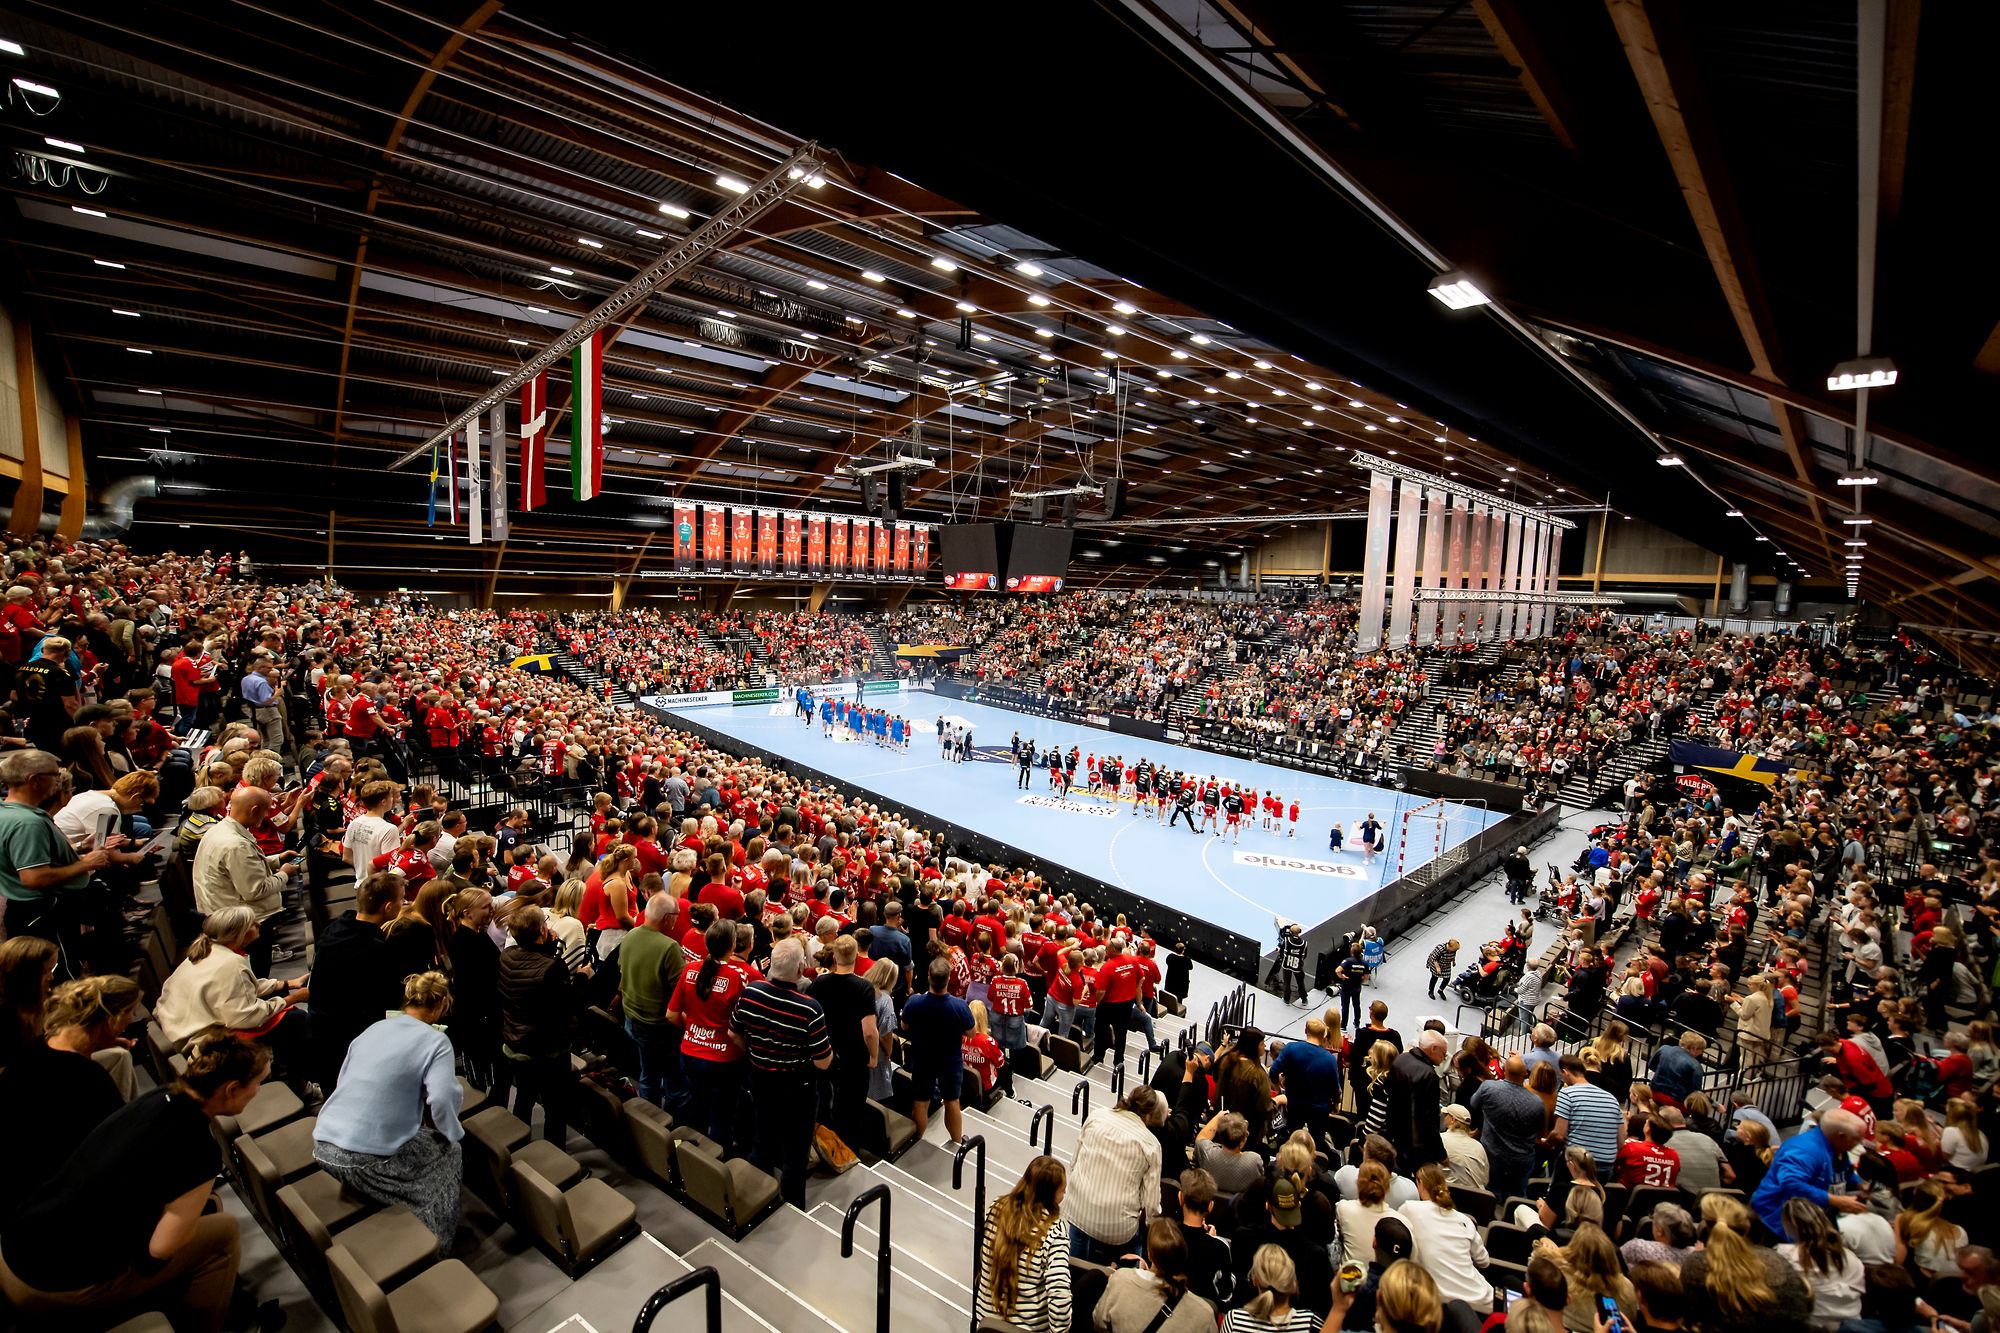
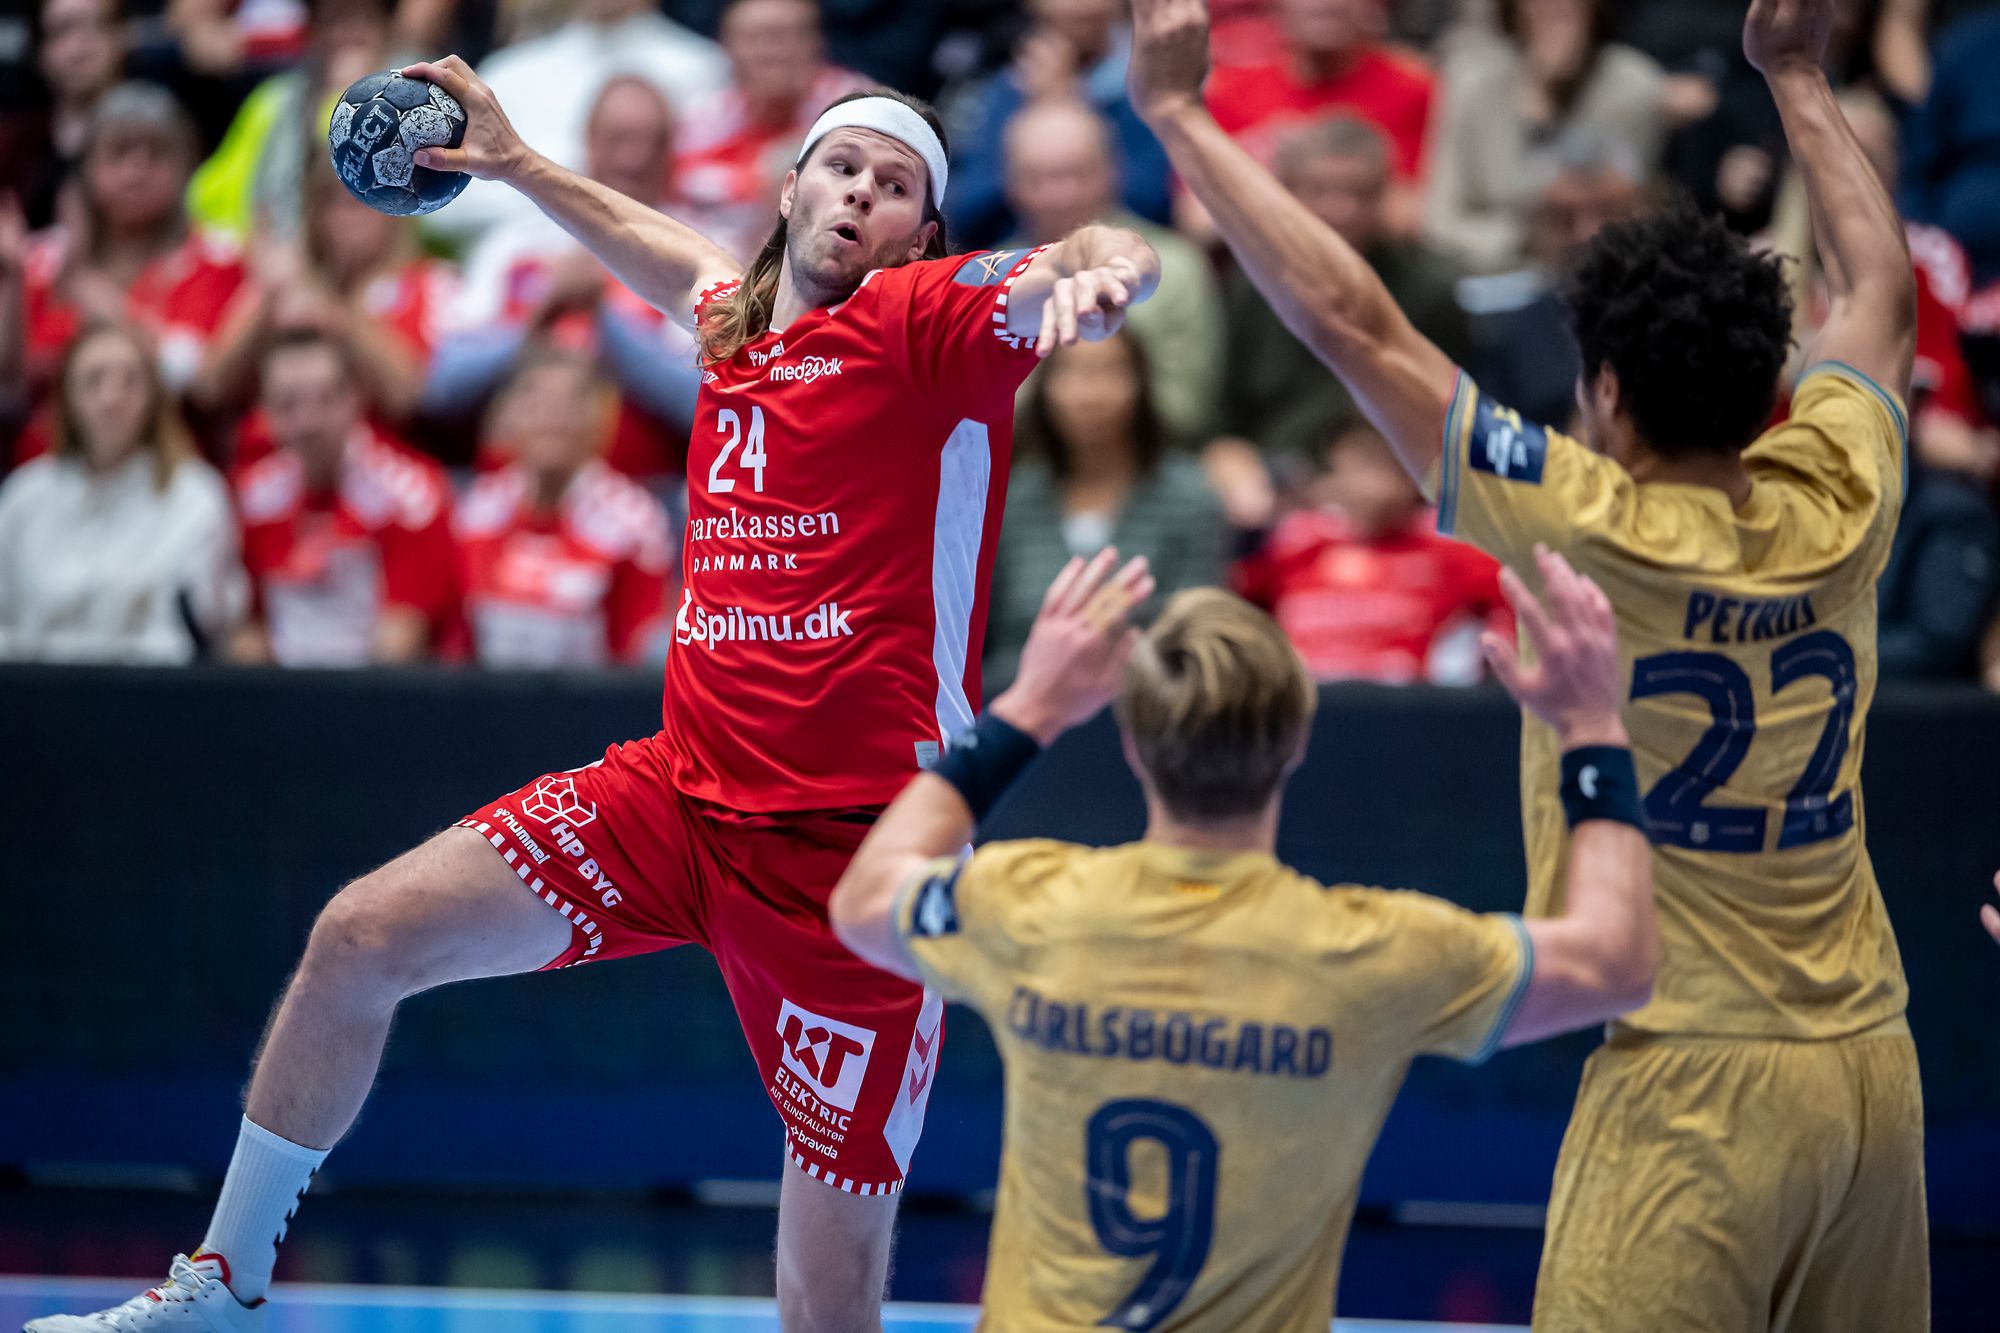
I’m Martin Stigaard Skammelsen and I’m the Head of Marketing and Matchday Experience at Aalborg Håndbold, a professional handball team that competes in the Danish Men's Handball League. If you don’t know much about Handball, we’re one of the top pro Handball teams in the world!
I joined the club around 9 months ago. There were lots of enthusiastic young people in the office, and they were performing well, but often it was within silos. I was brought in to organize things, create more structure, and help the team work towards shared goals. We needed to work out where we wanted to go, and what KPIs we wanted to use.
What caused you to look for a dashboard solution like Geckoboard?
Before I joined Aalborg Håndbold there was a whiteboard up in the office recording social media metrics – team members were updating this manually. As soon as I saw it, I knew we needed a digital, real-time solution. I also noticed people were constantly asking each other questions about data, and knew this was a problem we could solve with a dashboard.
I already knew about Geckoboard from a few years ago when I visited a Danish sports clothing company, they had this neat Geckoboard dashboard up on a screen in their HQ. When I started with the handball club I figured it was the perfect solution to get everyone on the same page with their goals.
Why did you choose Geckoboard?
I had done a free trial with Geckoboard in my previous role (as Head of Marketing for a local Pro football/soccer club) so I knew that it was by far the easiest data visualization tool to replace the manual whiteboard. I spent around 20 minutes in Geckoboard, and within this time I knew I could achieve what I wanted without having to do any work on any integrations or APIs. For me, this was an easy win in the first few weeks of my new role.
Once I’d drafted my first dashboard I shared it with the rest of the team in a meeting - their jaws dropped – they were sold.
Our dashboards quickly became the first thing everyone checks when they arrive at the office each morning.
Tell us about your dashboards
We have three dashboards, one for Sales, one for Marketing, and another with details of the team’s events. The office is within the arena building and has a 70 inch monitor displaying our dashboards on a loop, rotating every 30 seconds.
Our Sales dashboard focuses on sponsorship sales and ticket metrics. We’ve visualized the club sponsorship targets and outlined ticket sales by group (fan tickets, VIPs, visiting fans) for upcoming matches but also ticket usage, to see how many are actually being used at the matches. No one wants to see empty seats at a match! We use this metric to remind our season ticket holders to share their seats if they’re unable to attend.
The Marketing dashboard looks at typical follower metrics for LinkedIn, Instagram, MailChimp and Facebook. The Facebook demographics are particularly useful here, creating awareness of the audience we have here empowers our sales team to go after the right kind of sponsors.
Finally, the team events dashboard covers the upcoming matches, player training plan, and the number of player jerseys sold, as well as overall merchandise sales. The latter was a very commonly asked question so it’s been great to automate this and have the metric visible to everyone. Sharing upcoming matches data allows us to see what the next event is, who’s sponsoring it and what we need to prepare in the arena. The player training plan comes in handy when working with our sponsors.
Have you seen any changes since you implemented your dashboards?
The dashboards have really energized the team and brought departments together under common goals. When Sales see Marketing hitting social media follower goals, they get excited as this has a positive knock-on effect for their sponsorship outreach. The more sponsors we get, the better players we’re able to afford and so on. Everyone wins!
The dashboards have allowed me to break our top-level goals down and visualize these into smaller goals that each team can have a direct impact on. Seeing this, they realize these aren’t just vanity metrics, they are adding value to everyone’s work.
I believe there’s a lot of value to that shared understanding.
We recently hit 50k Instagram followers and in the run up to this milestone everyone was constantly watching the dashboard to see how close we were. It sparked daily conversations as we all eagerly anticipated tipping over the goal.
Any final comments?
Whenever we have the players visit us in the office they’re able to see how many jerseys we’ve sold or how many followers we have and they’re blown away. Their primary focus is on the sport so seeing these metrics is a good eye opener for them to know what we’ve been working on and how we’re helping the club.