
Jesper Rosenkrantz, Head of Support at Capture One talks us through using Geckoboard dashboards to help navigate busier product launch periods and bring visibility to the Support team work throughout the rest of the organization.
Tell us about your role at Capture One
I’m Jesper Rosenkrantz, Head of Support at Capture One. Capture One is a powerful photo editing application. We’re based in Copenhagen, have a Support team of 14 agents and use Zendesk Support as our ticketing system. Our Geckoboard dashboard helps us keep track of whether we are reaching our targets and to share our key support numbers to the company leaders and the rest of the organization.
When did you realise you needed a dashboard?
When I joined Capture One I moved the Support team from using a CRM to Zendesk. Shortly after that I attended the Zendesk Relate event in San Francisco and was hoping to get some insights into their Explore data visualization tool as an option for surfacing metrics for the rest of the team. I was unimpressed with what I saw, but once I returned home I decided to give Explore a go as I wanted to keep everything we were using within Zendesk. Sadly after a couple of weeks trying to get the very simple stuff displayed (with help from the Zendesk Support team) I gave up. For what I wanted it wasn’t a good fit. Aside from being difficult to set up the licensing made it too expensive for us. To give my boss access to our data he would have needed his own Zendesk seat.
Around the same time that I was exploring options for the Support team the company had created a new BI department. With them I explored using Power BI to surface our Zendesk metrics, however as soon as we wanted to move away from the standard templates it became too complicated. I didn’t have the in depth knowledge of Zendesk’s API to get what I needed and the BI team didn’t have time to spare. That’s where Geckoboard came in. It enabled me to build the bespoke dashboard I needed without any coding or costing a fortune.
How would you describe Geckoboard to other Support leaders?
An easy, out of the box dashboard to surface your Zendesk Support metrics for your team and to showcase the work of the Support team to the rest of your organization.
Can you talk us through your dashboard?
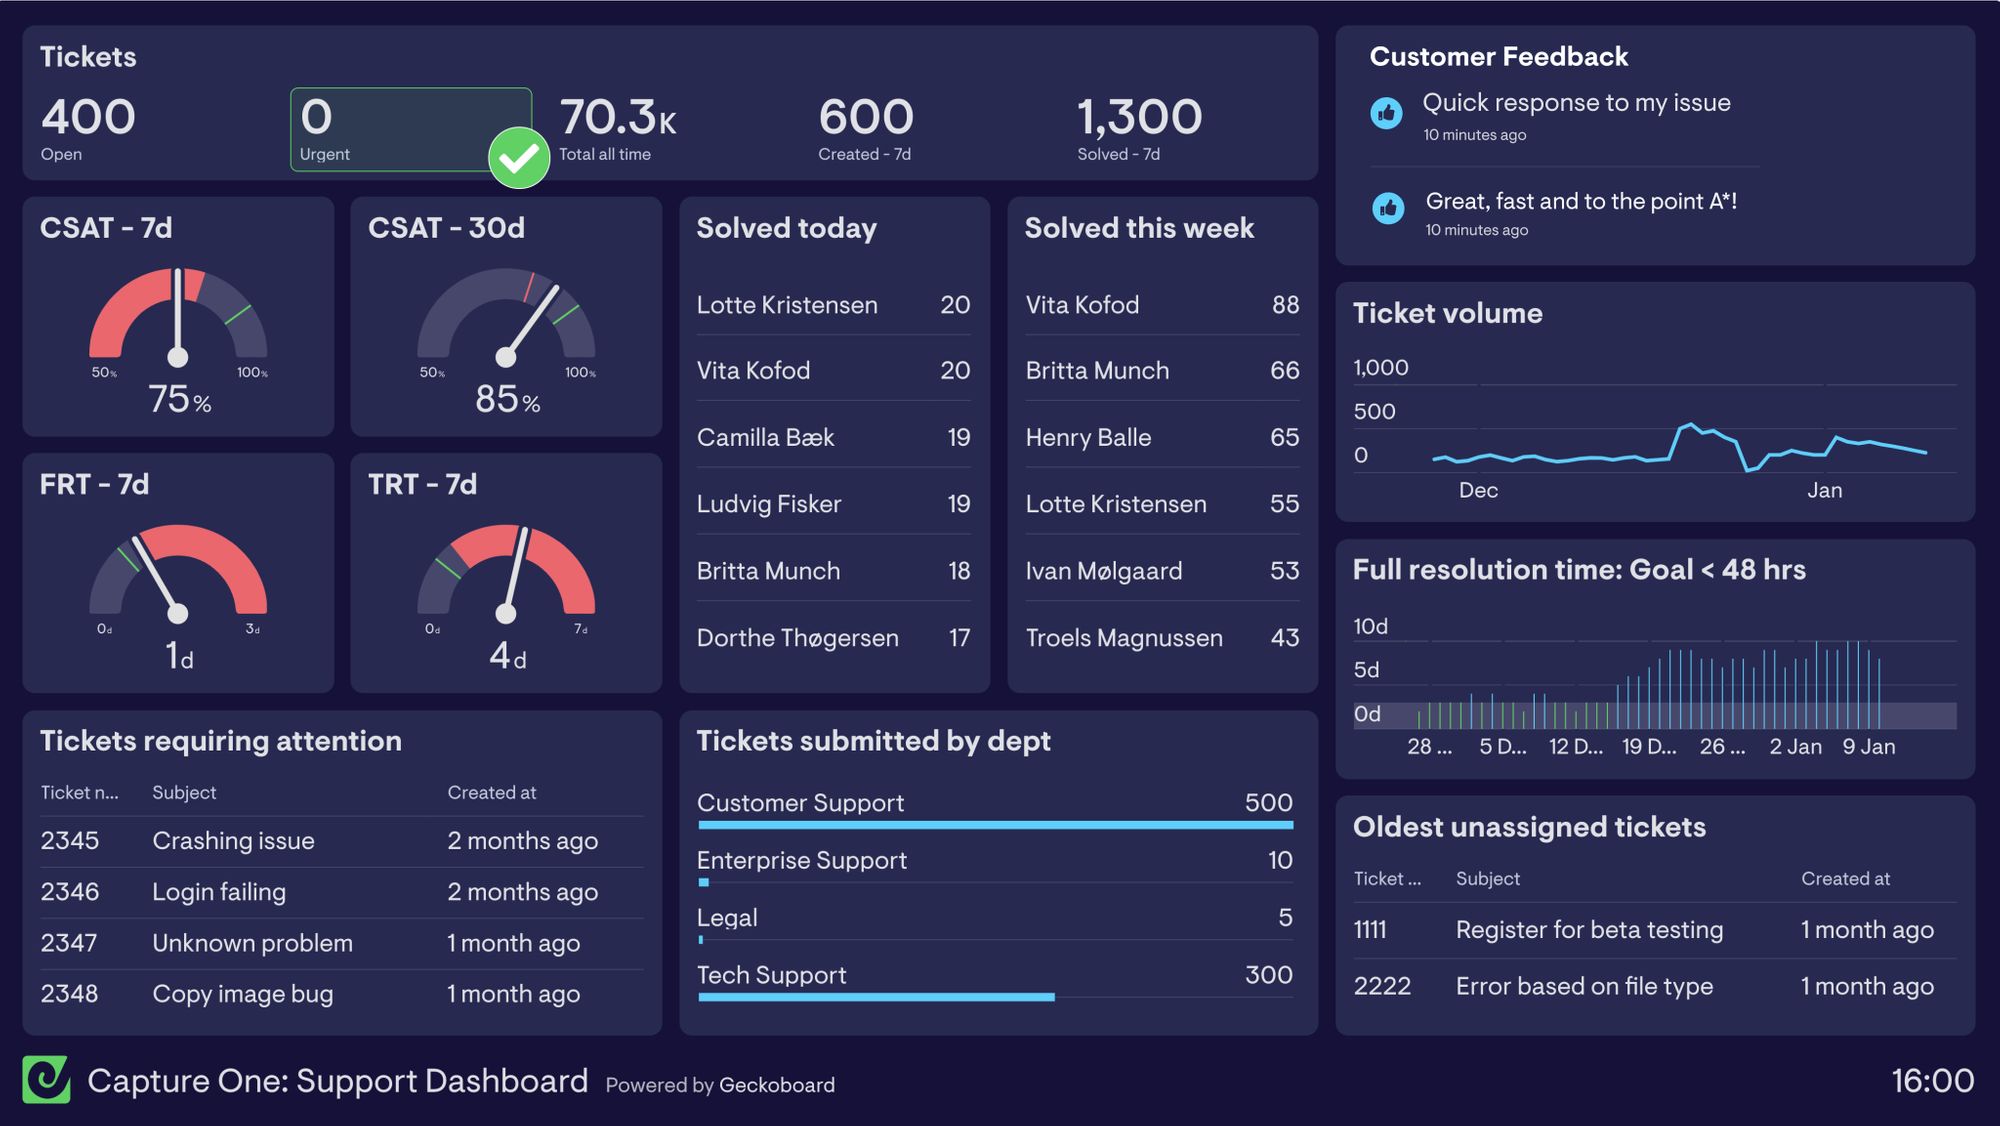
Our most important numbers on the Capture One: Support Dashboard are First Response Time (FRT) and Customer Satisfaction Score (CSAT).
We also take a close look at ticket volume. We do major software updates about once a year and this usually causes a surge in tickets. Our most recent update was in December and we’re still seeing the impact of that. However we only (mainly) care about ticket volume because the increase in demand affects our CSAT. If we had a CSAT of 100 it would hardly matter how many Open Tickets we had.
We show CSAT for both the past 7 days and the past 30 days. Including the longer time period helps remind the team of the bigger picture if we’re having a difficult week. Showing a list of our positive customer feedback also helps keep team morale up.
We’re currently over our Full Resolution Time goal of 48 hours or less because of the increase in tickets we’ve had recently because of the release in December.
Including our Oldest Unassigned Ticket details acts as a shared as a reminder to our agents to keep on top of these. Right now though, our focus is on reducing the number of Open Tickets.
Solved today by agent allows me to stay on top of what’s going on in the team each day.
How do you share your dashboard?
It’s important that the rest of the company sees our dashboard. It allows everyone to see the impact of something like a launch, and when we’re under pressure or customer satisfaction is being affected. The dashboard also helps us to communicate the product issues our customers encounter with the R&D team. It gives them an insight into how the product they are working on is received by customers. It is also a good way of highlighting when things are going well and we’re exceeding targets.
It’s really important to me that other departments see the volume of tickets we are dealing with. Often they will only hear about the unhappy customers but if they can see that we’ve solved over 70,000 tickets since we implemented Zendesk it gives them more perspective over the great work the team is doing and they can see how many more happy customers we have.
During normal times our dashboard is on a screen on every floor of the Capture One office. This means everyone in the business can see what’s going on in our department. Right now we are working remotely so instead have snapshots sent to Slack at 8am daily and my boss views it via a sharing link. The rest of the team keep the sharing links open in a browser to always have an eye on the numbers.
What resources would you recommend to other Support leaders?
I recommend everyone on the team reads The Effortless Experience: Conquering the New Battleground for Customer Loyalty. The aim is to give everyone a common perspective on how we approach Support. The essence of the book is that when working in Support if you’re ‘trying to wow’ or focusing on wowing your customers you’re shooting yourself in the foot. Customers don’t want to be wowed, they have been interrupted with an issue and they want to get back to the task at hand. The aim of the Support team is to reduce the friction and allow the customer to get back to what they were doing by providing the appropriate solution.
Finally, how do you ensure this approach is adopted among the team?
In our weekly meetings we go through a couple of tickets that have had bad or good satisfaction ratings. As a team we’ll review what we think went wrong, what went well, how we could improve and I try to make sure that it is grounded in the theory of the Effortless Experience.
