
We chatted with Kristian Marquez, Managing Director of Finstrat Management who took us through how he built a business around surfacing and optimizing SaaS metrics. He’s helped scores of clients gain investment, grow their business and better understand their opportunities - all through visualizing important financial metrics.
Tell us about yourself and the company
I’m Kristian Marquez, Managing Director of Finstrat Management (a full-service, outsourced financial department services firm) based just outside of Washington, D.C. We provide GAAP compliant accounting and finance services to SaaS businesses, enabling them to get a grasp of their most important metrics to facilitate growth and raise investment.
Because early stage SaaS companies have a lot on their plate, we take responsibility for all their financial processes. We handle everything from invoicing and payroll to advisory work with C-suite members, investors and the Board. We do everything you’d expect of an in-house finance team and at a fraction of the cost.
How do dashboards fit into your business?
Every single one of our clients has a dashboard we’ve made with Geckoboard. It is one of the deliverables we set up for them when they start to work with us. The dashboards we set up have a combination of actual and forecasted figures so our clients can see how their business is trending. These are created for the business as a whole to see how they are performing, but also to give shareholders and investors insights on the state of the business.
The dashboards serve a host of functions, number one being fundamental business intelligence. Simply put they allow us to “read the tea leaves”. We gather all financial information in one place and then we are able to help our clients understand what it means. We show them the levers for growth and change within their business, and they can see what happens when they pull those levers. They are able to watch it unfold on their dashboards as changes are made. Geckoboard serves a really valuable role in enabling us to communicate to management what is happening within the business, and shows them areas they should be looking at more closely.
A number of CEOs we work with share their dashboards in monthly or quarterly newsletters to their Board and investors and the feedback they receive is that they wish more of their investments did this.
We consistently see the dashboards inspire confidence. Every single company has a big focus on financial security and control, so being able to be open and transparent with investors or the Board by sharing a dashboard is a big deal.
It also gives potential investors the confidence to make an informed investment decision.
I would say that 99 times out of 100, investors have never seen anything like this before - it really impresses them and blows them away.
How did you discover Geckoboard?
I owe a debt of gratitude to Geckoboard actually. When I started Finstrat I was planning on building a business to help entrepreneurs raise capital, by helping them put together a pitch deck, work through terms and sitting with investors. I wasn’t considering dashboards.
However, my first client, Grant Elliott, the CEO of Ostendio, was looking for a dashboard to assist with his raise so I did my homework and discovered Geckoboard. I tried other tools but I ended up sticking with Geckoboard because of the ease of setting up the dashboards. They’re clear and easy to understand, and I can share them simply with a sharing link. That was how I got started, and now every single one of my clients has a Geckoboard dashboard and they’re all as happy as can be.
What metrics do your clients track on their dashboards?
We have a standard menu of SaaS metrics that we suggest, but each individual company is different, and so every one has some customization. Because Geckoboard is so flexible we’re easily able to adapt to the needs of our clients.
Our most commonly tracked metrics are Net MRR (including projections), New MRR, Expansion MRR, and Gross MRR Churn Rate. With each of these we’ll include line or column charts to show trends over time, and number widgets to call out the certain figures related to these.
Customer Acquisition Cost (CAC) Payback Period makes it onto most dashboards with an industry benchmark so that our clients can see how long it’s taking them to recoup costs to acquire customers, but also if that time period is acceptable. The benchmark applies some context so they can easily see where they need to be. CAC covers spend on sales and marketing to acquire new business, and it helps shed light on what it actually takes to convert a lead to a customer.
We include Average Revenue per Account (ARPA) alongside CAC, as this allows clients to understand what levers to pull to increase their ARPA. When our clients start closing bigger deals, generating expansion or raising pricing they’ll see this number increase. We’re able to isolate why ARPA changes which allow clients to closely track what has the biggest impact.
We provide counsel along with the dashboards, metrics and reporting to suggest what changes might help our clients move in the right direction.
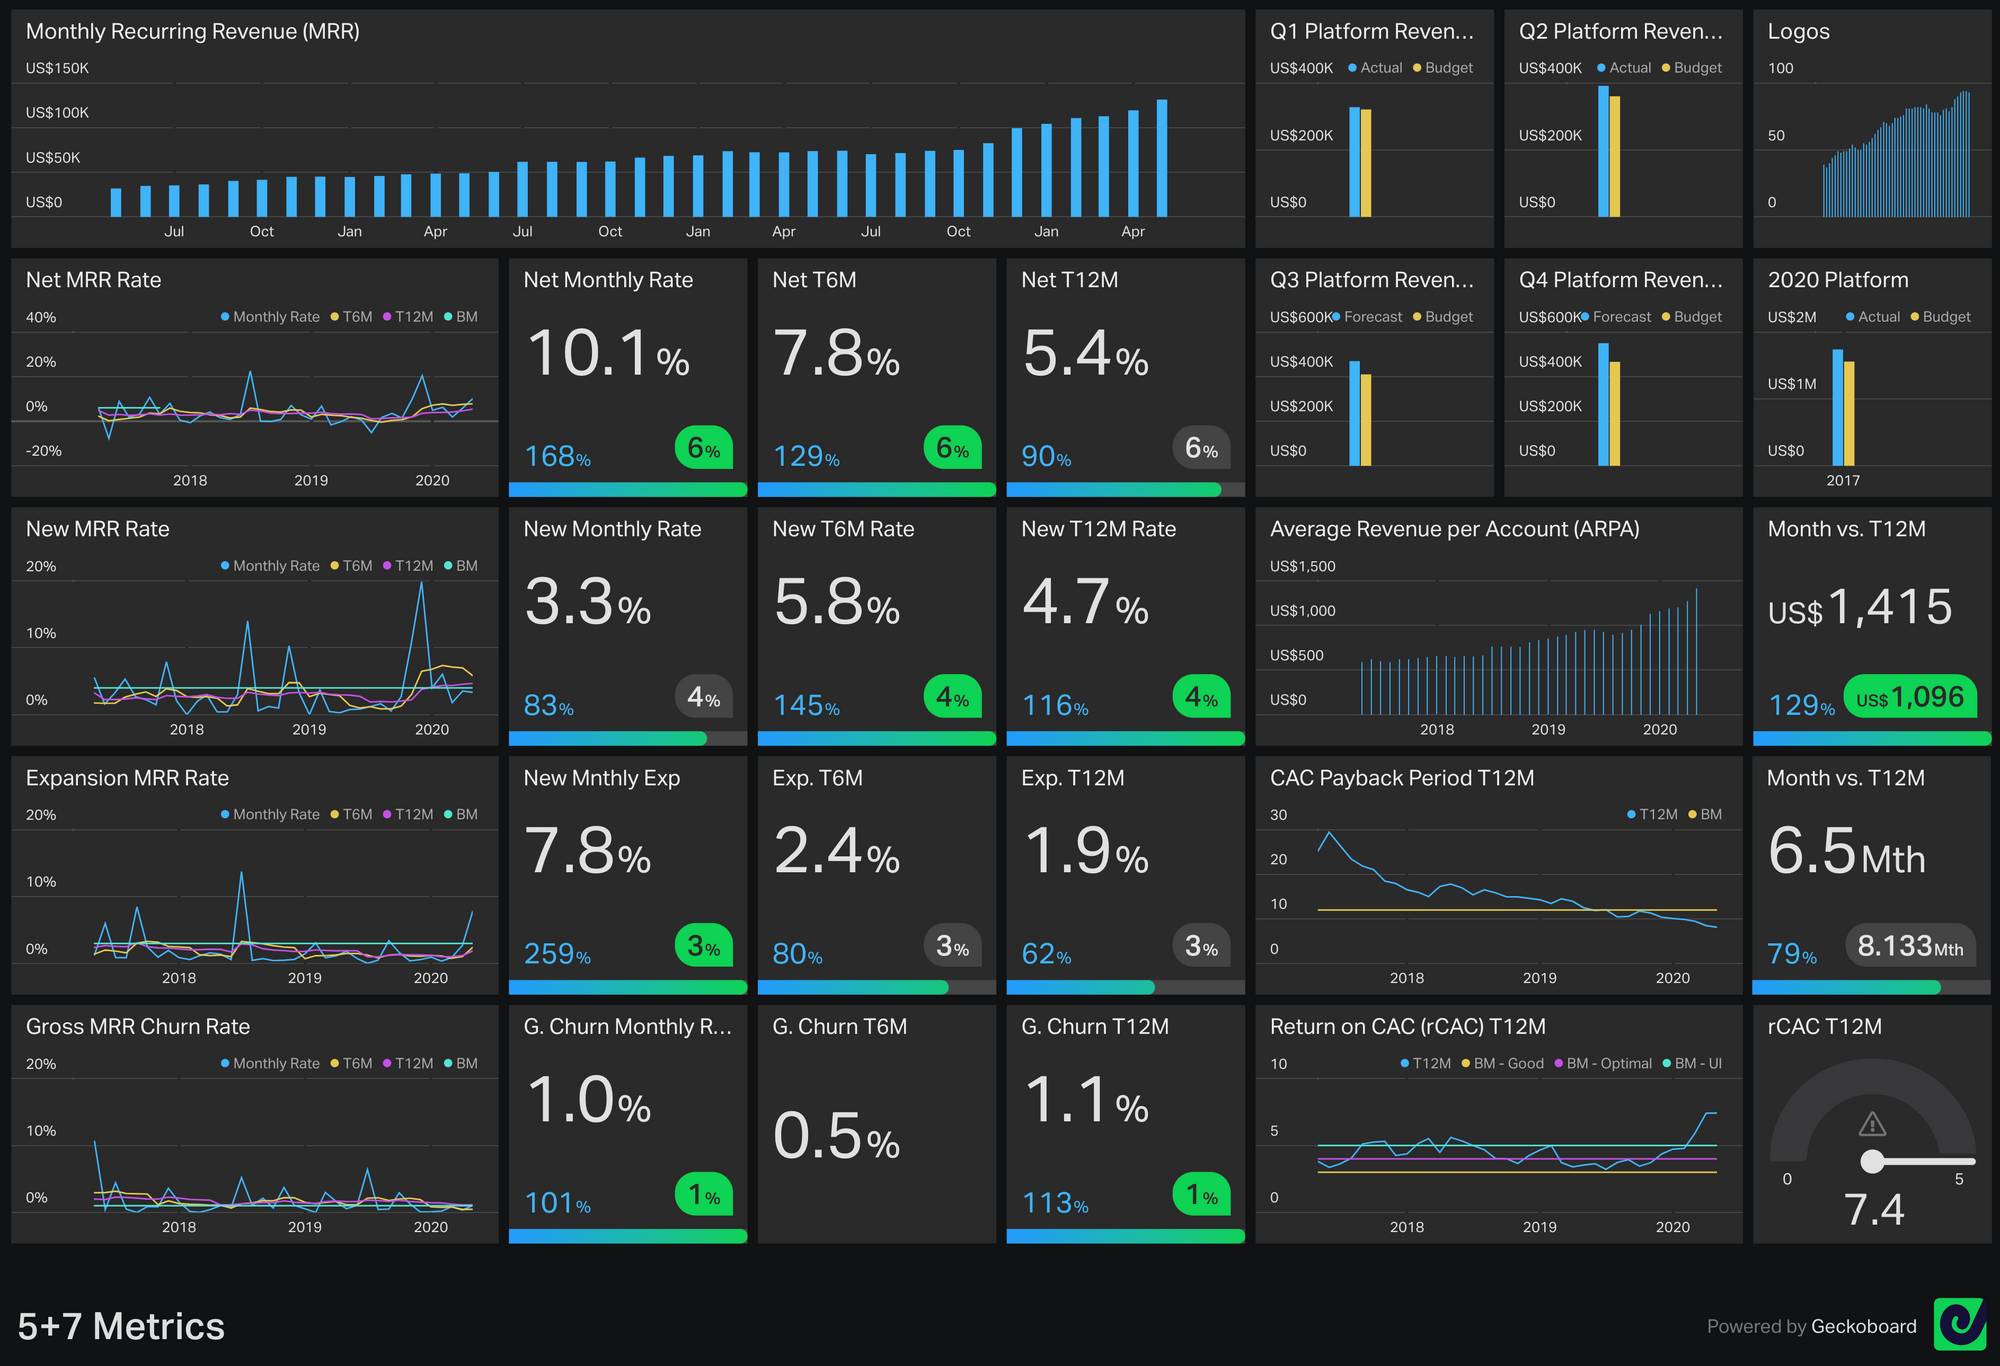
Take a look at the above dashboard in real time via this live sharing link.
How do you find and apply the benchmarks for your clients?
Christoph Janz has one of a number of great blogs that go into detail on benchmarks for SaaS businesses. We apply these using the goal feature within Geckoboard or in the case of line charts as another series so that you can easily see the comparison. The great thing is it’s very easy for us to change these benchmarks within Geckoboard when we need to.
Can you tell us about the best outcomes you have seen as a result of implementing dashboards for your clients?
When considering the CAC Payback Period, all things being equal, the smaller the number the better. From a target perspective, we encourage our early stage clients to aim for under 12 months. In order to be there, there are many levers companies have to work with to include deal quota and size, pricing, and spend for both cost of sales and sales and marketing. Beyond posting this information within clients' dashboards, our services include financial analysis as well.
As an example, working with our clients at Citus Health, we were able to highlight the rate of change between its cost to acquire customers relative to the average revenue the customers were generating. Following some changes to the pipeline mix and associated deal pricing, the company was able to get to and maintain a CAC Payback Period between six and nine months by increasing its ARPA.
“Our ability to visualize our performance has been a game changer. We're not only able to see the results of our decisions and efforts, but readily share them with internal staff and external stakeholders alike. As a result, our employees have said they find the feedback invaluable and motivating. From a Board and investor perspective, I constantly hear how grateful they are for the insight, as well as the confidence we're inspiring.” Melissa Kozak, President & CEO at Citus Health - client of Finstrat Management
Why do you use Geckoboard rather than sharing this information in a spreadsheet?
We’re massive fans of Excel, however, we prefer to use dashboards to share this information with our clients. We don’t want our clients having to scrutinize a huge spreadsheet where they have to navigate rows and rows of data to get to the heart of things.
With Geckoboard, the dashboard is so clean and it’s such an easy way to consume this data. I can even send it by text message and clients can pull their dashboard up on their phone in a breakfast meeting.
Our clients also like to share their dashboards with department heads and line managers. It not only helps them to understand the company’s performance but also helps to make them better managers. We are able to use the functions within Geckoboard (status indicators and goals) to highlight when a number is good (turning green), this allows anyone viewing the dashboard to understand that. Managers need to be as effective as possible and a lot of the time they don’t have formal training in accounting and finance - all they want to know is what their goal is. Once their goals are clear, they can then let their teams know how they’re doing and how far they are from getting their bonuses.
The dashboard becomes a powerful educational tool where people get lost with a huge spreadsheet.
Finally, how are dashboards shared with your clients?
We build dashboards for our clients and continue to update them, but we give everyone login access. The dashboards are largely shared using sharing links that go out across the business and to investors. Some of our clients like to get really involved, and start building new dashboards themselves for other teams or departments to track non-accounting metrics using other data sources. One of our clients, Boston based Resupply Inc., has made around two dozen dashboards using the Salesforce data source among others, and has these scheduled to send snapshots to Slack so the team can see it there on a daily basis. Geckoboard has really enabled power users to take reporting to a different level.
