if you’ve ended up here, there’s a good chance your Salesforce dashboard isn’t keeping up with the pace of the team. Your numbers might look right eventually - just not when you actually need them.
Pipeline moves. Deals change stages. Calls happen. Forecasts shift. But when your dashboard is out of date, people stop trusting it - then they stop using it.
This guide is here to help; it covers how Salesforce dashboards refresh natively, why this often feels slow for fast-moving teams, and how to build an always-on dashboard that stays current using Geckoboard’s Salesforce integration.
Let's get into it.
Can Salesforce dashboards auto refresh?
Yes, Salesforce dashboards can refresh automatically, but only via scheduled refresh (not continuously in real time). You can also refresh them manually whenever you need the latest numbers.
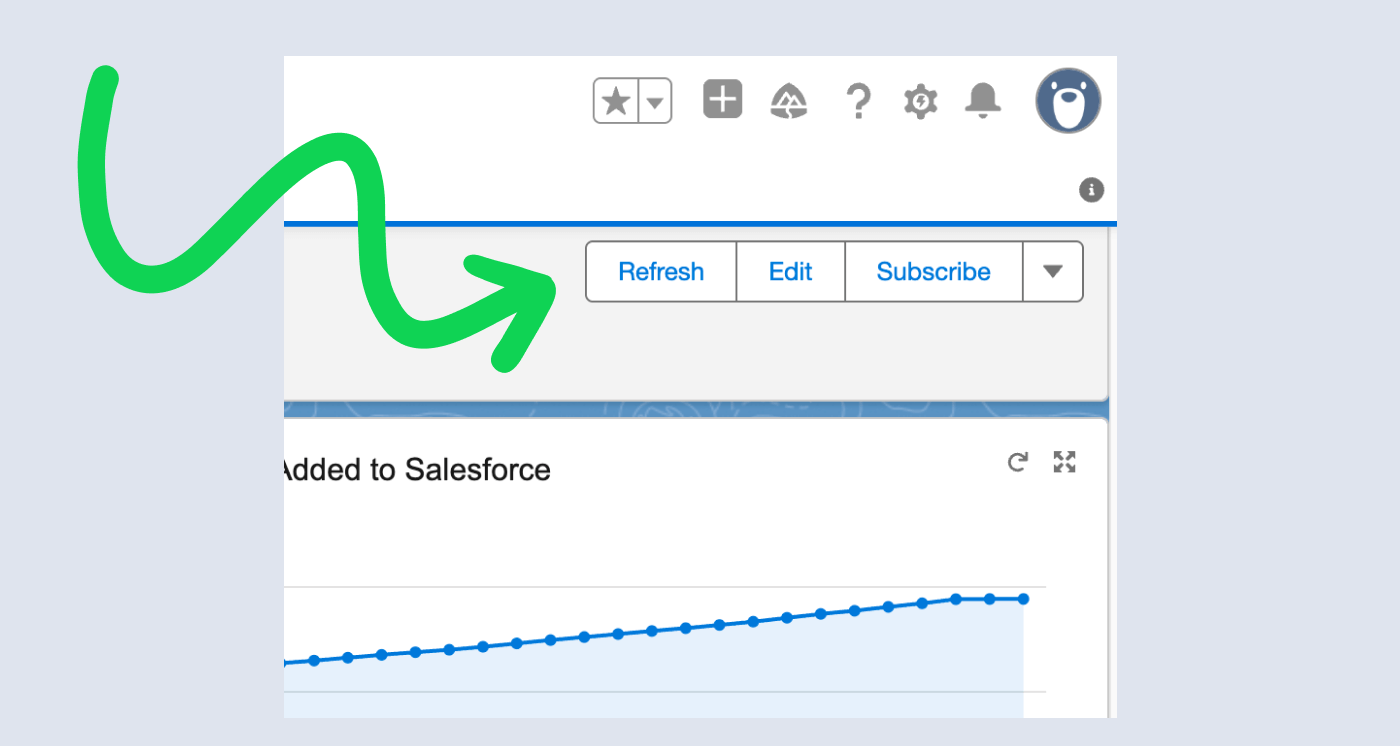
In Salesforce, scheduled dashboard refresh is configured as Daily, Weekly, or Monthly, and you can set start/end dates and a preferred start time. The key detail: the refresh runs within a time window of your preferred start time (rather than exactly on the minute), depending on how many dashboards are scheduled around the same time.
Because Salesforce dashboards are powered by reports, the dashboard refresh works by re-running the underlying report data on that schedule.
So why does this question keep coming up?
In practice, this approach to refreshing Salesforce data throws up some problems in a few familiar situations:
Sales leaders running pipeline live
You’re trying to keep an eye on:
- deals created today
- deals moving between stages
- coverage in key stages
- forecasts vs targets
If a dashboard lags, the team ends up working from gut feel or spreadsheets, or missing important pipeline health signals.
Managers tracking activity and follow-through
You want visibility into:
- calls made
- emails sent
- meetings booked
- tasks completed
If the data is stale, it stops changing behaviour.
RevOps trying to keep one source of truth
When dashboards are inconsistent or delayed, people build their own views. That’s how reporting sprawl happens - and how trust erodes over time.
There’s also a quieter problem behind all of this: CRM hygiene. We’ve seen sales teams struggle to get reps to fill in Salesforce quickly and consistently, which leads to numbers that feel “off” even when the dashboard eventually refreshes. Often it’s because reps don’t feel a fast feedback loop between their actions (and logging those actions) and the KPIs the team actually cares about.
What you can do in Salesforce
If you want to stay inside Salesforce, the simplest approach is:
- Make sure the underlying reports are the right shape for the metrics you need
- Use dashboard refresh (manual and/or scheduled) as your mechanism for “up to date”
That works fine for weekly/monthly performance review and recurring reporting.
It tends to fall short when:
- you want a shared dashboard visible all day
- you want the team reacting in the moment
- you want Salesforce data next to data from other “live” systems like phone providers or spreadsheets
A better approach for fast-moving teams
If you want a dashboard that’s always visible and stays current without babysitting refresh, you typically need two things:
- a reliable reporting structure (so the metric definition stays stable)
- a dedicated dashboard layer built for always-on sharing
That’s where Geckoboard fits in.
Geckoboard is a better fit when you want Salesforce reporting that’s easy to share and stays up to date automatically without someone constantly hitting refresh.
It also helps with the CRM hygiene problem above. When the team can see the metrics move shortly after activity is logged or stages are updated, the feedback loop gets tighter - and the dashboard starts changing behaviour, not just reporting on it.
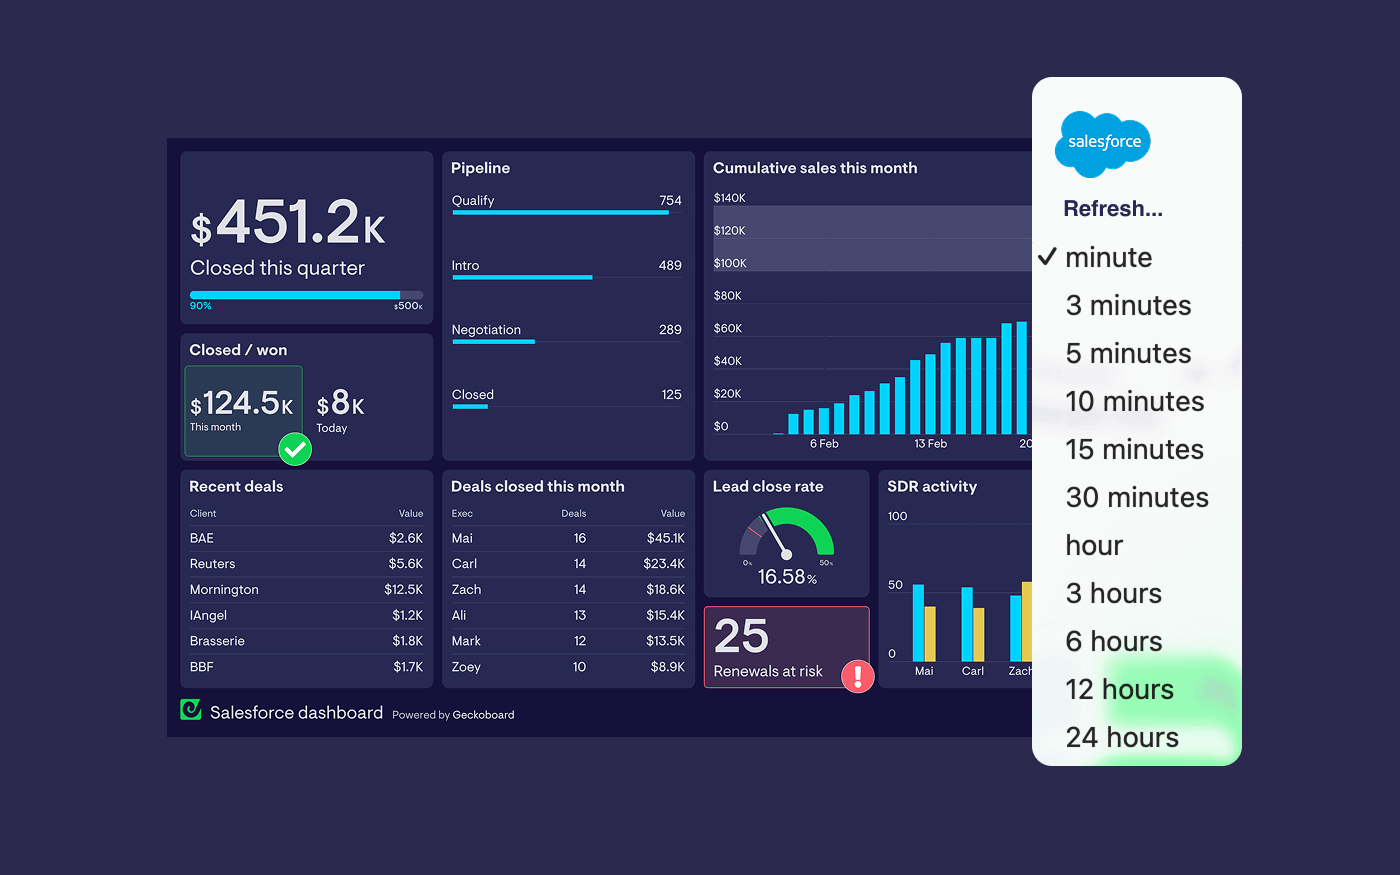
Geckoboard’s Salesforce integration is based on the reports you already trust, and lets you choose how frequently the data refreshes down to the minute.
Turn Salesforce reports into auto-refreshing dashboards with Geckoboard
The model is simple:
- Salesforce stays as the source of truth (your reports define the KPIs)
- Geckoboard turns those report results into live, glanceable widgets that are easy for a team to see
Here's how to build an auto-refreshing Salesforce dashboard in Geckoboard:
1) Connect Salesforce to Geckoboard
In Geckoboard:
- Click + Add widget
- Choose Salesforce
- Follow the prompts to connect your Salesforce account
Note: Geckoboard connects via the Salesforce API, so your Salesforce edition needs API access. Geckoboard lists supported editions on the integration page.
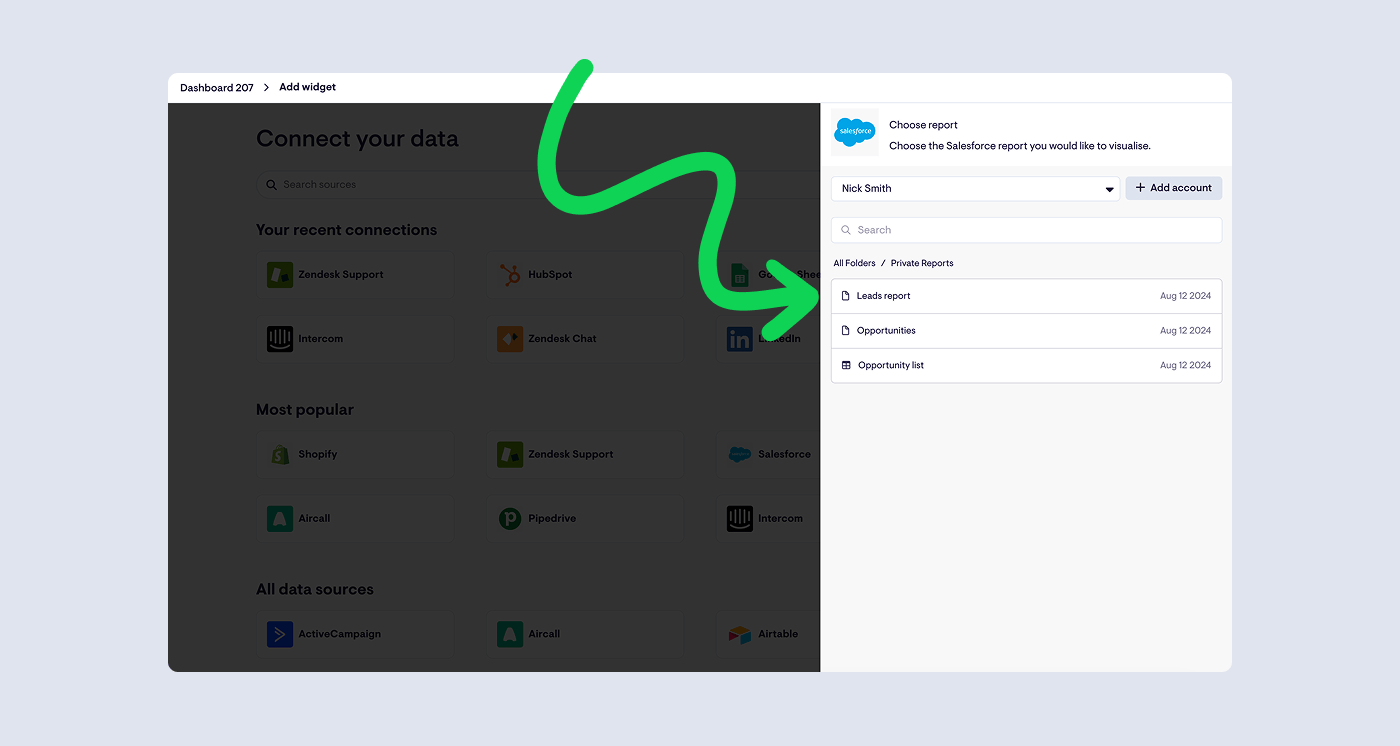
2) Choose a Salesforce report
Once connected, you’ll see a list of your Salesforce reports in Geckoboard. Select the report you want to visualise.
This is deliberate: instead of rebuilding logic in a dashboard tool, you keep the KPI definition in Salesforce, where your team already expects it to live.
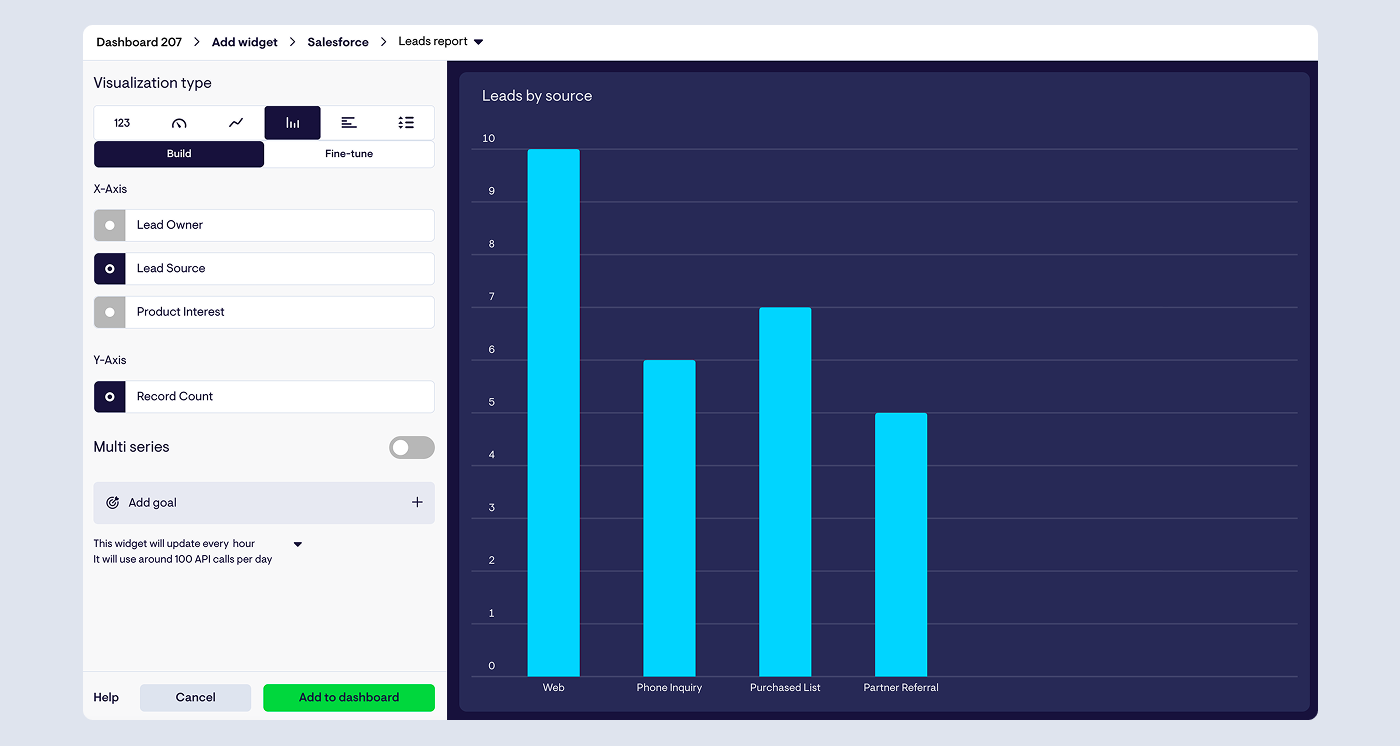
3) Turn the report into a live widget
Pick a widget type, configure how the report results are displayed, and click Add to dashboard.
4) Build out a dashboard in minutes
Once your first widget is in place, duplicate it and tweak the report or configuration to add the next KPI. This is usually the fastest way to go from “one widget” to a full working dashboard.
If you have data in other systems you’d like to see alongside Salesforce data - such as Aircall or Google Sheets - you can click ‘Add widget’ to create widgets powered by those services too.
See the full process in this quick video below.
How fast does Geckoboard refresh Salesforce data?
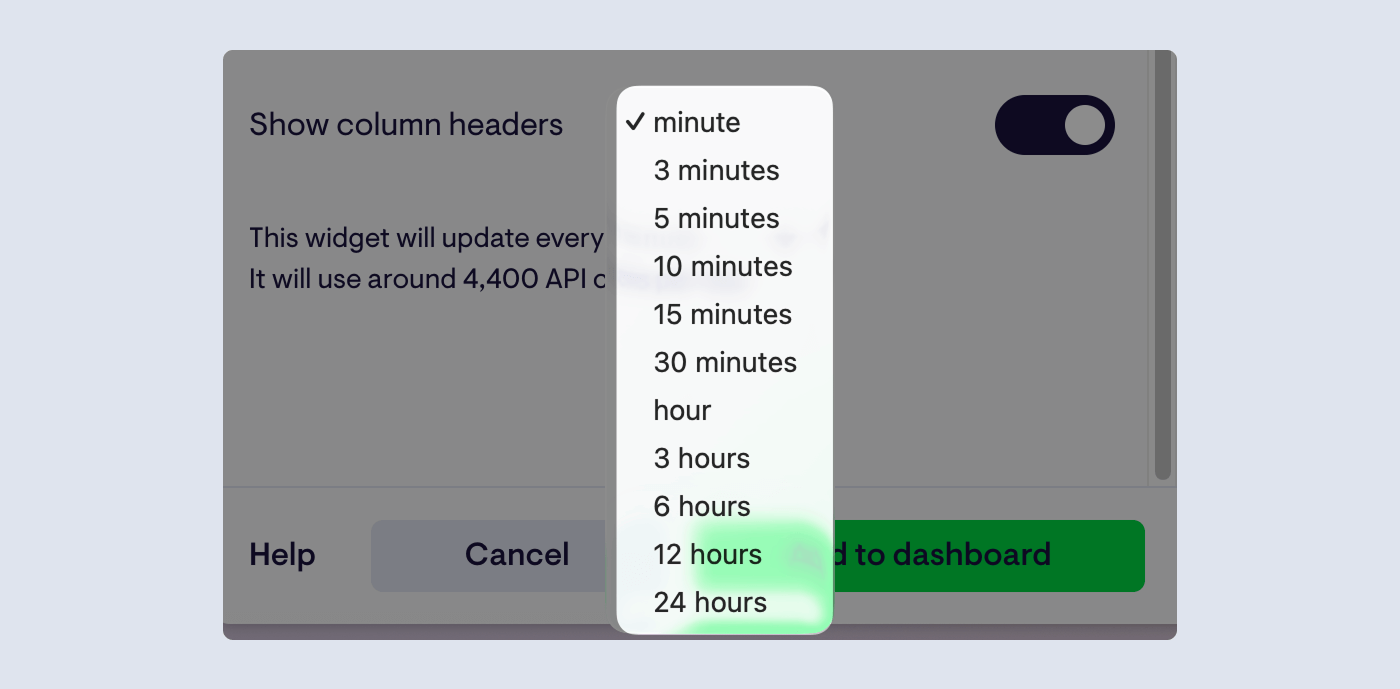
Salesforce widgets in Geckoboard have a user-configurable refresh rate - so you can make dashboards feel “live” without being reckless with API usage.
You can find refresh rates for Geckoboard's other integrations here.
A useful detail on Salesforce API limits
When Geckoboard refreshes a Salesforce widget, it polls Salesforce for the current status of the report (this polling can consume up to 3 API calls). If you have multiple widgets powered by the same report, Geckoboard caches the data to reduce wasted API calls.
Build the right Salesforce report
If the information on a dashboard doesn’t feel right, it’s usually the report.
A few practical constraints to keep in mind when building your underlying reports to ensure your dashboards are effective:
- Geckoboard builds Salesforce widgets from reports (and what you group/summarise affects what you can chart)
- Summary fields drive number/gauge widgets
- Grouped fields drive breakouts and charts
- Joined reports aren’t supported
Learn more in these step-by-step guides:
- Build a report for Geckoboard in Salesforce Lightning
- Build a report for Geckoboard in Salesforce Classic
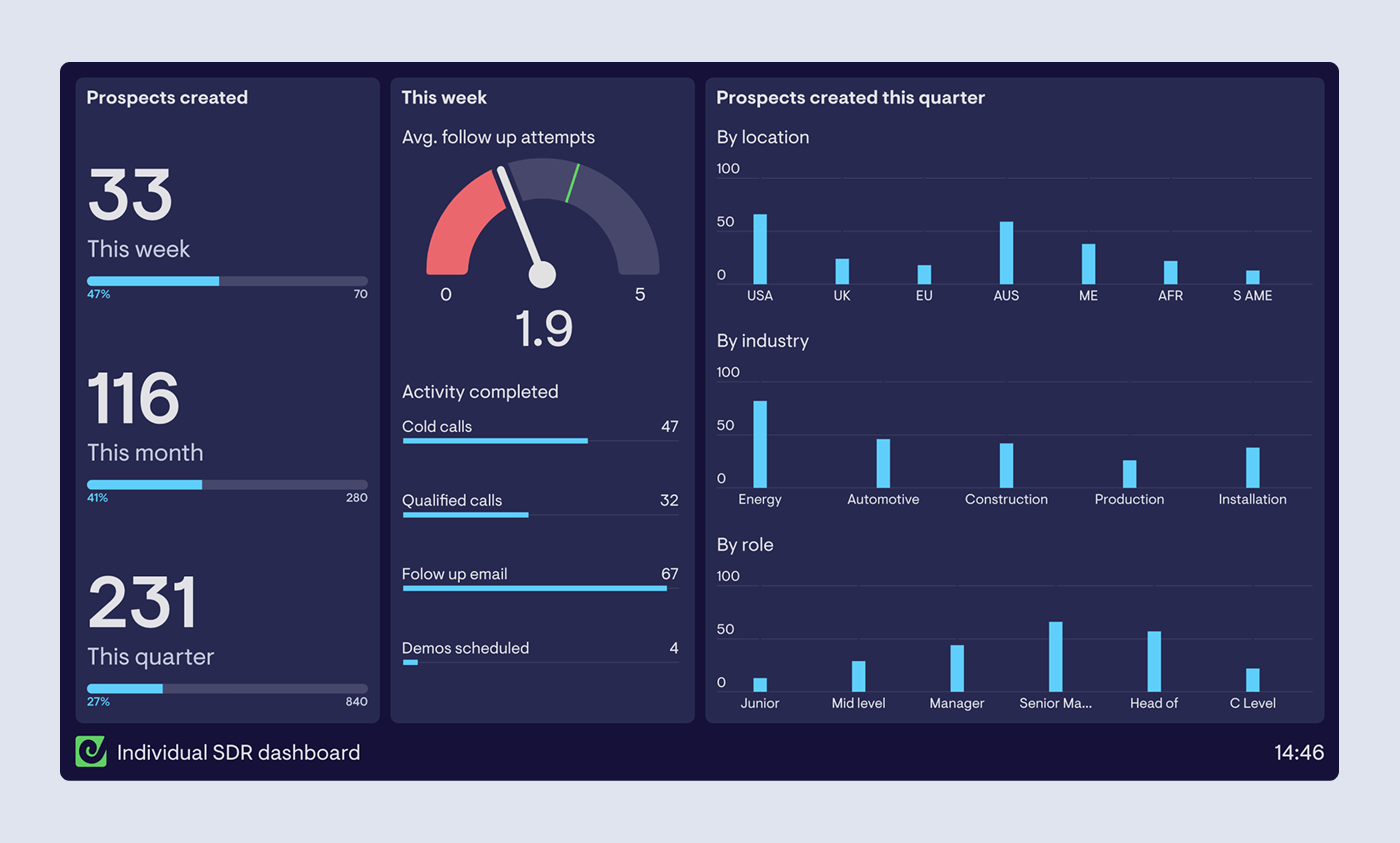
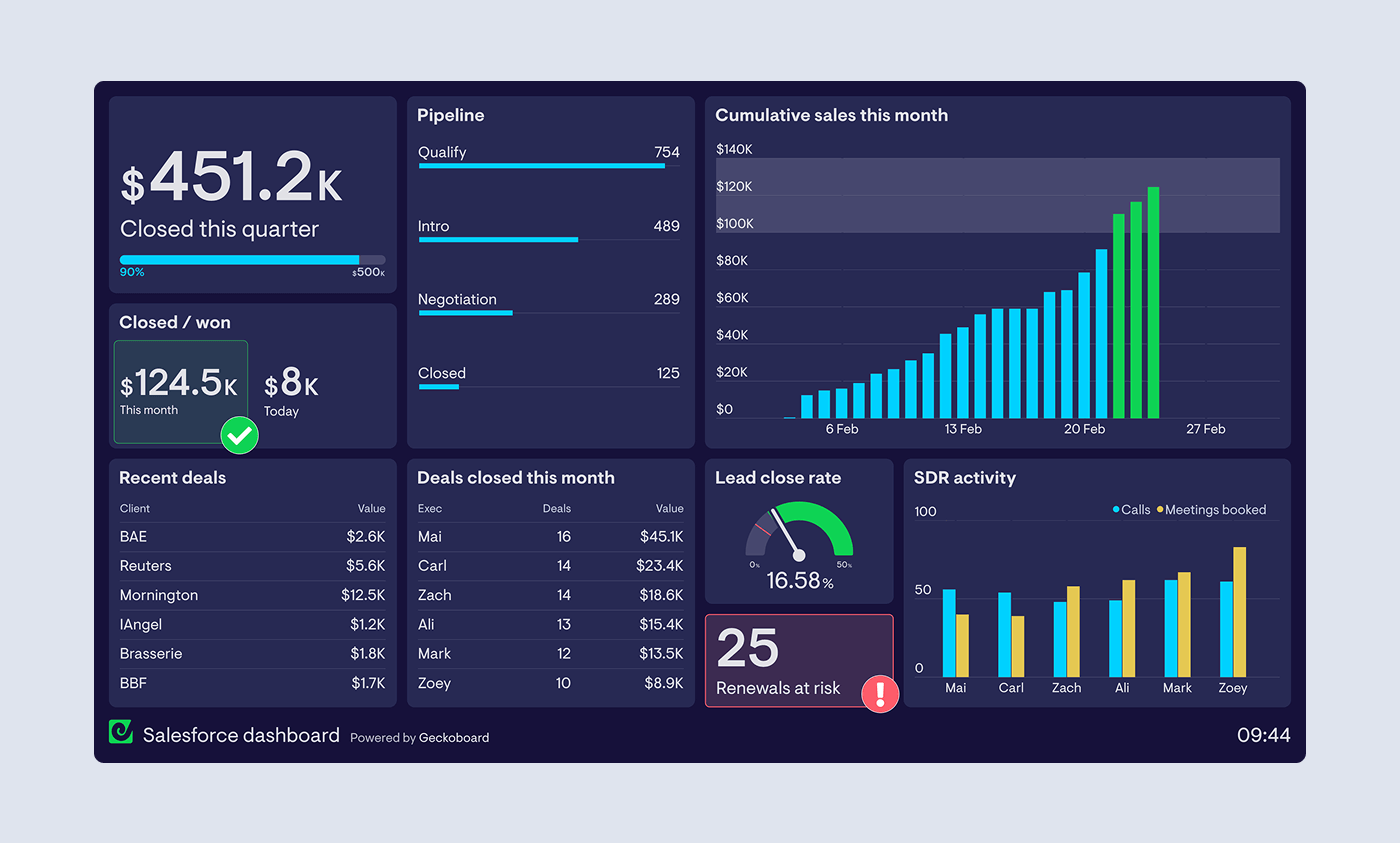
What to put on a live Salesforce dashboard
Start with the metrics you’d actually check repeatedly during the day.
Pipeline and forecasting
- deals created today
- deals moved stage today
- pipeline value by stage
- forecast vs target
Activity and follow-through
- calls made
- emails sent
- meetings booked
- tasks overdue
CRM hygiene signals
- opportunities with no next step
- stale opportunities by stage
- activity logged vs expected
This is where the feedback loop becomes real: if reps can see that logging activity moves the numbers they’re being measured on, adoption tends to improve.
Add context beyond Salesforce
Most teams don’t run the day from Salesforce alone.
Geckoboard connects to 90+ data sources, so you can put Salesforce next to the other systems that explain what’s driving it - like phone platforms, spreadsheets, support tools, and marketing analytics.
Learn more about how to see Aircall data alongside Salesforce data for example.
How to share your auto-refreshing dashboard
Once you’ve built it, you can share your live dashboard wherever it drives action:
- keep it open on desktop for day-to-day management
- share a link so the team is looking at the same numbers
- send scheduled snapshots to Slack/Teams or email
- display it on a TV for always-on visibility

If you’re thinking about displaying Salesforce dashboards on TVs, check out our TV dashboard best practice guide.
Getting started
- Identify 5-10 KPIs you want the team reacting to daily
- Make sure the Salesforce reports are clean and stable
- Connect Salesforce to Geckoboard, pick your reports, build widgets
- Set a refresh rate that feels responsive and fits your API budget
- Share it where it changes behaviour (desktop, link, Slack/Teams, TV)
FAQ
Can Salesforce dashboards auto-refresh in real time?
Salesforce dashboards can refresh automatically via scheduled refresh (daily/weekly/monthly) and can be refreshed manually, but they’re not designed to update continuously like a live ops screen. That’s why many teams use a dedicated dashboard layer when they need always-on visibility.
How do I auto-refresh Salesforce dashboards in Geckoboard?
Connect Salesforce to Geckoboard, choose a Salesforce report, then turn that report’s data into live widgets you add to a dashboard. The widgets refresh automatically in the background.
How often does Geckoboard refresh Salesforce data?
Salesforce widgets have a user-configurable refresh rate in Geckoboard. You can choose how frequently widgets refresh, down to the minute, or dial it back to reduce API usage.
Does using Geckoboard increase Salesforce API usage?
Geckoboard uses Salesforce’s API to check report status and fetch results. This polling can consume up to 3 API calls per refresh, and Geckoboard caches data so multiple widgets using the same report don’t multiply calls unnecessarily.
Do I need Salesforce API access to connect?
Yes - Geckoboard connects to Salesforce via the API, so your Salesforce edition needs API access. Geckoboard lists supported editions on the integration page.
What Salesforce reports work best with Geckoboard?
Geckoboard supports Summary, Tabular, and Matrix reports (not Joined). How you group and summarise fields affects what you can visualise. Learn more.
How do I build the right Salesforce report for my dashboard?
Start by designing the report around the question your dashboard needs to answer (pipeline movement, activity, forecast, hygiene). Use the guide for your Salesforce UI: Lightning | Classic
Can I show Salesforce dashboards on a TV?
Yes. Once your dashboard is built in Geckoboard, you can display it on a TV as an always-on wallboard so the whole team can see the numbers.
Can I combine Salesforce with other tools like Aircall or spreadsheets?
Yes. Geckoboard supports Salesforce plus 90+ other data sources, so you can put pipeline metrics next to calling activity, targets tracked in spreadsheets, and other operational signals.
