
Zendesk captures a ton of data about your customers and the support experience you provide.
However, since Zendesk’s reporting tool (Zendesk Explore) is its own ecosystem, some organizations like to connect Zendesk to Power BI so they can combine Zendesk data with data from across their organization.
If you use both tools, integrating Zendesk and Power BI is a solid plan for turning raw customer support data into actionable insights.
In this step-by-step guide, we’ll show you how to connect Zendesk to Power BI so you can build custom dashboards, track key performance indicators (KPIs), and much more.
But first, have you considered easier alternatives?
If you need a Business Intelligence system to run regular structured queries, then Power BI is a great choice. However, not everyone who needs to visualize Zendesk data needs a BI tool.
Perhaps you need to visualize your Zendesk data in the form of a dashboard you can share with your team, or display on a TV? Perhaps you need an easier way to drill down into your key metrics?
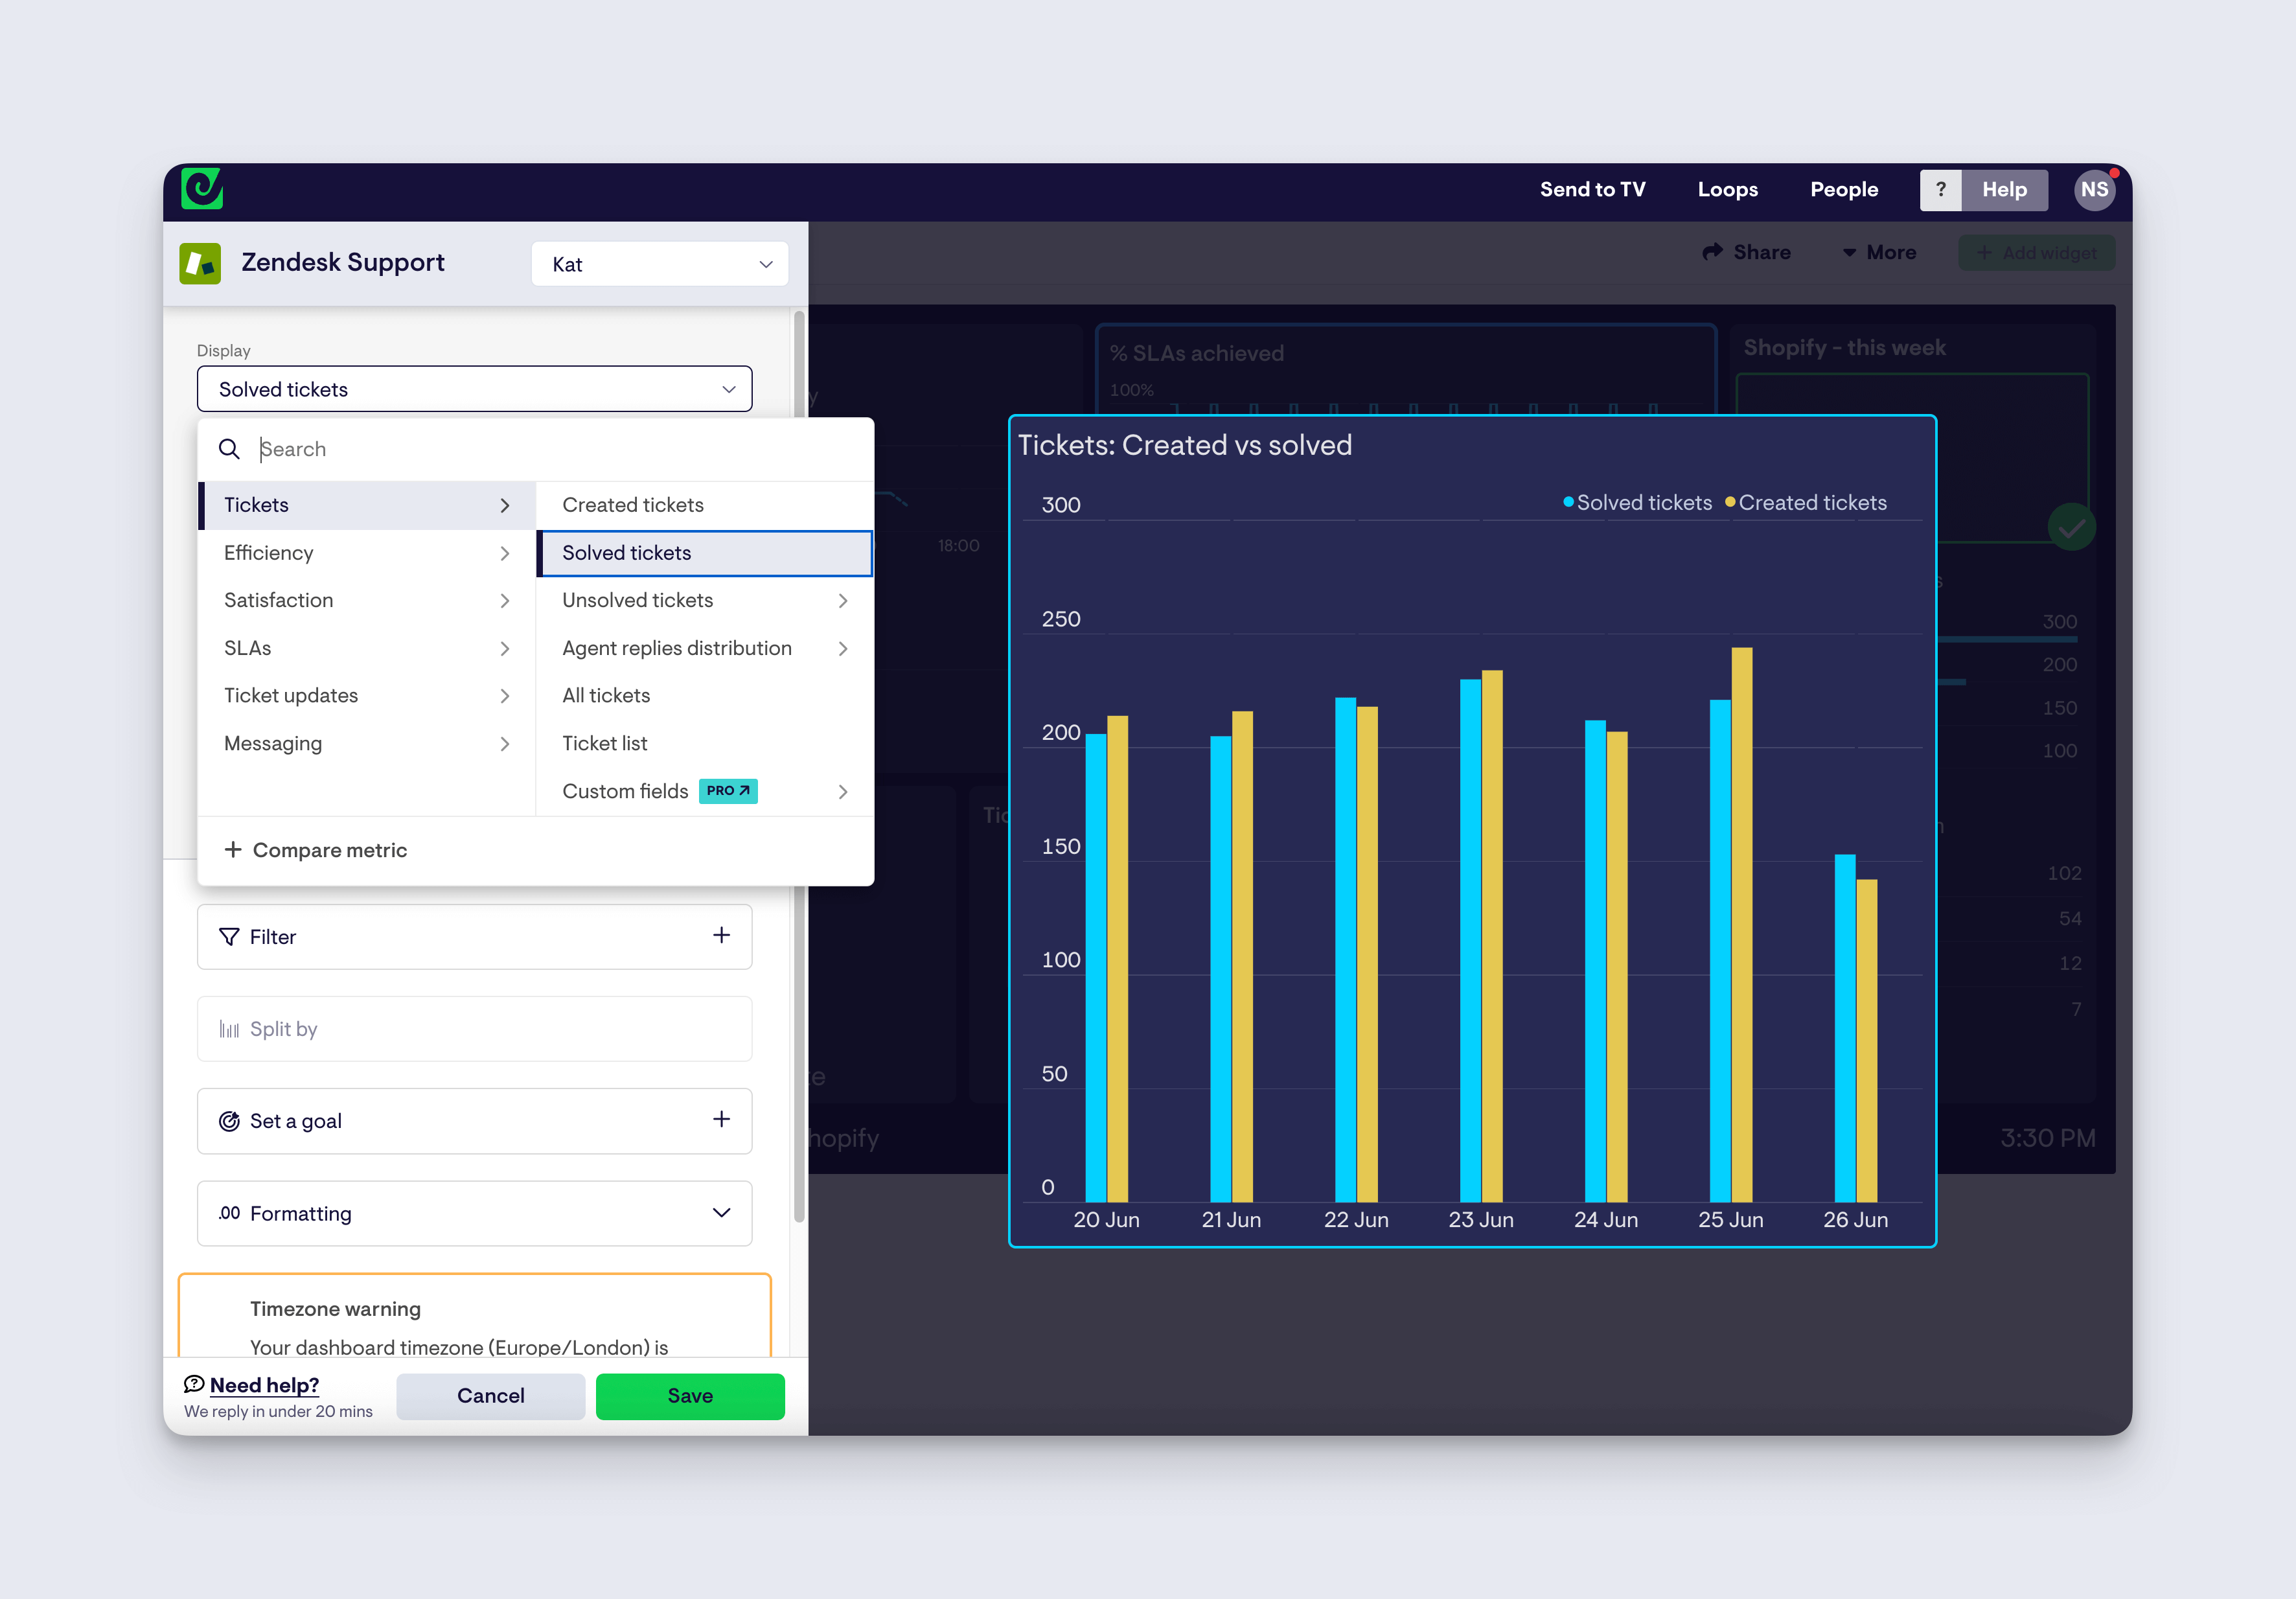
If this sounds like you, then you should consider an easier alternative like Geckoboard. Geckoboard connects to your Zendesk data in a few clicks, and enables you to create KPI dashboards in just a few minutes. No coding, data warehousing, or training necessary. Just plug and play.
Why connect Zendesk to Power BI?
There are many reasons you might need to connect Zendesk to a BI tool like Power BI. Particularly if you’re running analysis across data from multiple sources. Here are a few examples of some of the tasks Support leaders and Operations teams may need to complete.
Demonstrate the link between customer satisfaction and repeat sales
By collecting customer satisfaction (CSAT) scores from Zendesk and mapping them alongside sales data from tools like Salesforce or Shopify, you can highlight the power of great customer service when it comes to creating loyal, repeat customers.
Show how customer support impacts conversion rates
Got a hunch that the chatbot you added to your purchasing flow helped more customers complete their orders? Confirm your assumptions by creating a Power Bi report with data from Zendesk and Google Analytics showing conversion rates before and after you introduced the chatbot.
Showcase gains in operational efficiency
You’ve probably built out a help center to proactively answer customer questions. Zendesk Guide reporting can help you understand its impact to some extent, but combining data from Google Analytics will be more insightful. You’ll be able to see the reduction in support ticket volume in users who engage with your knowledge base.
You’ll also be able to highlight this impact to your executive team and others, too. Win-win.
How to connect Zendesk to Power BI
Both Zendesk and Power BI are flexible tools, meaning there are several ways to integrate them.
The method we’ll cover doesn’t require you to purchase an additional tool, like the Zendesk Power BI Connector. Instead, we’ll use the Zendesk API to bring Zendesk’s data into Power BI, where you’ll have full control over how you use that data.
While connecting these two tools isn’t a particularly technical task, Power BI’s back-end can sometimes get complicated. You might need to rely on a data analyst’s help to turn your raw Zendesk data into effective Power BI dashboards.
To get started, you will need:
- A Zendesk admin account
- The email address linked to your Zendesk admin account
- Your Zendesk subdomain. If you’re logged into Zendesk, this is the portion of the URL that precedes “.zendesk.com.” For example, the Zendesk URL for Acme Co. might be acme.zendesk.com, meaning the subdomain would be acme
- A Windows PC, or a virtual Windows machine on your Mac
- The Power BI Desktop installed on your PC
1: Enable API token access in Zendesk
To connect Zendesk with Power BI, you'll need to create an API token in Zendesk. Power BI uses this API token like an ID card when requesting data from your Zendesk instance.
Zendesk disables API token access by default. You must enable API token access in the Admin Center before you can generate API tokens.
To enable API token access, go to the Admin Center, click Apps and integrations in the sidebar, then select APIs > Zendesk API.
In the Settings tab, enable token access.
2: Generate an API token in Zendesk
Once you’ve enabled API token access, click the Add API token button.
Enter a description for your API token (if you’d like), then copy the token and save it somewhere secure. Note that once you click Save, you won't be able to see the full token again. From that point onward, Zendesk will only show part of the token as a security measure.
3: Add Zendesk as a data source in Power BI
Next up, let’s add Zendesk as a data source in Power BI. To do so:
- Open Power BI Desktop
- Click on Home > Get Data > Web
- In the dialog box that appears, enter the Zendesk API URL: https://{your-subdomain}.zendesk.com/api/v2/tickets.json. Replace "{your-subdomain}" with your actual Zendesk subdomain
- Choose Basic authentication and enter your Zendesk email as the username and the API token you generated as the password
- Click OK, then Power BI will connect to your Zendesk instance
4: Clean up (transform) your data in Power BI
Once you’ve connected the two tools, you'll see a preview of the Zendesk data. You might want to do some cleaning up—called “transformation” in Power BI—to organize the data for better analysis:
- Select the tables you need, like Tickets, Users, and Groups
- Apply any necessary data transformations, like filtering out unnecessary columns or merging tables
- Click Close & Apply to load the transformed data into Power BI
5: Build your dashboards and reports
Now that you’ve pulled your Zendesk data into Power BI, you’re able to use Power BI’s functionality to create different ways of visualizing that data.
At this point, you can also consider whether data from other sources would be helpful to view alongside your Zendesk data.
For example, you could compare average resolution times in Zendesk with customer churn data from Salesforce to see whether faster issue resolution leads to less churn. If the numbers show that long wait times are leading to lost customers, include this statistic in your business case for expanding the support team.
To level up your dashboards, check out our best practice checklist for dashboard design.
6: Share your reports and dashboards
One of the major benefits of connecting Zendesk with Power BI is that you’re no longer limited by the number of seats on your Zendesk account. You’ll certainly want to share your reports and dashboard with your colleagues so they can understand the insights you’ve uncovered.
You can do this without giving them access to the underlying data, which means they can interact with your expertly-crafted dashboard without being able to break it. Phew!
Using the ‘Share’ button, you can grant your colleagues access to the report and either send them an invite via Mail or Microsoft Teams, or get a sharable link.
Want a simpler solution? Try Geckoboard
For those of you who’ve now successfully connected Zendesk with Power BI to create an insightful dashboard packed with meaningful metrics – congratulations. This process makes customer insights more accessible across your organization, while also demonstrating the positive impact of your support team’s work.
But if Power BI proved too complex, then why not consider more user friendly alternatives.
Zendesk and Power BI can be a great combination, but Power BI’s learning curve can be steep. If you want to unlock insights faster and reduce your reliance on your data team, you should give Geckoboard’s 14-day free trial a go.
Geckoboard is hands-down the fastest way to build real-time Zendesk dashboards that surface the data your support team needs to excel. And since it integrates with tons of popular customer support tools beyond Zendesk—including Intercom, Freshdesk, Help Scout, Klaus, Gorgias, Aircall, and more—you’re able to build out a 360-degree view of your customer support experience.
Author: John Holt
Bio: John is a UK-based writer with years of experience creating content and helping customers across several industries. He currently works on the Product Support team at Hotjar. You can connect with him on LinkedIn.
