If you’re using Jira day-in, day-out, it’s probably fair to say you’re one of those people who loves getting stuff done.
For staying organized, capturing details around individual tasks, and managing projects, Jira is great. But it's all too easy to get lost in the details of our boards, and miss the big picture of what’s happening in a project.
Even more so when we’re juggling multiple projects, or sharing an update for someone who not familiar with the detail of your Jira system.
This is where the power of visualization comes into play, and it's precisely what Geckoboard - our straightforward dashboard software - excels at. By integrating directly with Jira, Geckoboard transforms complex project data into clear, actionable insights through easy-to-understand dashboards that update in almost real-time.
Whether you are a seasoned Jira user or just getting started with the platform, learning how to create a streamlined Jira dashboard is a game-changer, helping data-driven decisions to become second nature, and making Jira data more accessible for others in your organization.
In this quick guide, we’ll explore how to use Geckoboard to make monitoring and acting on your Jira data a lot simpler, whether you’re tracking a single project or managing multiple initiatives simultaneously.
Why create a Jira dashboard?
Before we dive right in, it’s worth considering why a standalone dashboard might make sense for tracking Jira project or ticket data. After all, doesn’t Jira itself have a selection of reports and insights baked in?
Building custom Jira dashboards using a tool like Geckoboard carries three distinct advantages over using Jira’s baked-in visualizations.
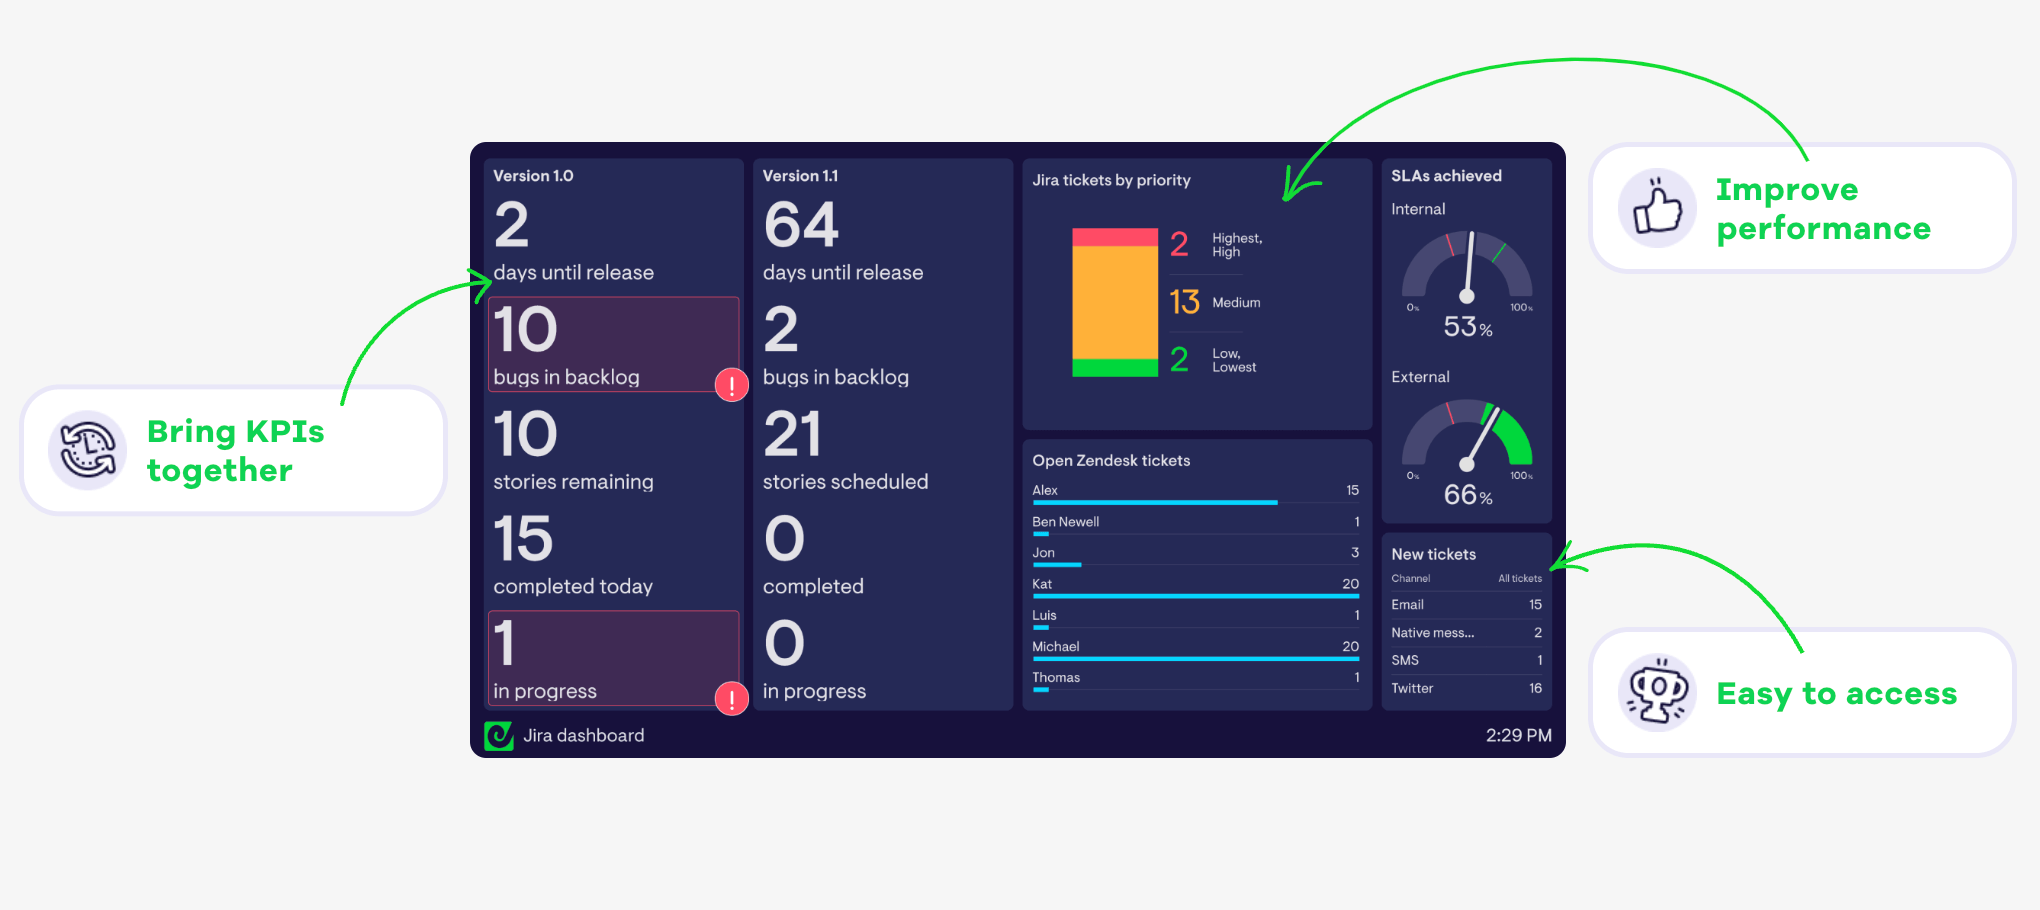
- Focus: While Jira is a powerhouse for project management, its depth can be overwhelming. A standalone dashboard simplifies this complexity, turning rich data into an easy-to-understand view containing just the metrics that matter, which team leaders and stakeholders can use to quickly understand what’s going on.
- Bring metrics together from different places: To fully understand what’s happening in your project or workflow, you might need to reference data from across different Jira projects and even other tools. This is another area where a standalone dashboard like Geckoboard - which connects to over 90 data sources - can add value. Whether you’re a customer service team looking to track Zendesk metrics like first response time alongside your Jira issues, or you need to quickly see data from across several Jira projects, a custom dashboard can bring all your KPIs together into one view.
- Shareability: Creating a consolidated, easy-to-read view of key metrics helps others in your organization to understand what’s going on. In addition, standalone dashboard tools often have sharing functionality built in that can help managers and team leads access and share KPIs in ways that Jira itself isn’t well suited for. In the case of Geckoboard, live dashboards can be viewed through a link, sent automatically every day or week via email or Slack, accessed on mobile devices and even displayed on office TVs.
Preparing to create a Jira dashboard
Building a custom real-time Jira dashboard is easier than it might sound, and using the guide below you can expect to have something up and running easily within an hour.
There are a few prerequisites to ensure a smooth setup though.
A Jira account - It goes without saying, but you’ll need a Jira account, with at least one project.
A Geckoboard account - in this guide we’ll use Geckoboard to build a dashboard. You can sign up for a free 14-day trial using this link (no payment details required).
Creating your first Jira dashboard - a quick guide
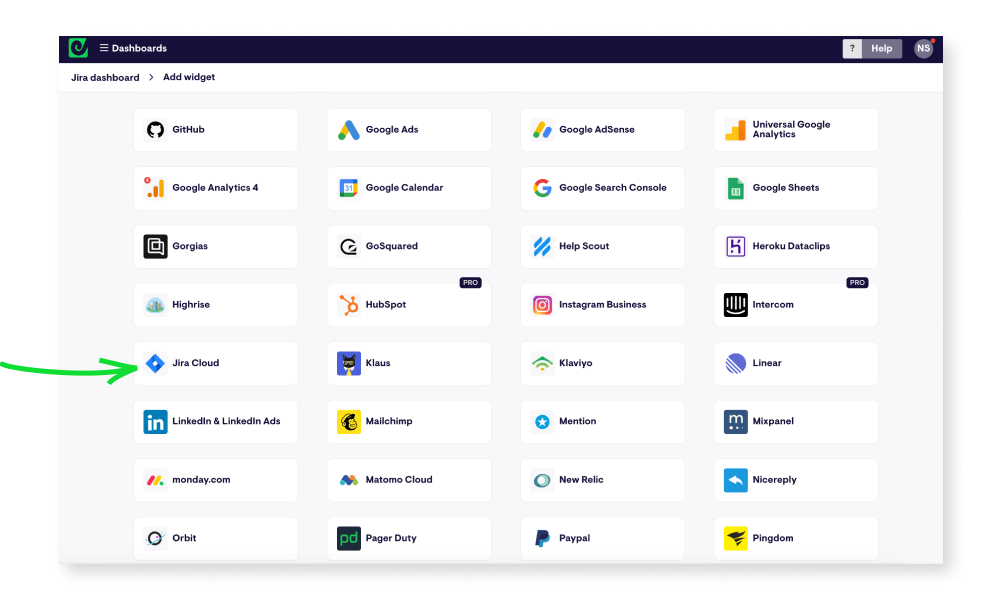
Once you’ve created a Geckoboard account the next step is to connect Jira so you can start visualizing your data. In Geckoboard’s list of data sources, select the Jira integration to get started.
Next, you’ll need to pick which type of widget - i.e data visualization - you’d like to add to your dashboard first. You can add several widgets to your dashboard as well as remove them later.
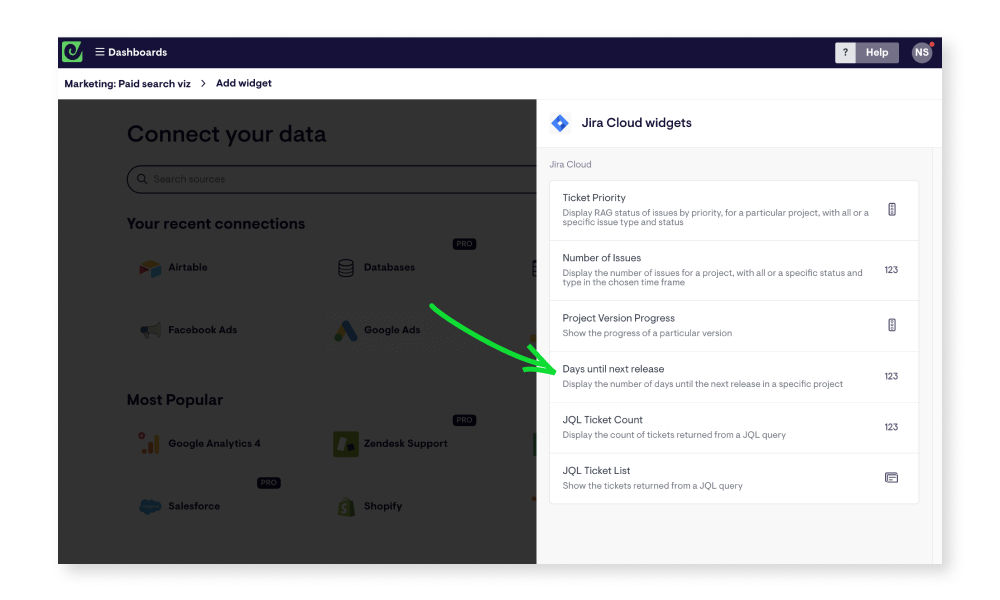
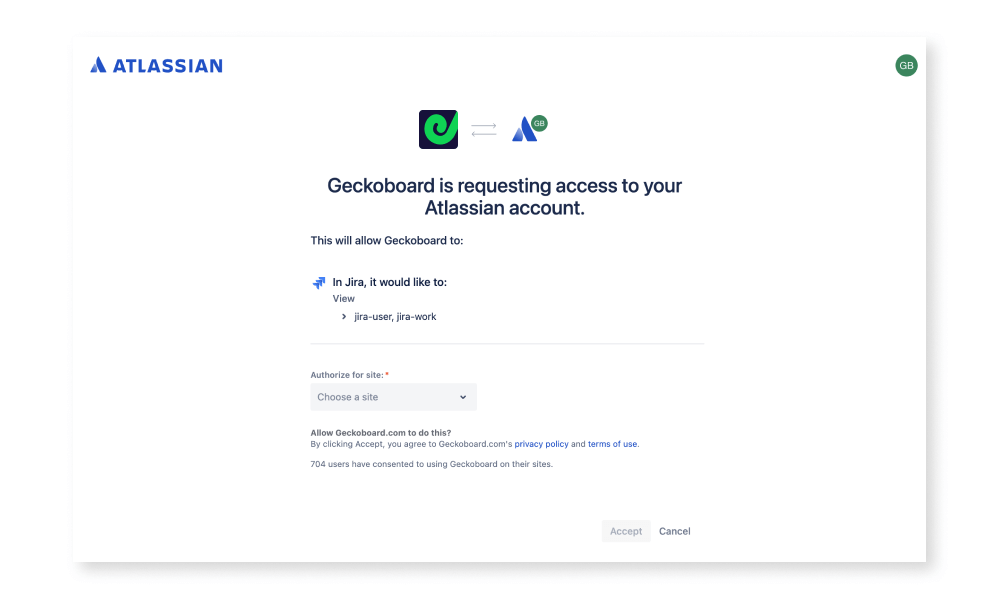
The first time you pick a widget, you’ll be asked to set up a secure connection between the two tools, either by logging in with your Atlassian account, or clicking ‘Accept’ if you’re already logged in.
Continue to set up your first widget by selecting the options presented, such as which Jira project or release you want to see data for, which issue type or status, and which time period you want to visualize.
On some widgets, you can even use Jira’s own query language - JQL - to build more detailed queries that will pull very specific data. This article has more information on how JQL works if you’re not familiar with it.
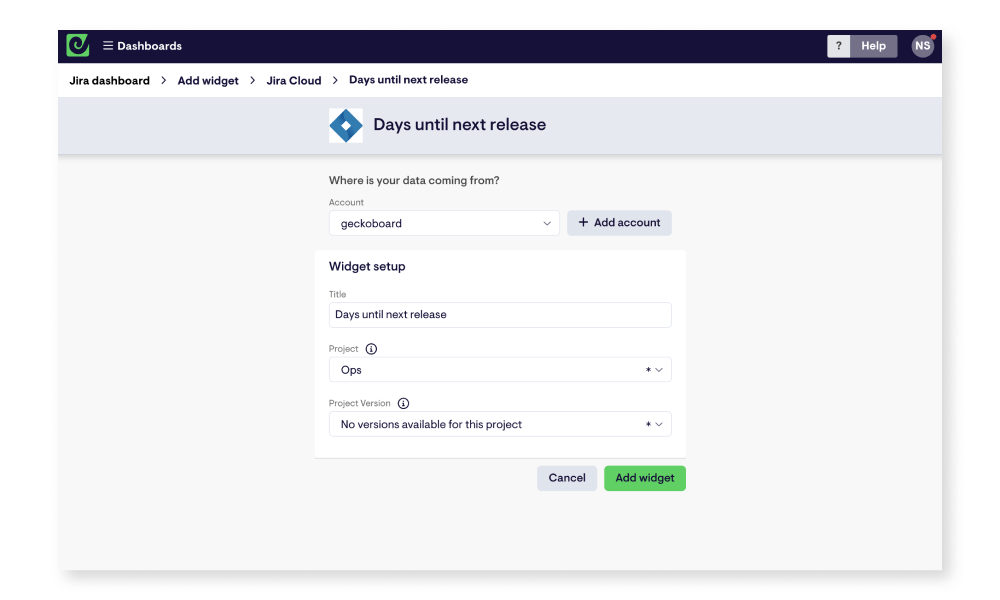
When you’re happy, click ‘Add widget’ to jump to your dashboard, which will now contain your first block of live data! Geckoboard’s Jira widgets refresh every 15 minutes automatically, so your dashboard will always display up-to-date information for whoever looks at it.
How to share your Jira dashboard
Repeat the steps above to build out the rest of your dashboard. Remember - you’re not limited to just visualizing data from Jira. You can add data from over 90 other data sources in much the same way.
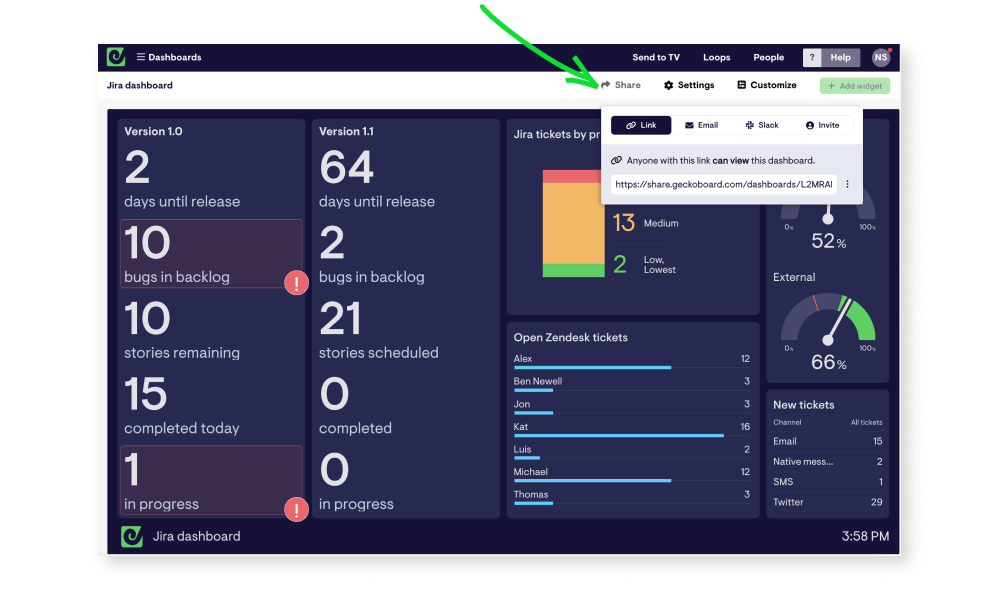
With your dashboard complete, you can make it easy to access for your team, stakeholders or yourself in a number of ways.
Click the ‘Share’ button in the top right of your account to find options to share your dashboard as a link, schedule snapshots of your dashboard to regularly send to Slack or over email, or invite others to join your account and view dashboards on mobile devices.
You also have the option to display your Jira dashboard on a TV or large screen in your workspace - something Geckoboard is especially suited for. To learn more about how to get your own live TV dashboard up and running, check out the overview here.
Hopefully this guide has given you a quick overview of how easy it is to create a custom Jira dashboard, and you’re feeling inspired to build your own. If you’re looking for a bit more Jira dashboard inspiration, check out our Jira Kanban dashboard example, or start a free Geckoboard trial using this link.
