Statistically, if you own or manage a website, you’re probably using Google Analytics. For countless business owners and marketers, Google Analytics is their go-to source for website performance data.
Google’s dominance in the analytics world looks set to continue, even as it currently migrates its 35 million customers onto Google Analytics 4 (otherwise known as GA4 – the new version of its product) by July 1 2023.
However, despite Google Analytics (GA) data being so readily available, many businesses don’t make the most of this free tool. That’s because GA metrics often stay buried within the platform itself. Only ever accessed – infrequently – by a small number of team members.
But what if your GA metrics could play a more important role within your team culture?
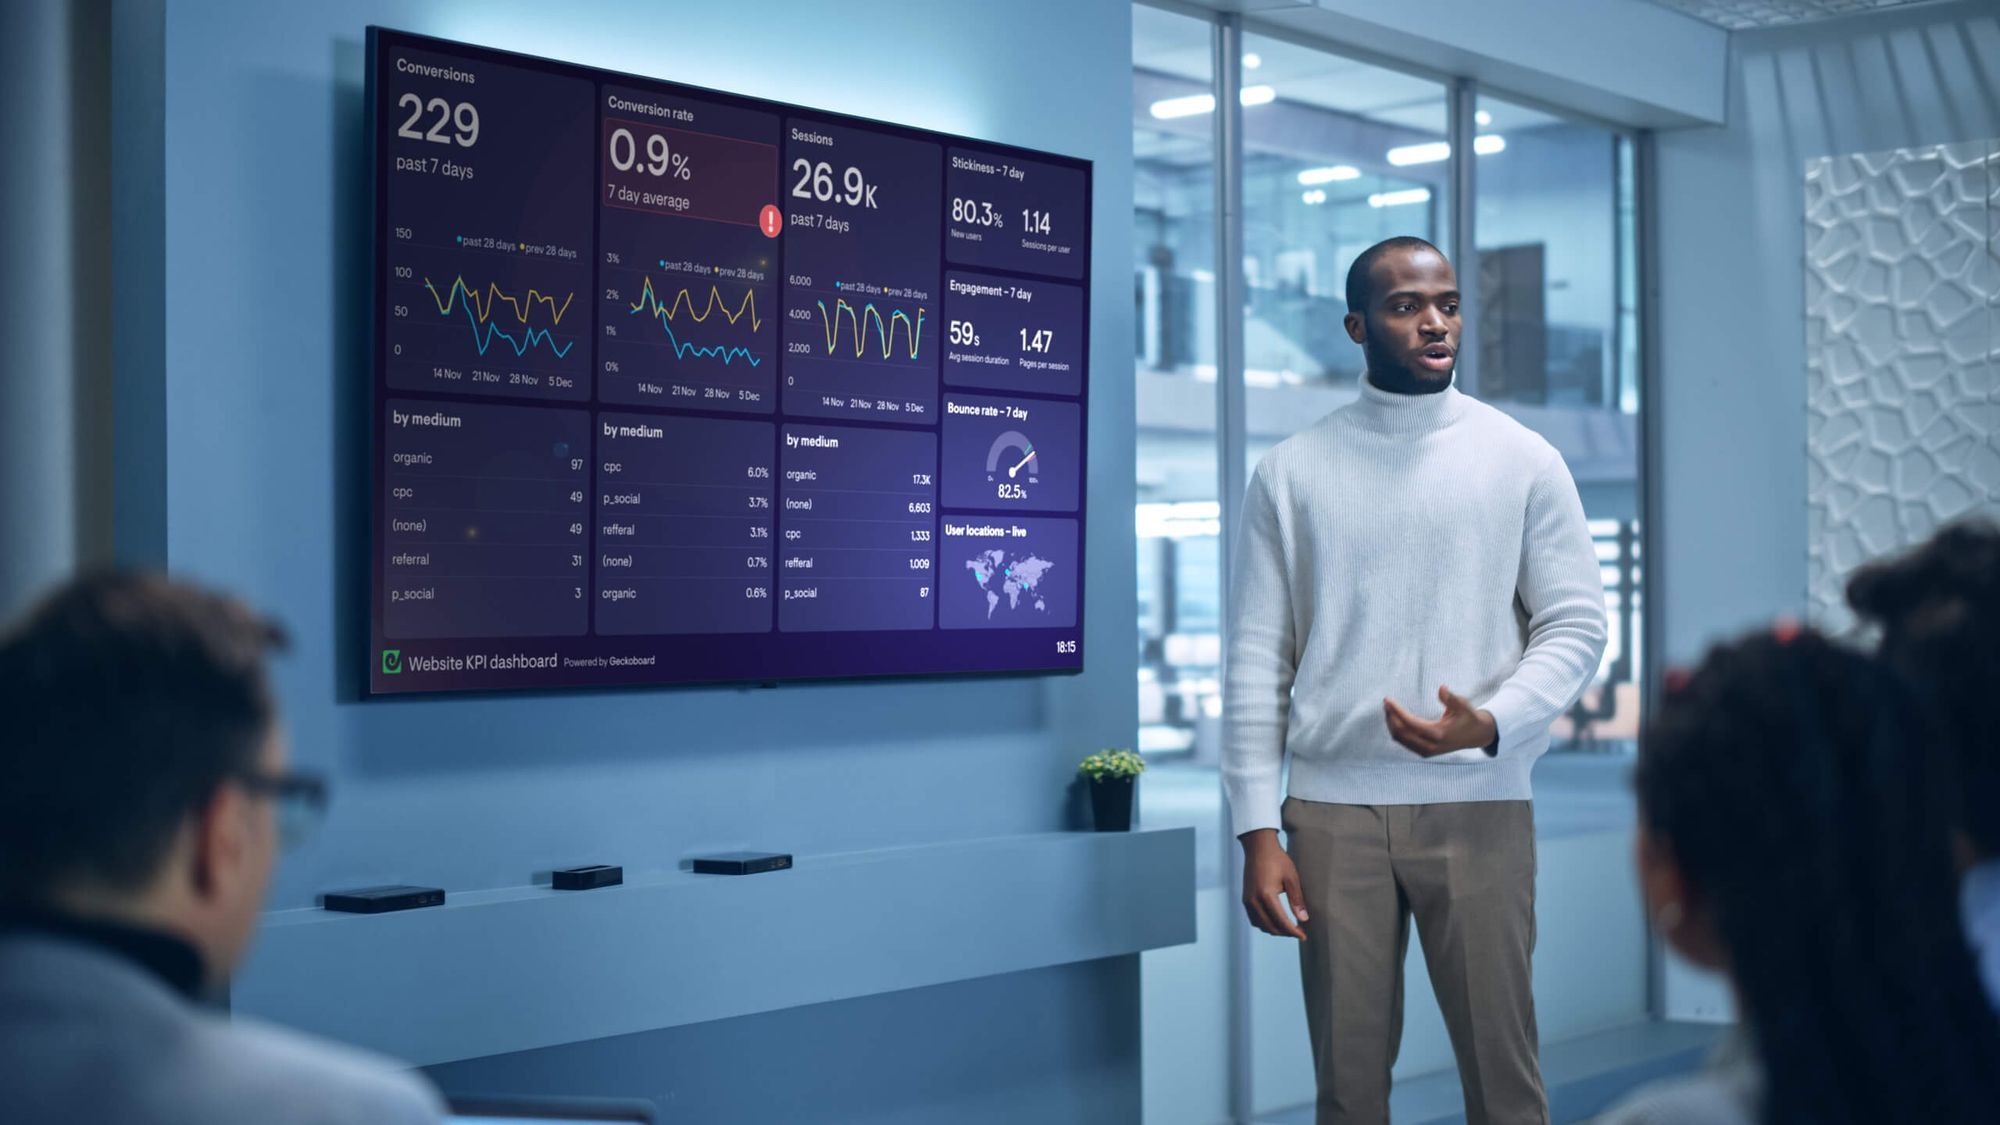
What if your website KPIs were displayed on a TV on the office wall where everyone could see them – from the marketing intern to the CEO?
Whether you’re using GA4 or still using the older Universal Analytics, in this article, we’re going to show you how to create a live TV dashboard for your website KPIs.
What are the benefits of displaying Google Analytics data on a TV display?
You shouldn’t underestimate the power of displaying your metrics via a TV dashboard. A live dashboard can create a feedback loop between team members and their key metrics, helping them see how their actions are affecting overall website performance.
This can have several benefits:
- Important changes (such as a sudden drop in users or conversion rates) are spotted quickly, meaning you can take action much earlier. No more waiting for that quarterly analytics report...
- Team members develop a greater awareness and understanding of website metrics, including how they behave over time.
- Goals and targets form a bigger part of team culture, increasing your team’s focus on their KPIs and how they can achieve them.
Why can’t I just display the Google Analytics platform directly via the TV?
Instead of going to the effort of creating a TV dashboard, you might ask: wouldn’t it be easier to just connect a TV to a browser, where I can already see Google Analytics?
It’s a nice idea, but doesn’t work for several reasons:
- Google Analytics isn’t optimized for TV display. It just doesn't look very good. Plus, in order to access most of the data, you need to interact with the platform by clicking and scrolling.
- It wouldn’t display live data. With most GA reports, you have to refresh the data manually. That means it’s not going to show real time data when you need it. Your session is also likely to time-out or log out if you leave it for too long.
- You can’t add important visual context like goals or status indicators
- You can’t display your data alongside metrics from other sources like Shopify or Salesforce.
Step-by step: Building a TV dashboard for Google Analytics
If you want to display Google Analytics on a TV, you need to use a 3rd party dashboard tool. There are many different options available, but ultimately you need a tool that connects to Google Analytics, especially Google Analytics 4 (plus any other data sources you wish to display such as Shopify, Salesforce or Zendesk).
You should also make sure the dashboard software is optimized for TV, meaning it can be displayed in full screen, doesn’t require interaction, can be understood at a distance, can be displayed indefinitely and can be updated remotely.
Fortunately, Geckoboard excels in all of these areas.
In the following step-by-step guide, we’ll show you how you can use Geckoboard to display your Google Analytics data on a TV.
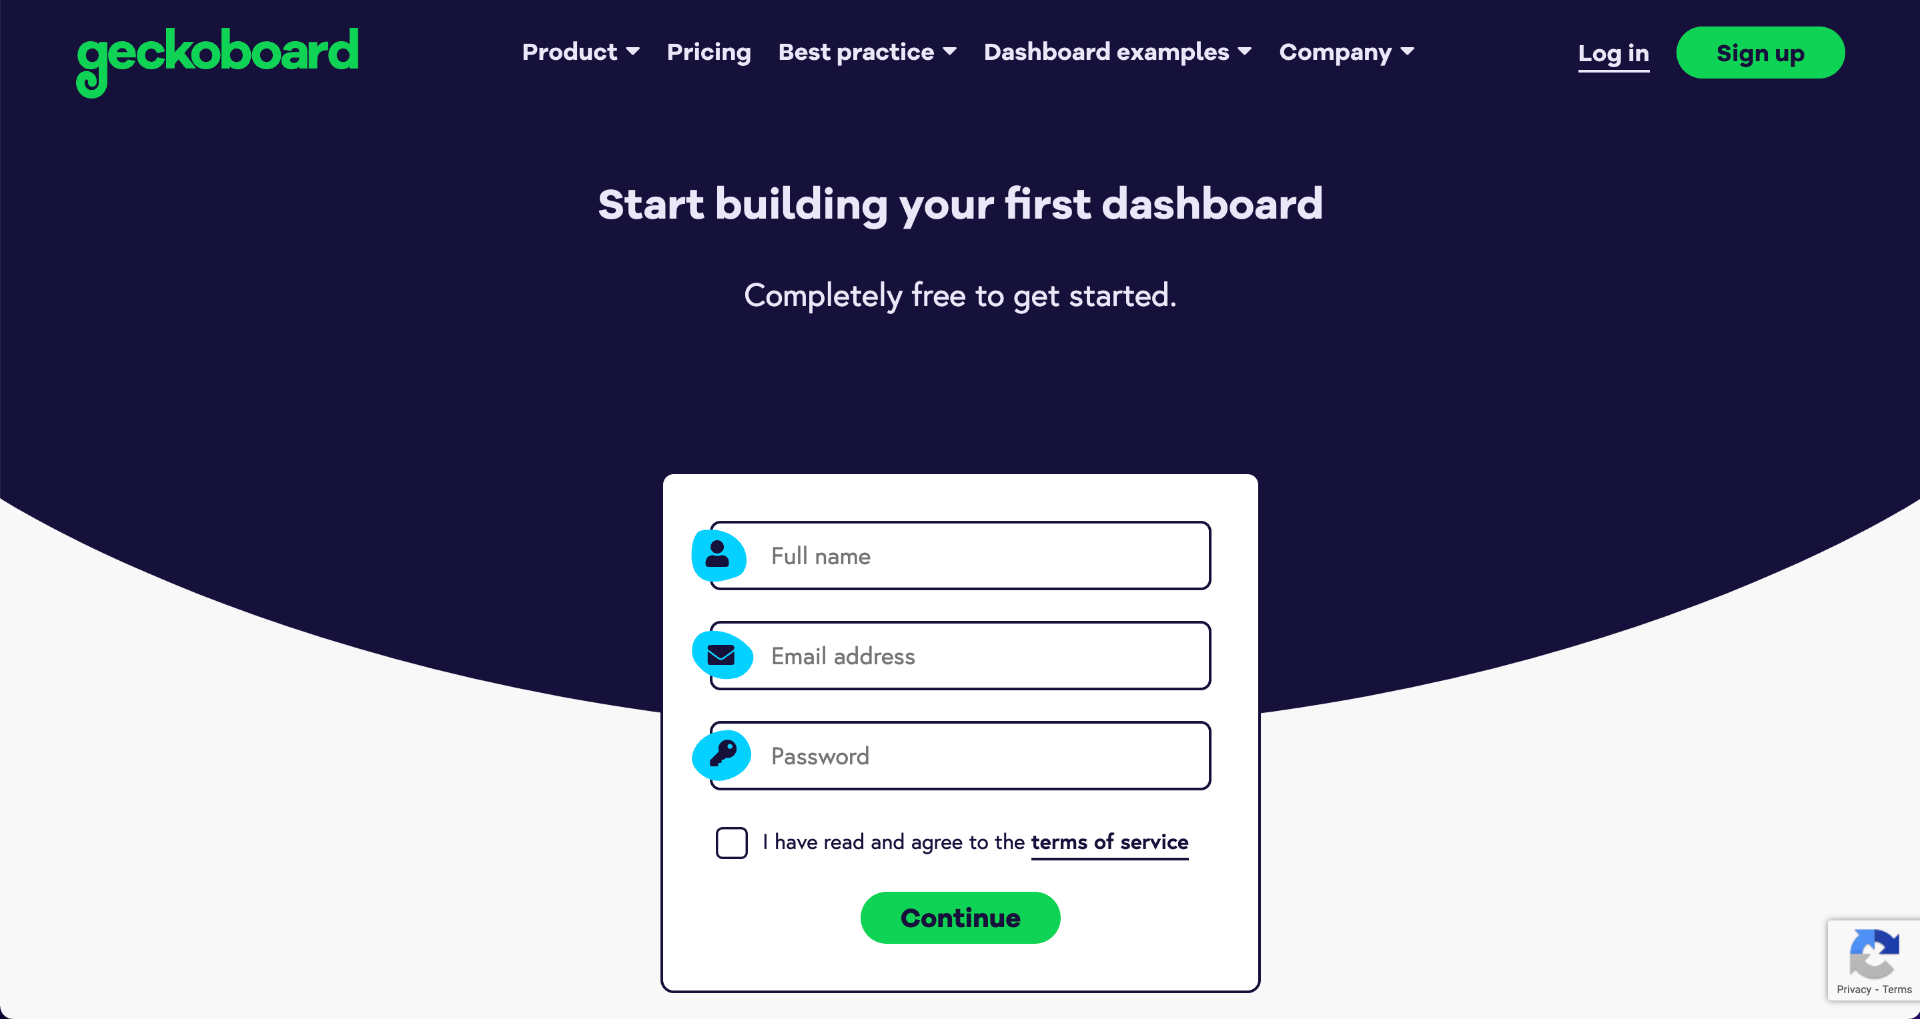
Step 1: Sign up to Geckoboard
Sign up for a 14-day free trial with Geckoboard – no credit details required.
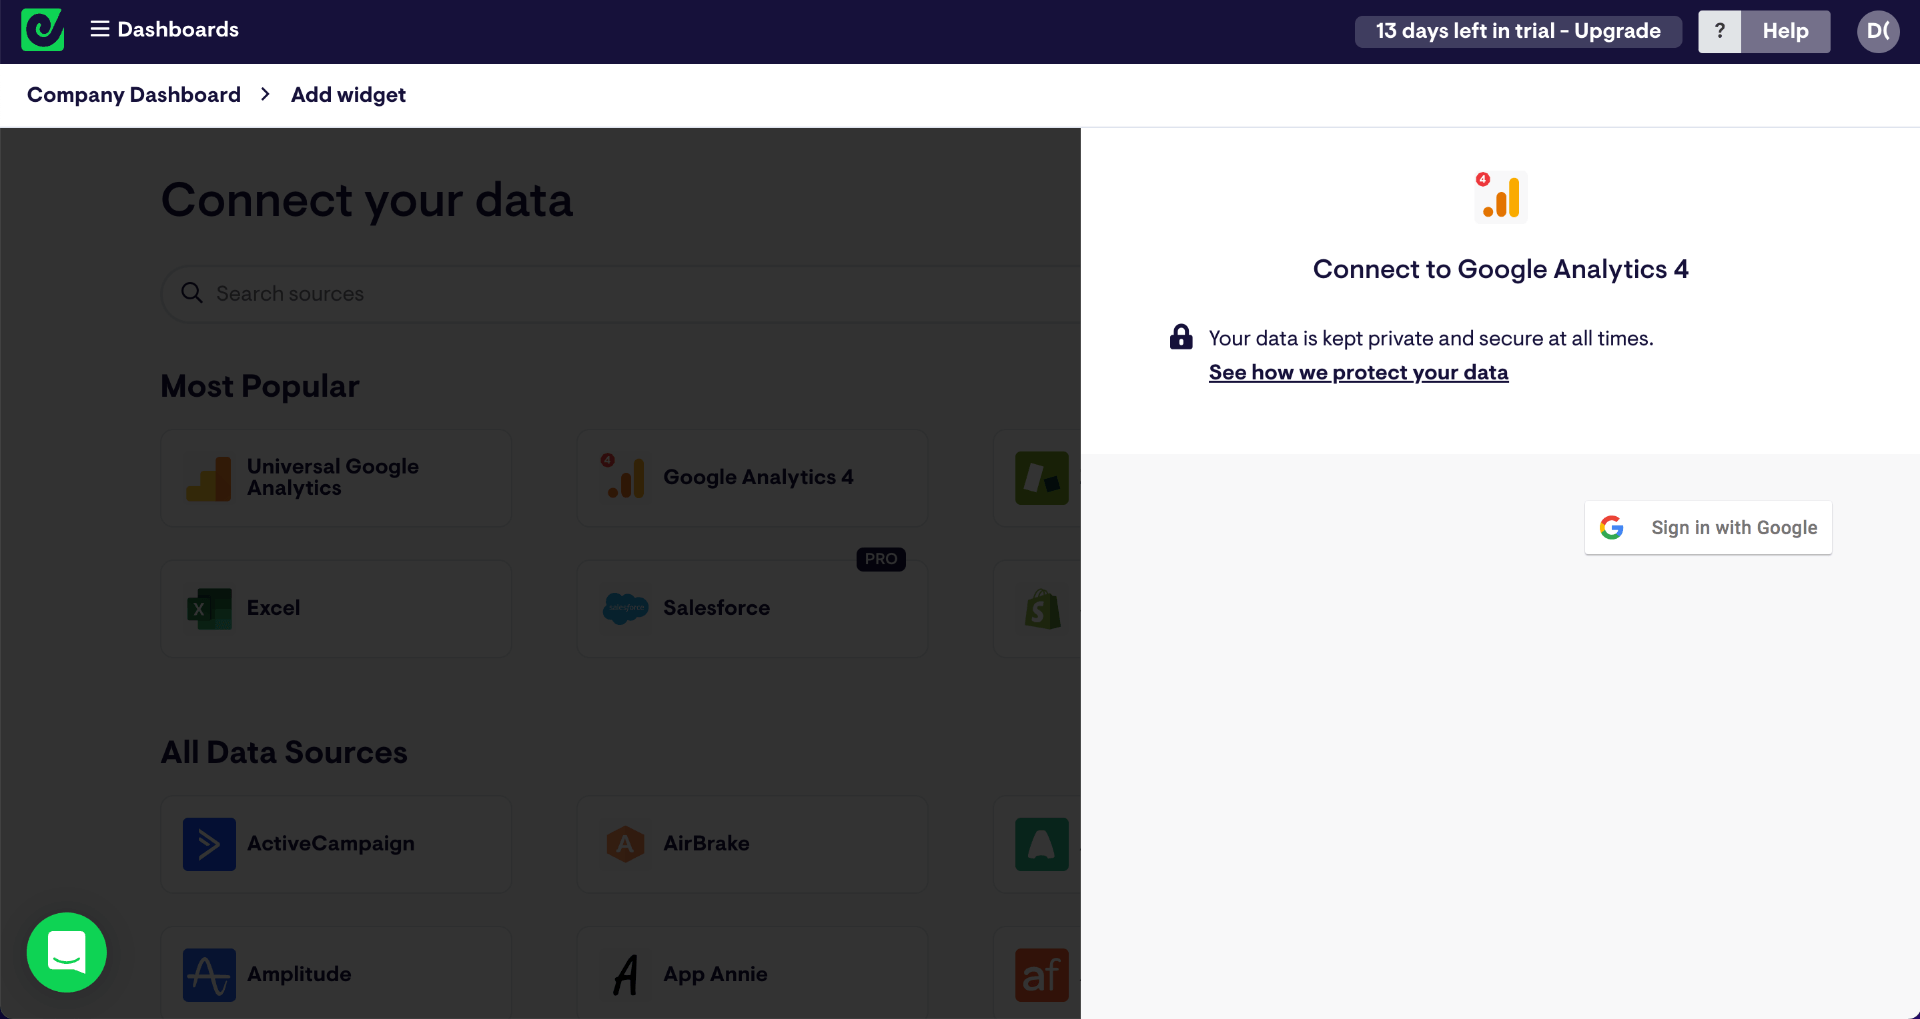
Step 2: Connect your Google Analytics account
To start building your dashboard, click ‘add widget’ and choose either Universal Analytics or Google Analytics 4. (We recommend using Google Analytics 4 if you’ve already set it up – because Google will be discontinuing Universal Analytics on 1 July 2023.)
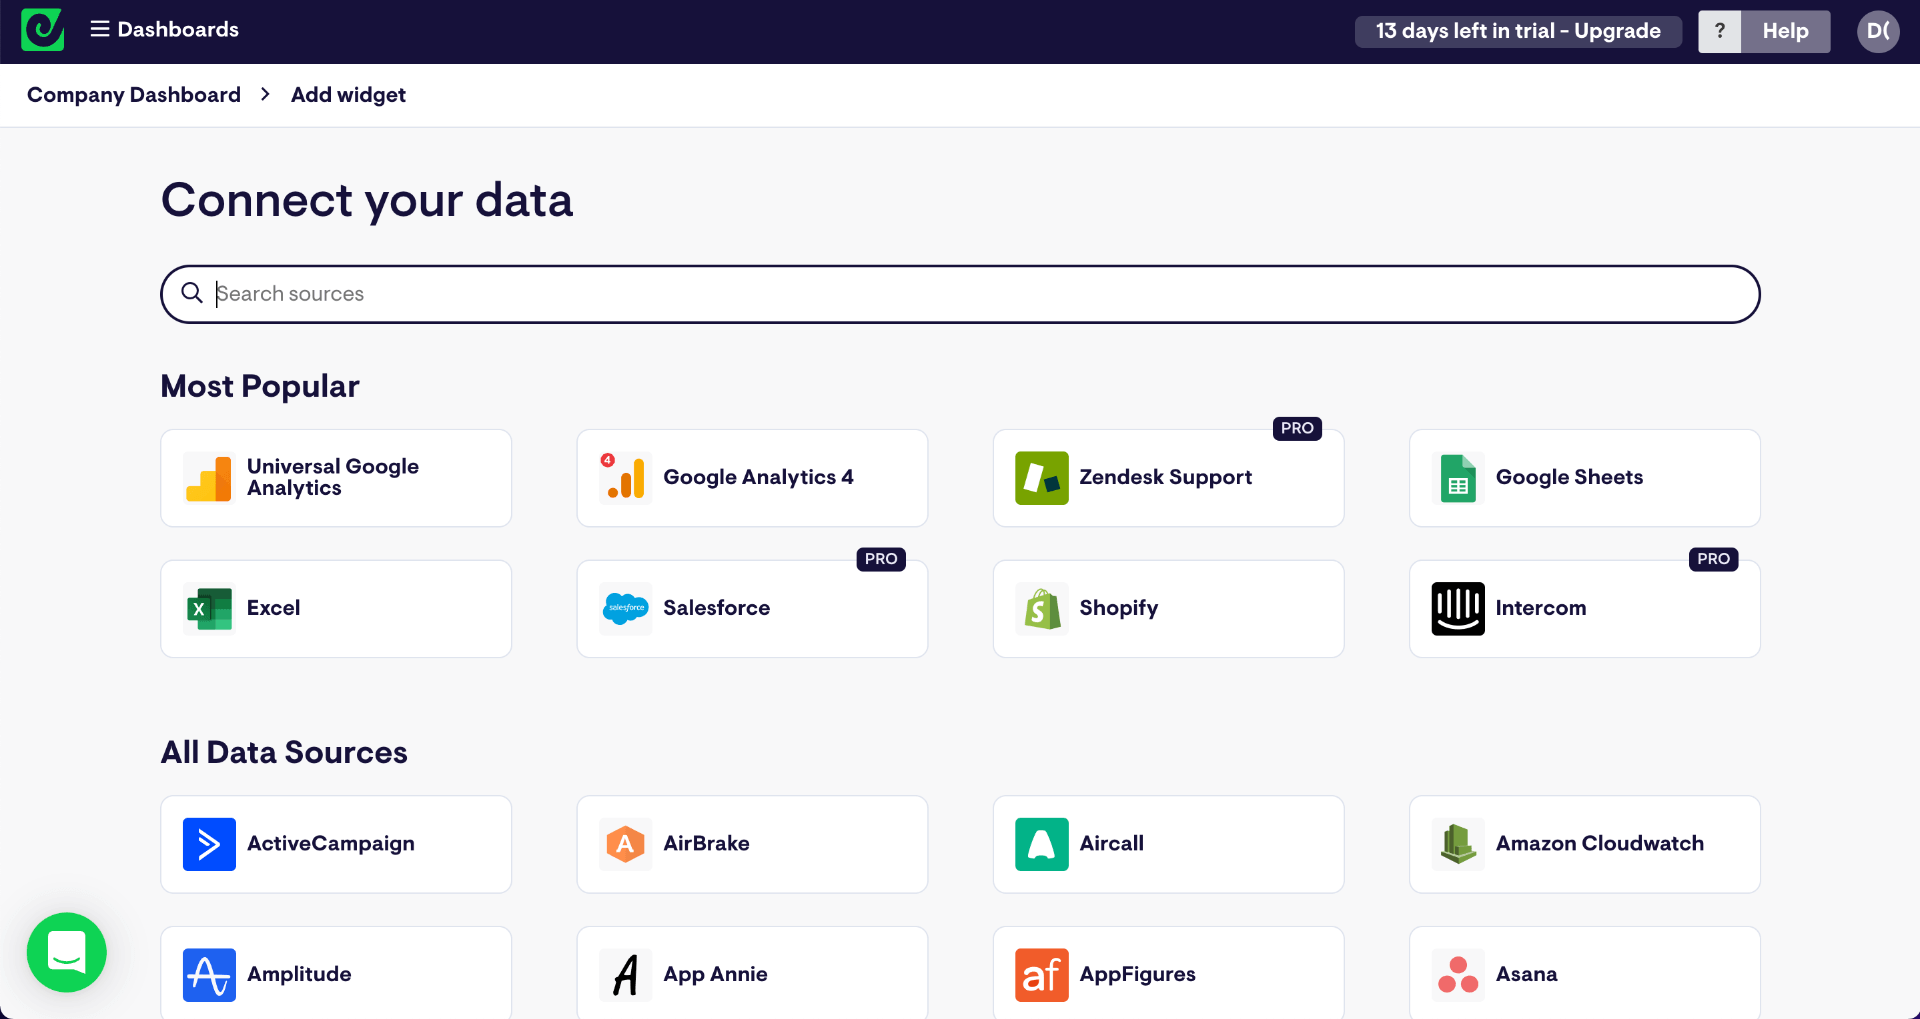
Choose any of the widget options to get started, then sign in with your Google account to create your connection to Geckoboard.
Step 3: Add a widget to your dashboard
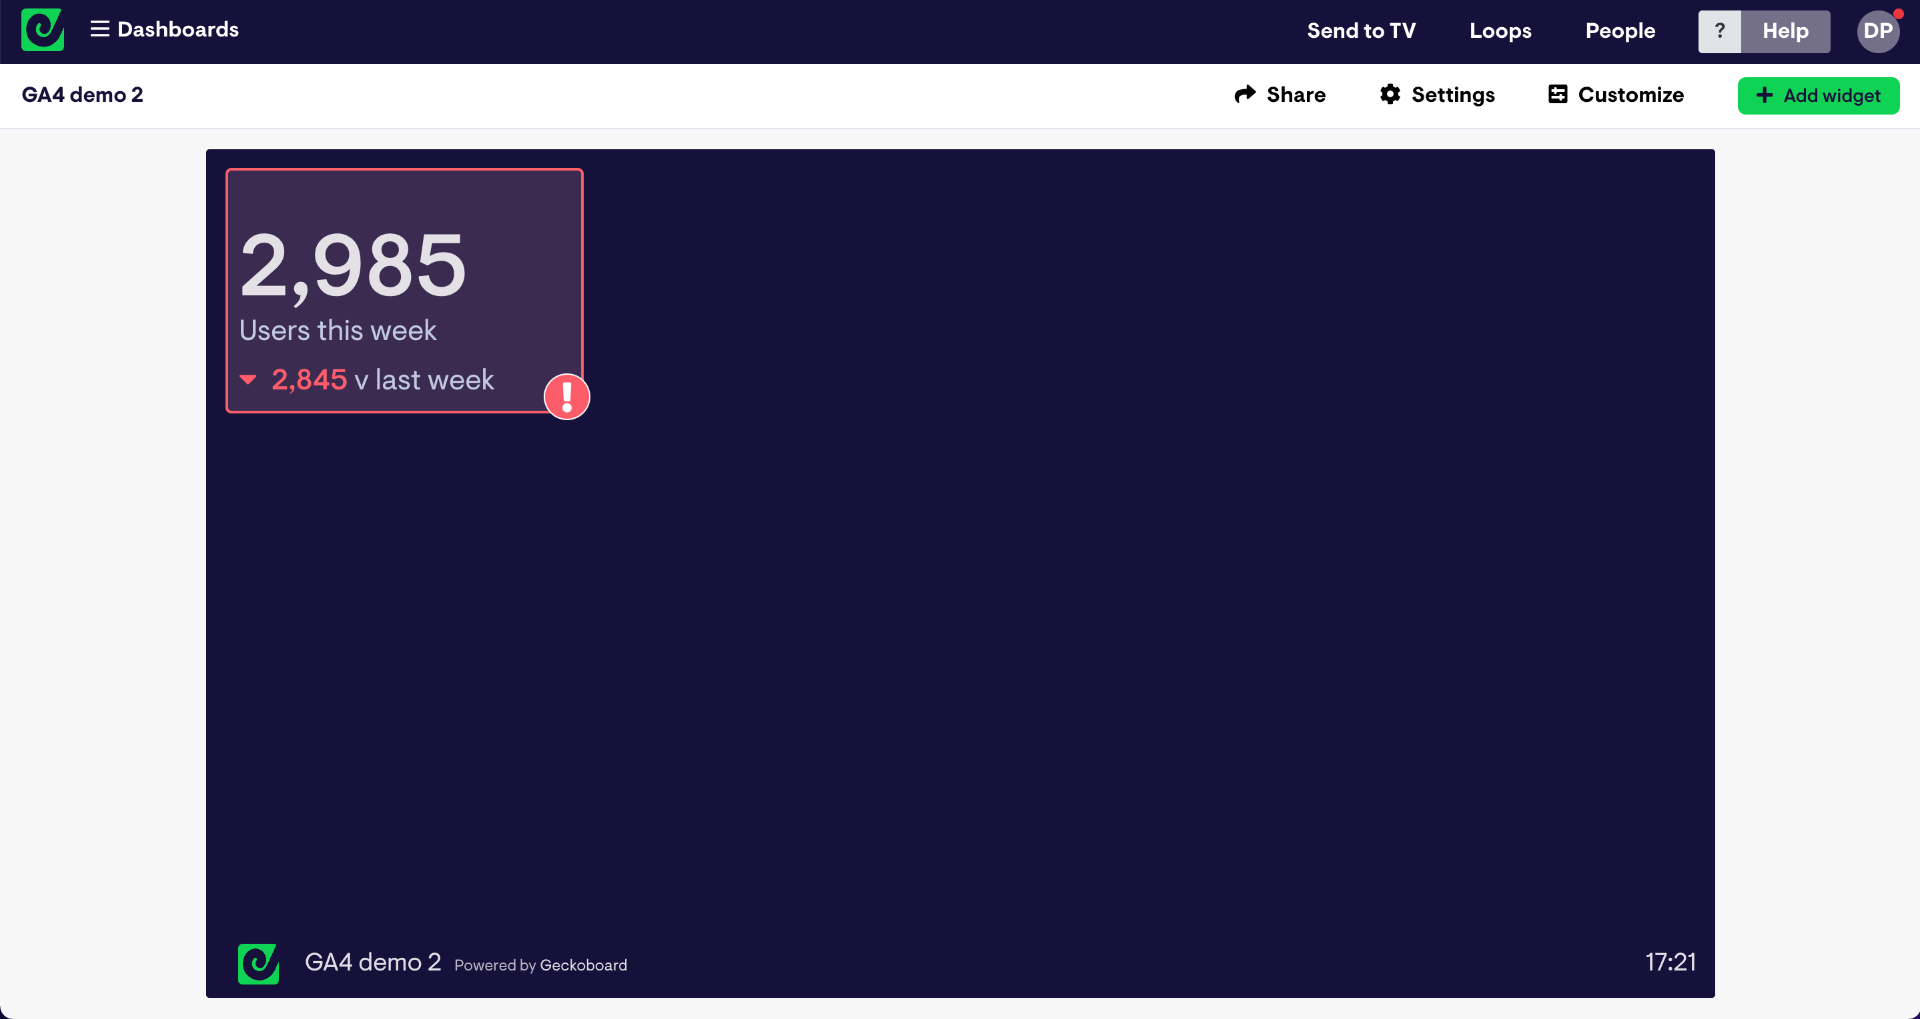
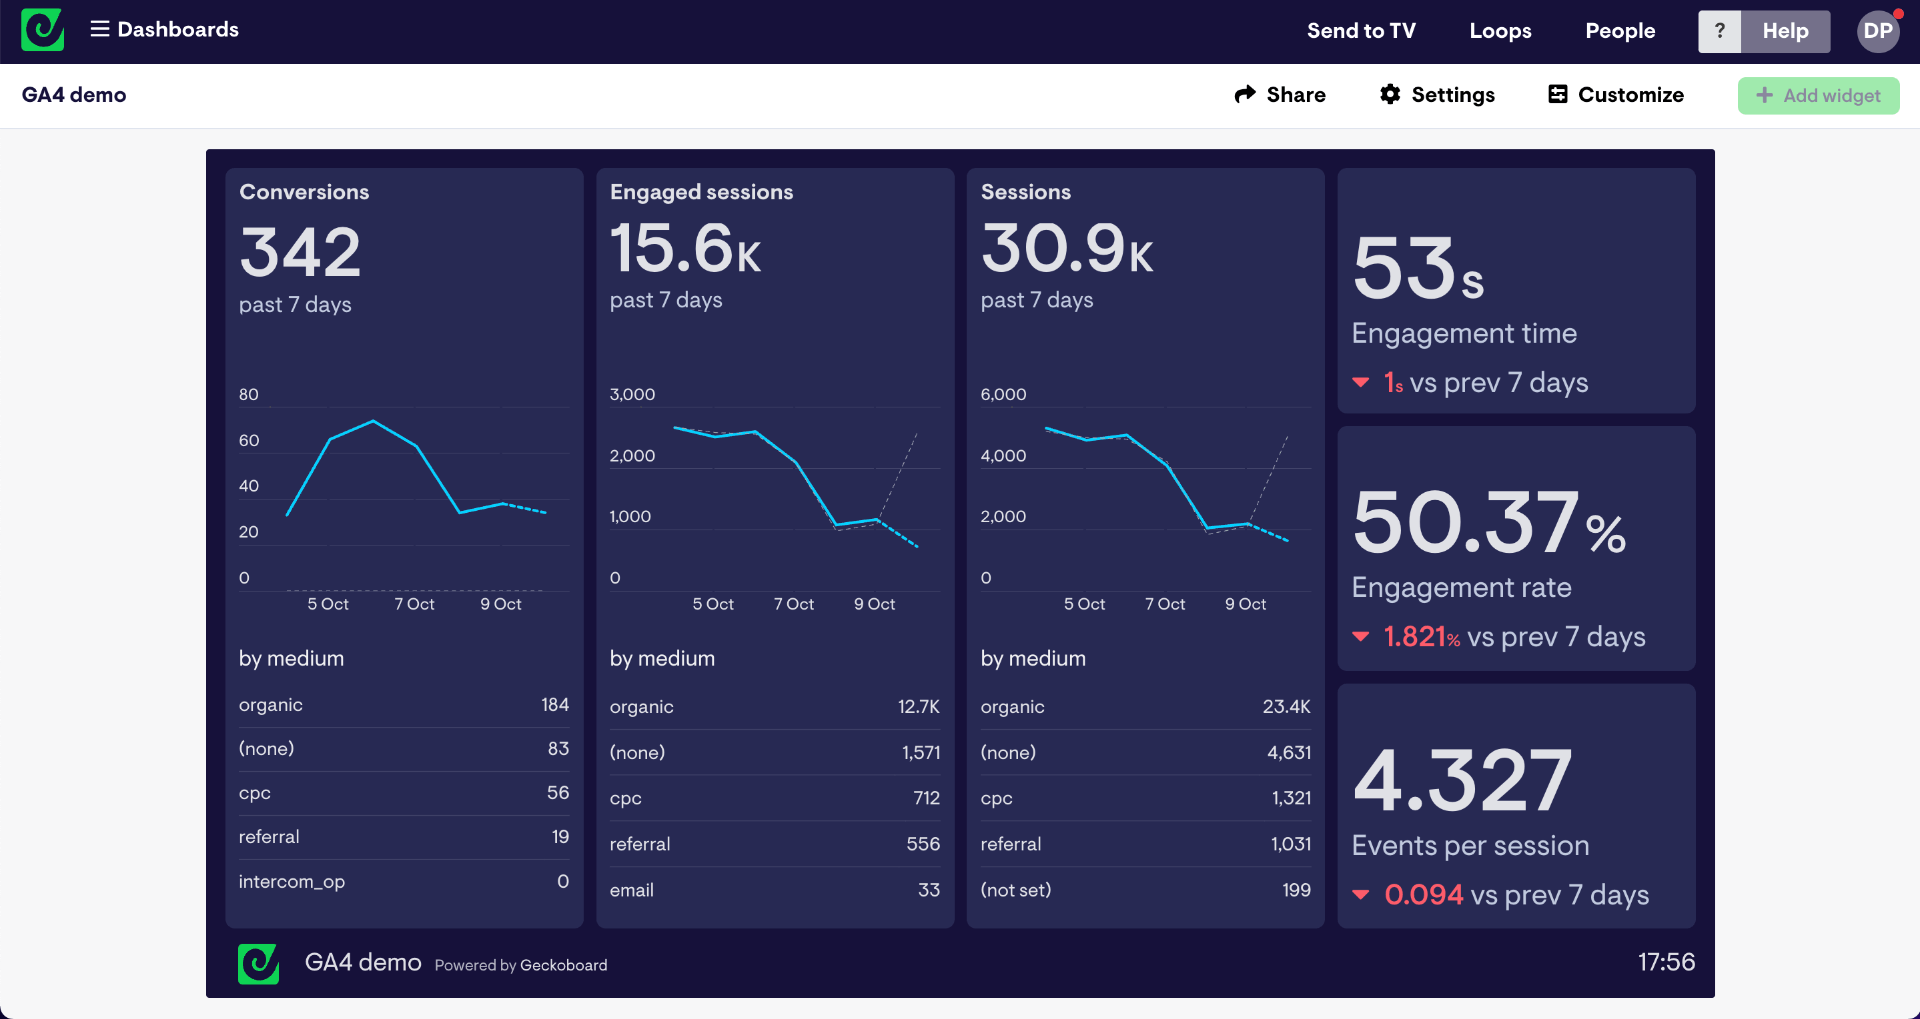
Once you’ve connected your data, you can start building widgets in Geckoboard. (A widget is just a name for a data visualization: such as a number, a bar chart, a line chart or a leaderboard.)
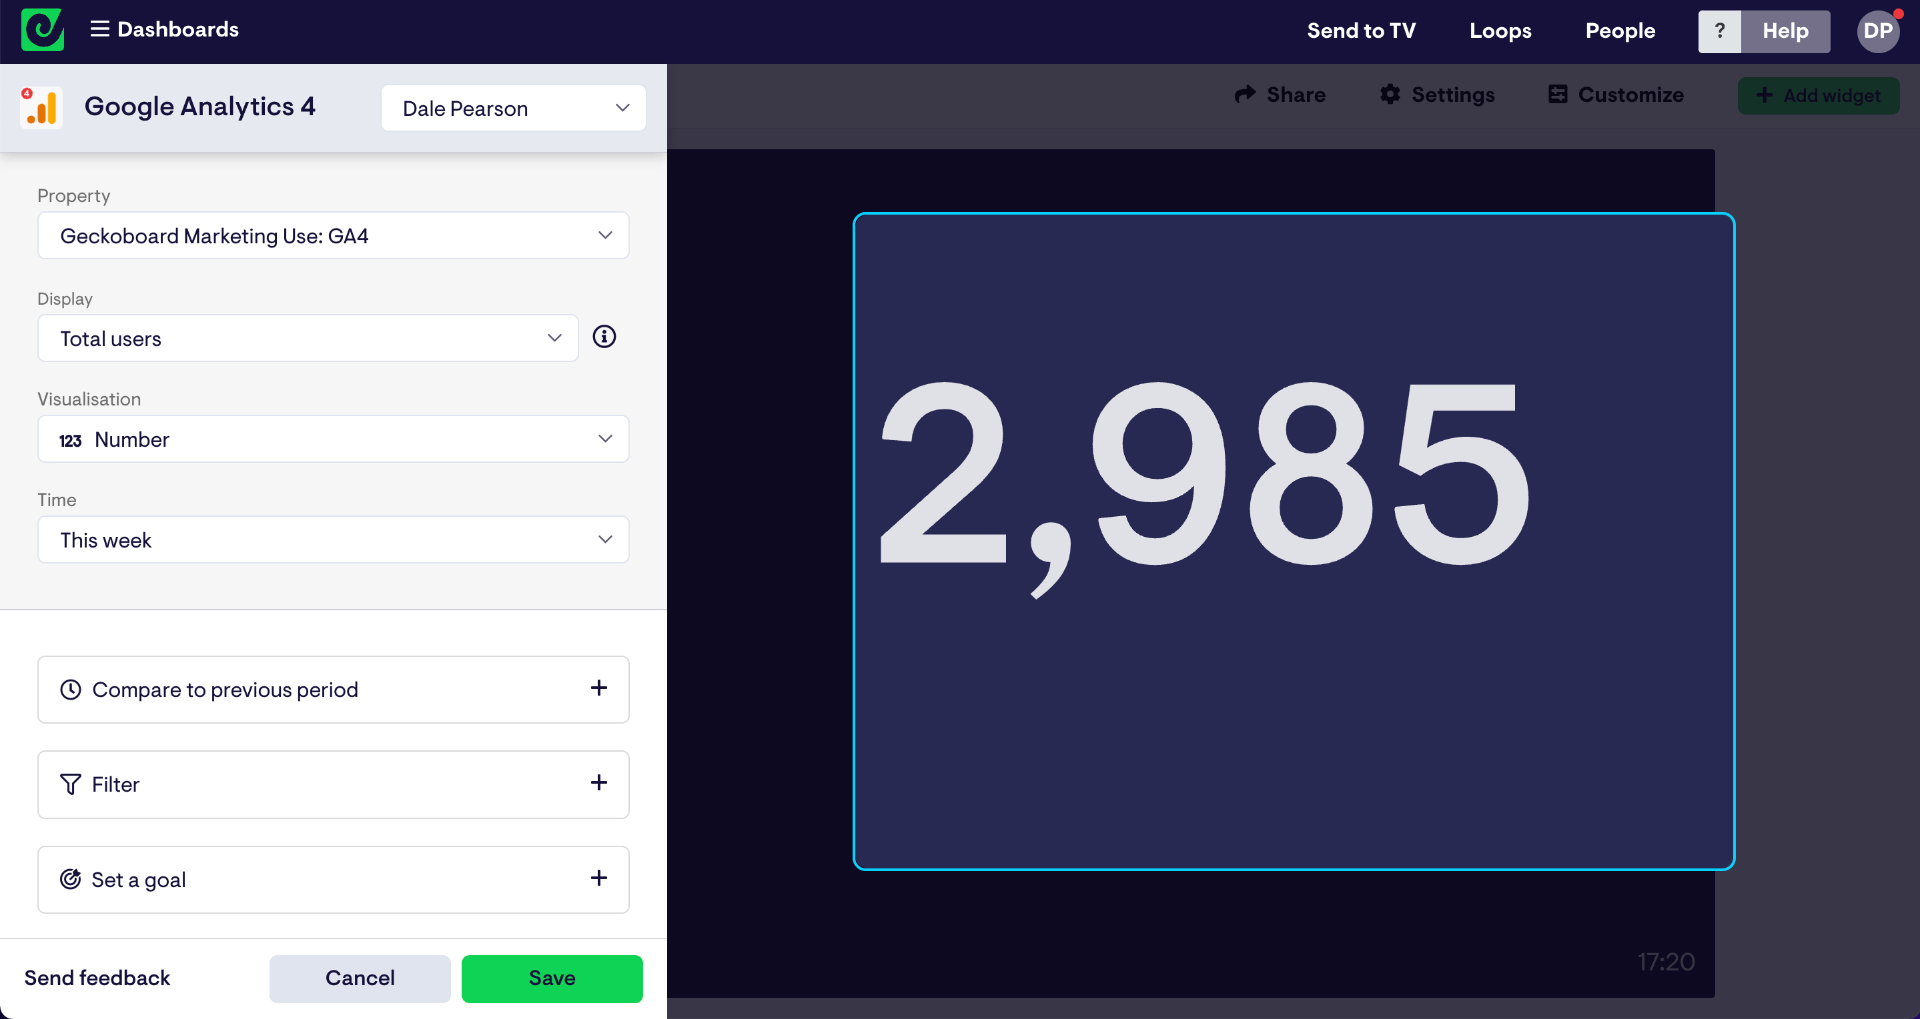
You can add context to your widgets in the form of goals, comparisons and status indicators. This helps anyone looking at the dashboard to understand whether metrics are good, bad, normal or unusual.
Step 4: Add more widgets and build up your dashboard
Once you’ve got the hang of building widgets, you can start to build up your dashboard. Move widgets around, make them bigger, or even combine them into groups by simply dragging and dropping them.
Your dashboard should present the most important metrics to you and your team. These might include the number of website visitors, events and conversion rates. Try not to overload your dashboard with too much information. It should be easy to understand, at a glance.
Step 5: Share your dashboard virtually
Before we look at how to display your dashboard on a TV, you should explore some of the other sharing options available. These include creating a live sharing link, so you can view your live dashboard from any browser, and scheduling regular snapshots of your dashboard to email and Slack.
This is a great way to keep your dashboards visible for remote teams or when people are working from home.
Step 6: Choose the right hardware for your TV dashboard
In order to display your Google Analytics dashboard on a TV, you will need the following hardware:
- A TV screen – any HD TV should work. You can also use a computer monitor but these tend to be smaller and more expensive.
- A small computer (one that can run a modern browser like Firefox or Chrome). We say small because ideally it should be small enough to be stored discreetly behind the TV. We recommend a PC stick or Raspberry Pi, which are small and inexpensive.
- A HDMI lead to connect your screen to your computer.
We’ve put together a complete guide to choosing the right TV dashboard hardware here. Including why we don’t recommend using a Smart TV, Amazon Firestick or casting device to power your TV dashboard.
Step 7: Setting up your hardware
Once you have your hardware, it’s time to set it up.
Positioning your TV
You should think carefully about where you are going to display your dashboard – who needs to see it? And how easily will they be able to see it from where they work?
Kiosk mode
We highly recommend you set up your computer device in kiosk mode. Kiosk mode configures the device so that it runs a single application when it’s turned on, effectively meaning it will always open on your dashboard, every time the device is booted up.
We’ve created some step by step guides to setting up Windows devices and Raspberry Pi in Kiosk mode.
Step 8: Connect your Geckoboard dashboard
Using a different computer, log in to Geckoboard, select ‘Send to TV’ and follow the instructions.
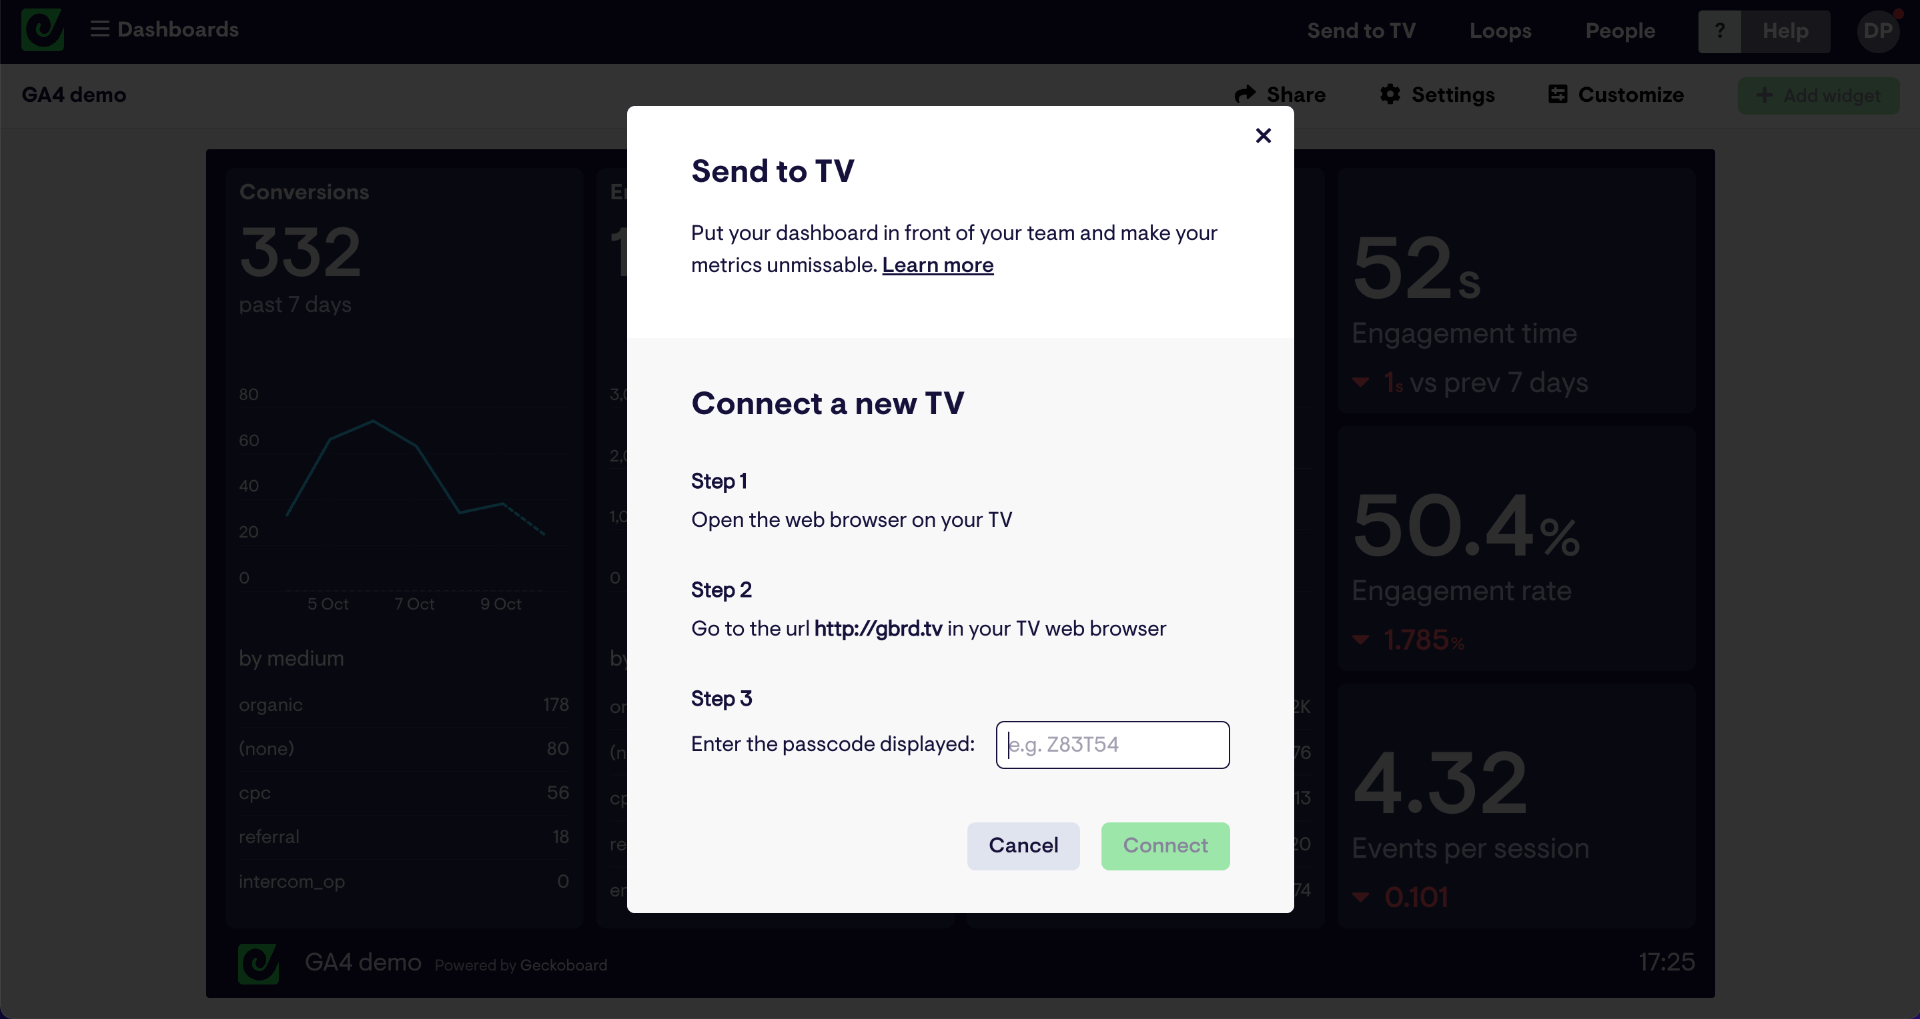
Here you can manage your TV connections, connect a screen using a short URL and passcode, and even choose several dashboards to be displayed on a loop.
We hope you found this guide useful. Click here to start your free trial with Geckboard and create dashboards for Google Analytics and over 80 other different data sources.
