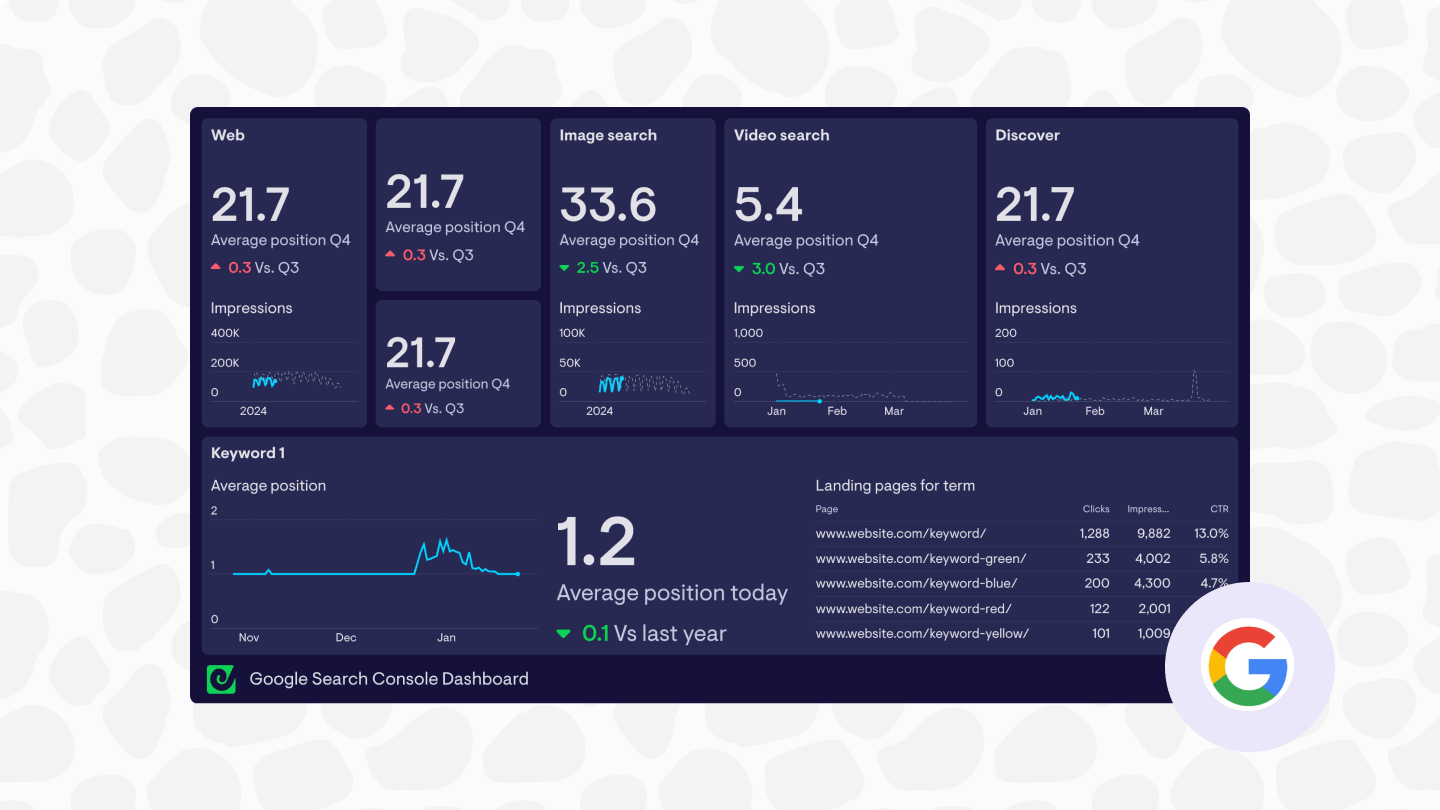
As most digital marketers know, Google Search Console contains an abundance of information and data relating to how Google sees and ranks your web properties.
But for all the insights it can deliver if you take the time to dig around, it takes a lot of mental bandwidth to keep on top of all the relevant information in there. If you happen to be restructuring your website, producing content at a high rate, or juggling multiple web properties, the information overload compounds.
So - what to do? The data in Search Console is too valuable to ignore. And time-boxing your analysis to once a month or even once a week could mean you miss important changes in your rankings or other metrics that require rapid action.
The answer could well come in the form of a custom, real-time dashboard, fully tailored to make relevant Search Console KPIs unmissable. With a little set up (we’re talking minutes here), this can drastically reduce the amount of time you spend checking up on your website in GSC, reduce information overload and give you a powerful early warning system that highlights any metrics that need your attention.
Using Geckoboard - the dashboard software in this example (which we happen to make) - you’ll also be able to add live KPIs from a selection of over 90 other tools to help you monitor metrics from across your marketing funnel.
This quick guide will show you how.
What you'll need to build your own Search Console dashboard
Creating your own search console dashboard can take as little as 15 minutes, even if you’ve never built a dashboard before. You’ll need a few things first though:
- A Google Search Console account: Follow the instructions here to set one up if needed
- A Geckoboard account: Click here to set a free trial up (no payment details required)
How to create your Google Search Console dashboard
To begin with, you’ll need to set up a connection between GSC and Geckoboard so you can start visualizing live data from your account.
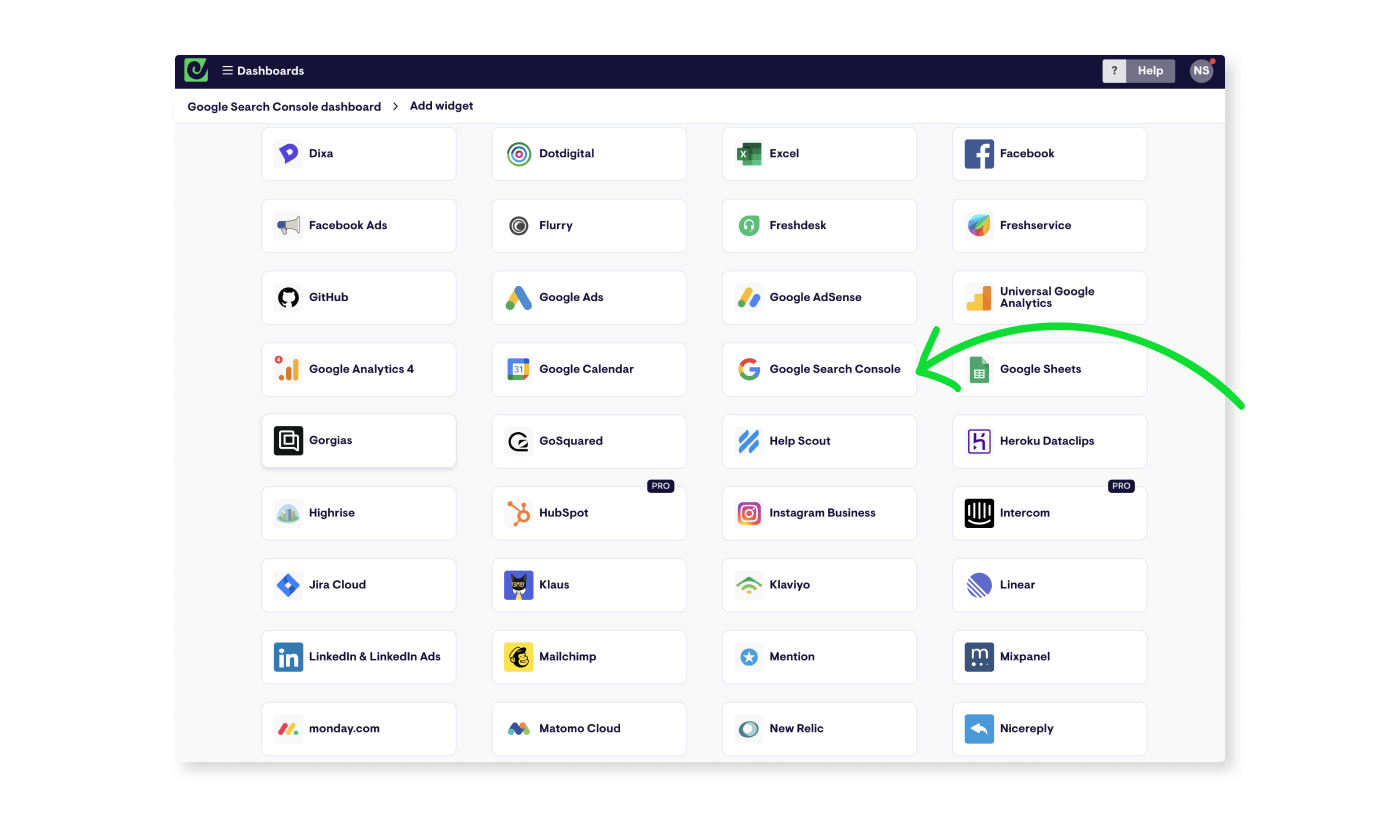
From Geckoboard’s list of data sources, select the Google Search Console integration to get started.
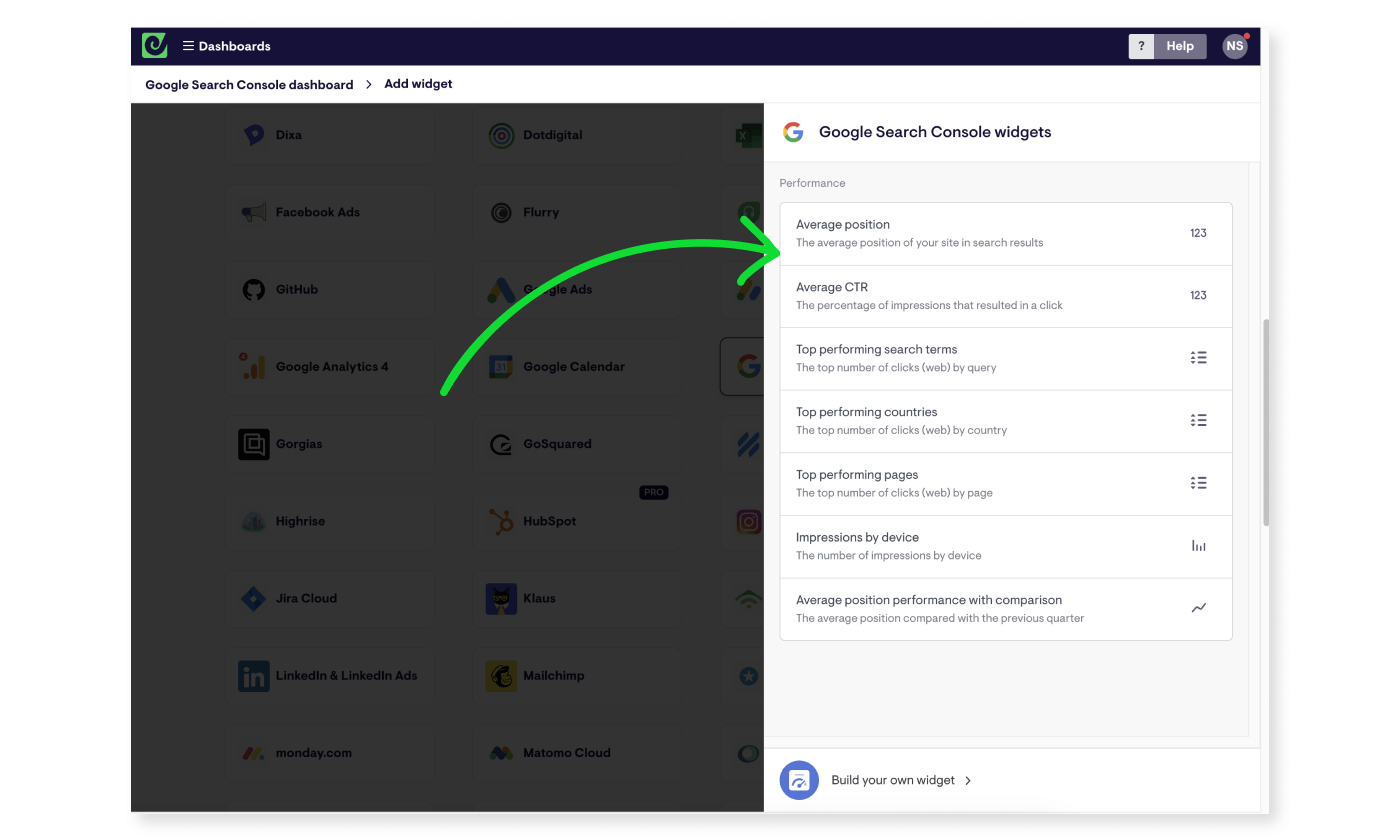
Next, pick a metric from the list of popular Search Console metrics.
The first time you do this, you’ll be asked to set up a secure connection between the two tools by logging in with the Google Account associated with your Google Search Console account.
Continue to set up your first widget by working through the options presented and setting:
- Site: Which website you want to display data for
- Search type: Web, image, video, news, discover
- Display: The metric you want to display
- Visualization: Choose from a simple number, gauge, line chart, column chart, bar chart, leaderboard or table visualization
- Time: The time period you want to visualize, ranging from this year, down to today, or a custom time period
On some metric and visualization combinations you can also add:
- Comparisons: show how a metric has changed over a time period
- Filters: dial your metrics in for specific pages on your site, search terms, countries and device categories
- Split by: show more detail on your visualization for specific pages, search terms, countries and device categories
- Goal: add a goal or target value
- Formatting: Adjust the way numbers are displayed, such as how many decimal points to use
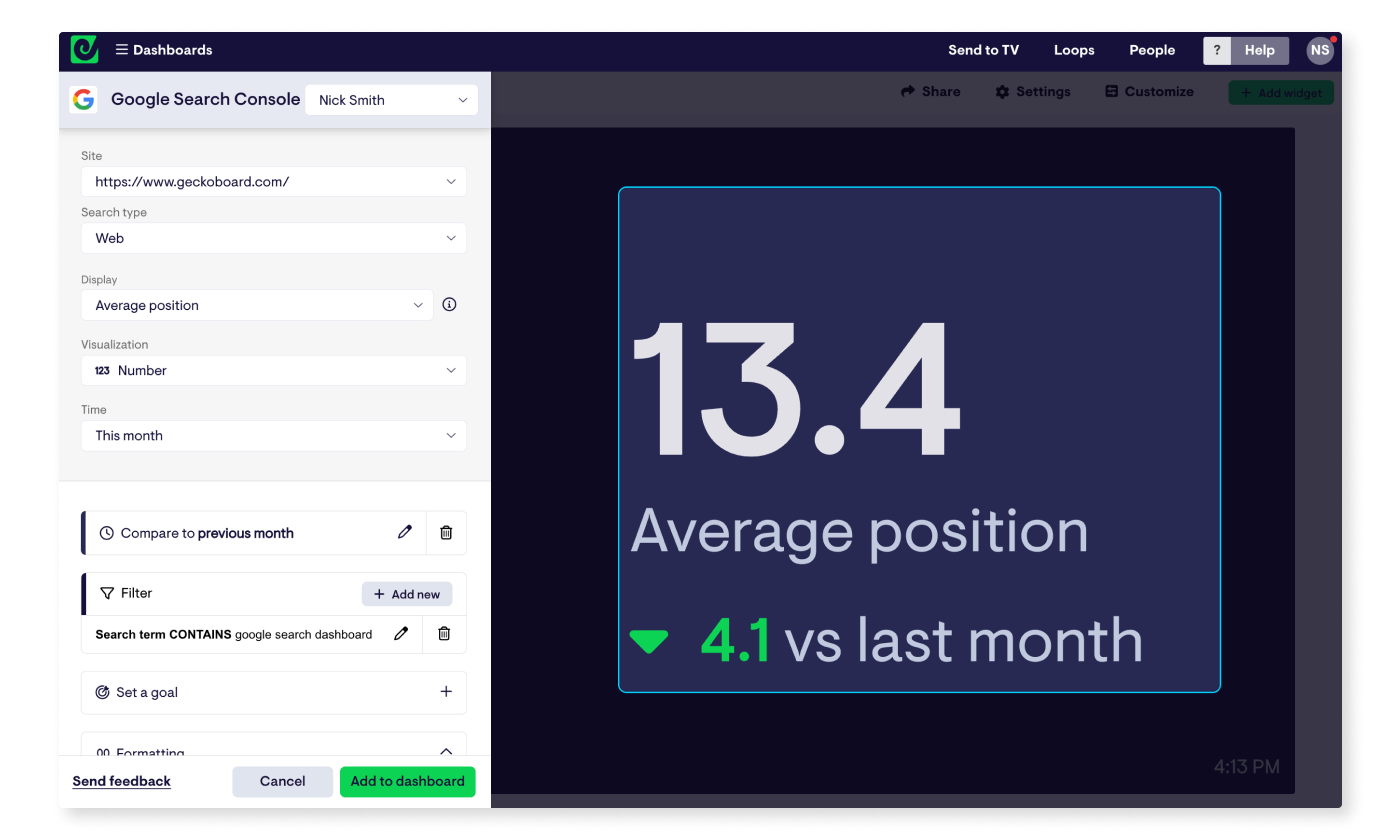
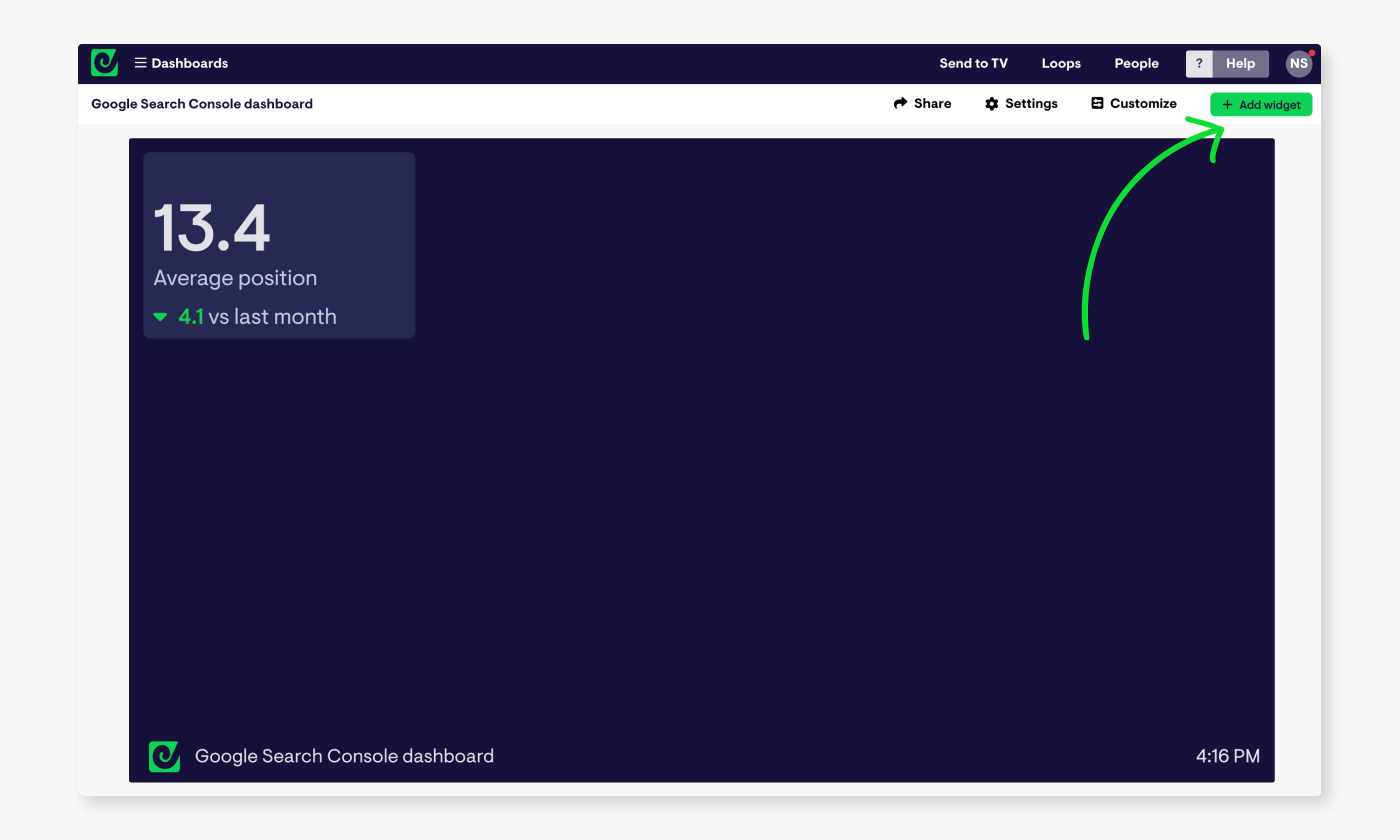
When you’re happy, click ‘Add widget’ to jump to your dashboard, which will now contain your first block of live data! Geckoboard’s Google Search Console widgets refresh every 10 minutes automatically, so your dashboard will always display up-to-date information.
Adding data from other sources
Geckoboard’s Search Console integration allows you to add a range of metrics, including average CTR, Average position, clicks and impressions.
You’re not limited to these on your dashboard though. Connecting Google Analytics to Geckoboard, for example, lets you add metrics like sessions, conversions, event counts, engagement rate and a lot more, right alongside your Search Console KPIs.
You can also connect over 90 other data sources, such as Google Sheets, Excel, LinkedIn, HubSpot, MailChimp, LinkedIn Ads and Facebook Ads, to create dashboards for monitoring every aspect of your digital marketing activity.
All these work in much the same way as the Google Search Console integration - from your dashboard click ‘Add widget’, select a data source, and follow the instructions to set up a connection and build a widget.
It’s also worth mentioning - you can also connect several Search Console accounts to Geckoboard, meaning if you’re managing several websites - for different clients or brands for example - you can pull metrics together into one view for easy access.
Speaking of easy access…
How to access and and share your dashboards
Once you’ve built out a dashboard you’re happy with, there are a few ways you can make it quick and easy to refer to, whether it’s just for your own monitoring process, or you wand to share GSC metrics with your team, stakeholders or clients.
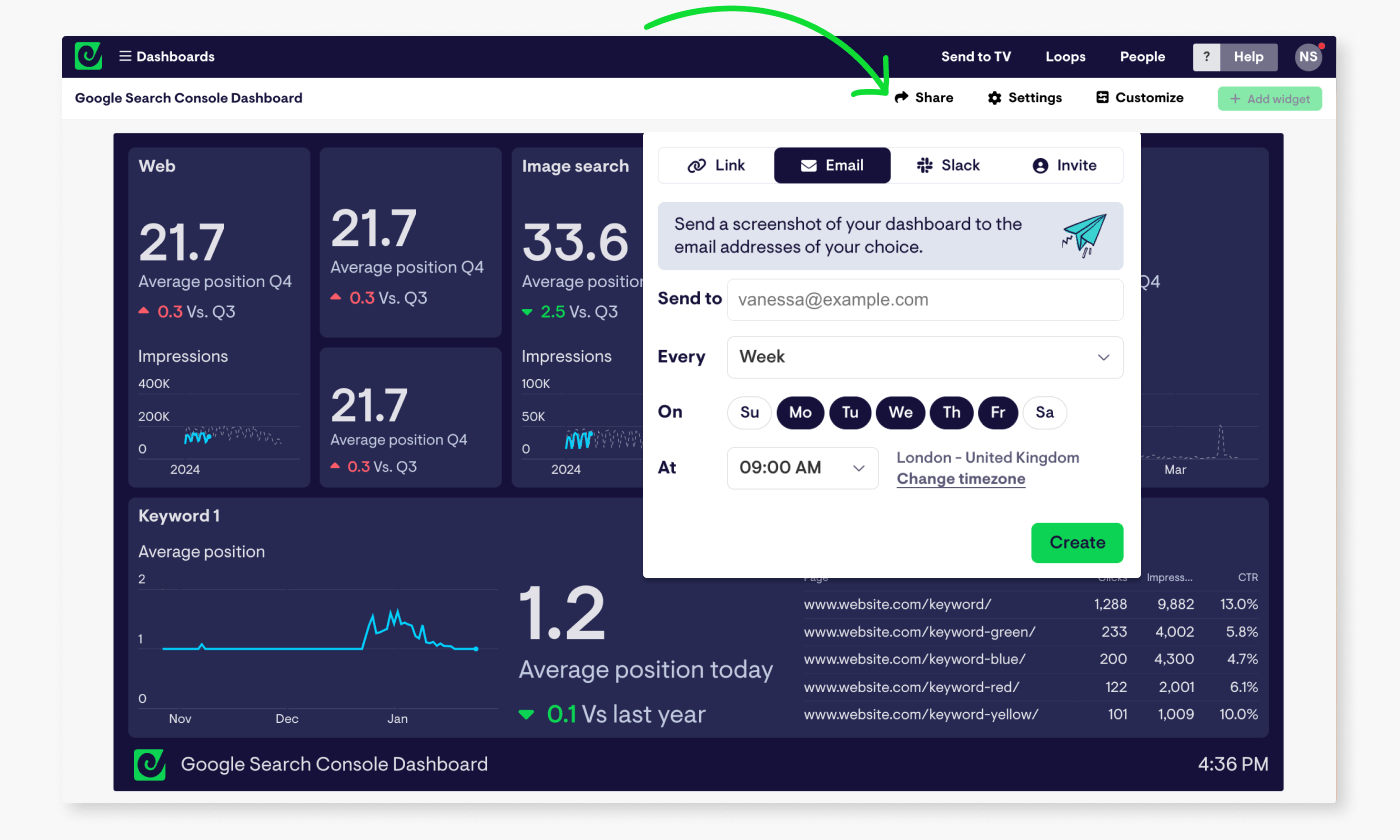
Click the ‘Share’ button in the top right of your account to find the option to share your dashboard as a link, which loads your live dashboard up in a browser tab, no login required. If you’d rather password protect your dashboard, you can also invite others to join your account from this menu, which also gives them access to mobile-friendly versions of your dashboards.
The ‘Share’ menu also provides the option to set up regular snapshots of your dashboard to be sent over email or to a Slack channel, on a daily, weekly or monthly basis. Ideal for checking in with some of your slower-moving SEO metrics, or regularly updating stakeholders.
Finally, you also have the option to display your Google Search Console dashboard on a TV or large screen in your workspace - something Geckoboard is especially suited for. To learn more about how to get your own live TV dashboard up and running, check out the overview here.
Get notified when GSC metrics change
Something else Geckoboard does well, is highlighting when the metrics you care about have changed significantly. It does this in two ways.
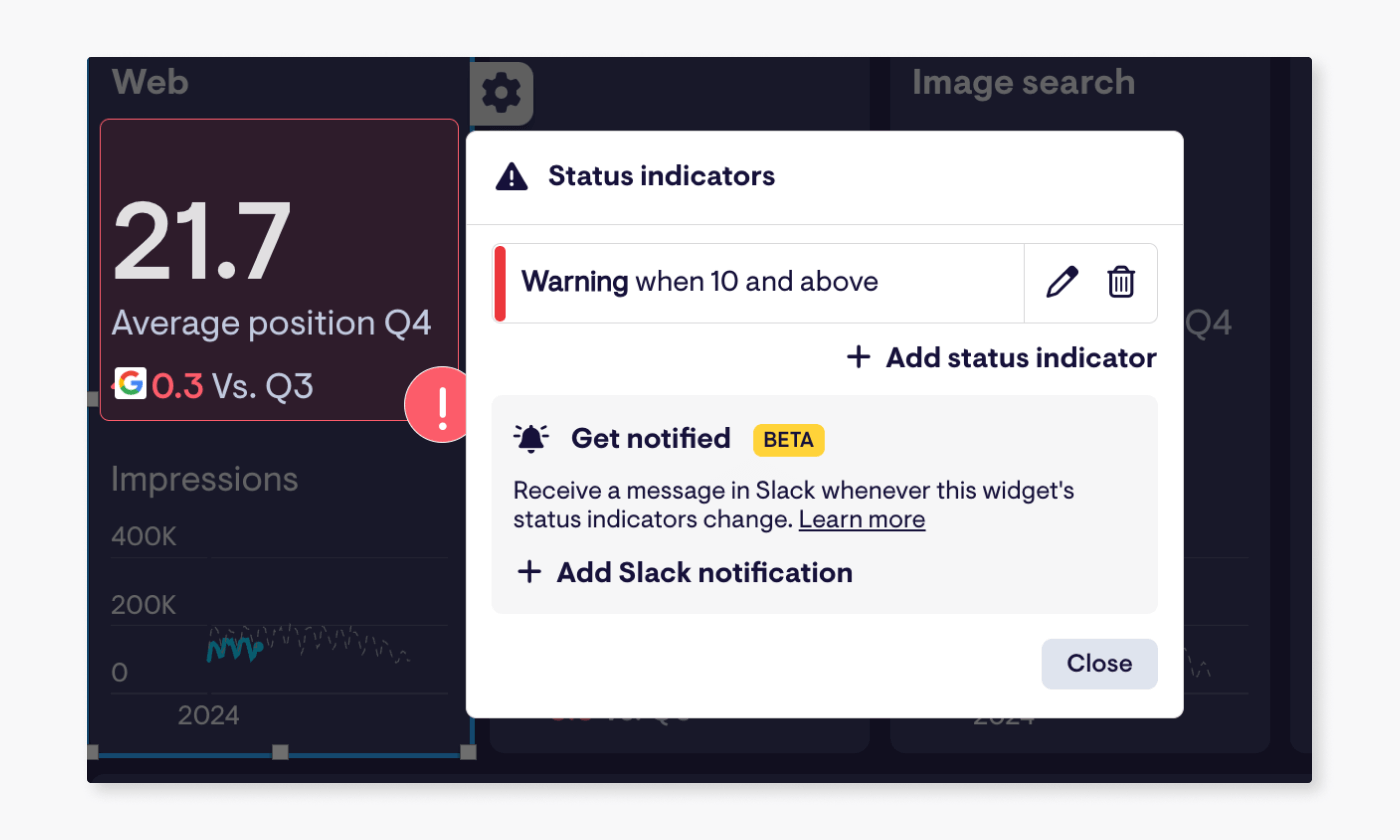
You can add status indicators, which will turn metrics red or green when they change beyond the thresholds you set.
This is ideal if you have your dashboard running in your browser, or displayed up on a screen. If you’re not regularly looking at your dashboards though, you can go a step further and set up notifications. Then, when your metrics change, you’ll also receive a message in a Slack channel of your choice, pointing out what’s changed, and by how much, so you’ll never miss something important.
Hopefully this guide has given you a quick overview of how easy it is to create a custom Search Console dashboard that will make life a lot simpler for anyone who needs to regularly monitor or report on search performance KPIs.
If you’re looking for a bit more dashboard inspiration, have a browse of these marketing dashboards made with Geckoboard, or if you feel ready to build your own, start a free trial using this link.
