Woolworths MarketPlus includes some of Australia’s most recognised marketplace brands including Big W Market, Everyday Market, and Everyday Rewards. With customer service teams spread across Melbourne, Sydney, and a large operation in Manila, maintaining high standards and fast response times is a daily challenge.
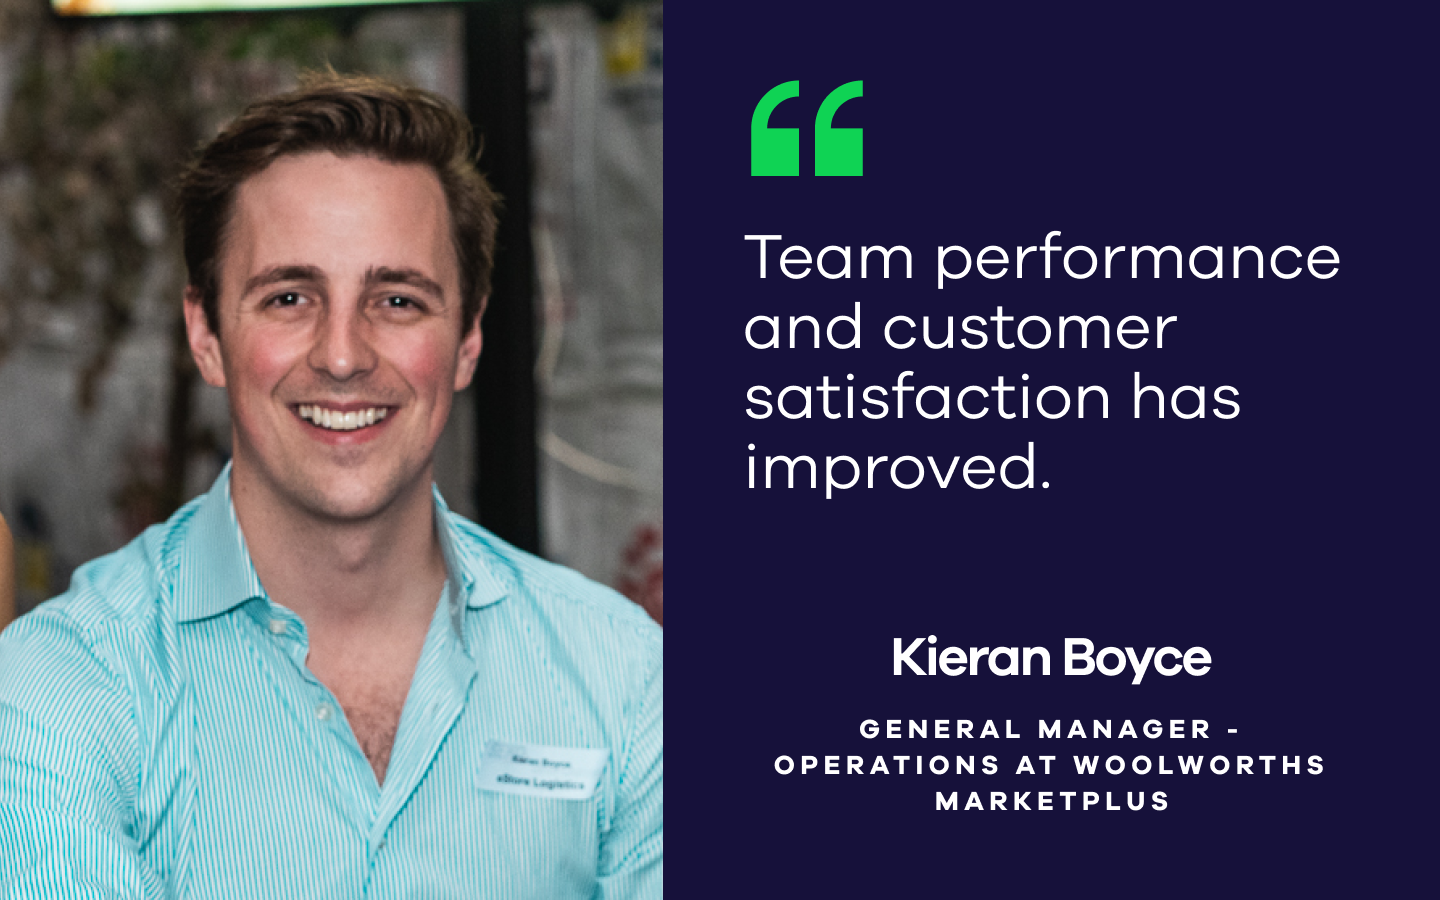
For Kieran Boyce, General Manager of Operations, surfacing performance data to the right people at the right time was a growing concern.
We wanted to give agents insights into how they were tracking, and make that performance visible to their leadership teams too.
The problem: Performance data locked away
Woolworths MarketPlus runs its support function through Zendesk, but Kieran quickly realised a major blind spot.
Zendesk’s native reporting was only accessible to licensed users. That meant frontline teams had no visibility into how they were performing day-to-day, and operational leads couldn’t easily share performance trends or customer feedback.
The information was critical, but it was stuck in Zendesk. We needed real-time insights that anyone could see, from agents to executives.
On top of this, they also needed to share data from other sources like their CRM systems, NPS surveys, and Google Sheets to get a complete picture of performance.
The fix: Geckoboard dashboards for two audiences
Kieran’s team rolled out Geckoboard to give visibility at two levels:
- Real-time dashboards for agents and team leads: showing metrics like ticket throughput, response times, and resolution rates.
- Tactical and strategic dashboards for senior leaders: highlighting trends, customer satisfaction data, and team performance.
This evolved into two reporting functions, both powered by Geckoboard. One for on-the-ground management, one for visibility at an executive level.
Woolworths MarketPlus now use Geckoboard dashboards to pull data from Zendesk, CRM tools, NPS surveys, and even Google Sheets, giving teams a complete picture. No technical skills needed.
Because Geckoboard is so simple to use, Kieran has been able to hand over the frontline team’s real-time data reporting to the team leads. Giving them ownership and accountability for performance.
There was a time when I made every dashboard myself. I haven’t touched created one in six months because the team owns it now.
The impact: Better service, faster action, stronger teams
Real-time visibility quickly turned into real results.
Team leads can now spot potential issues before they escalate, jump in when tickets start aging, and make tactical changes on the fly.
Customer satisfaction is also on the rise, and compliance with KPIs has improved across the board.
On top of overall customer experience improvement, the customer service team are enjoying what they do, with high job satisfaction.
Team performance has improved, customer satisfaction improves, and we see higher team satisfaction too. Our customer service teams are consistently among our most satisfied teams within the business.
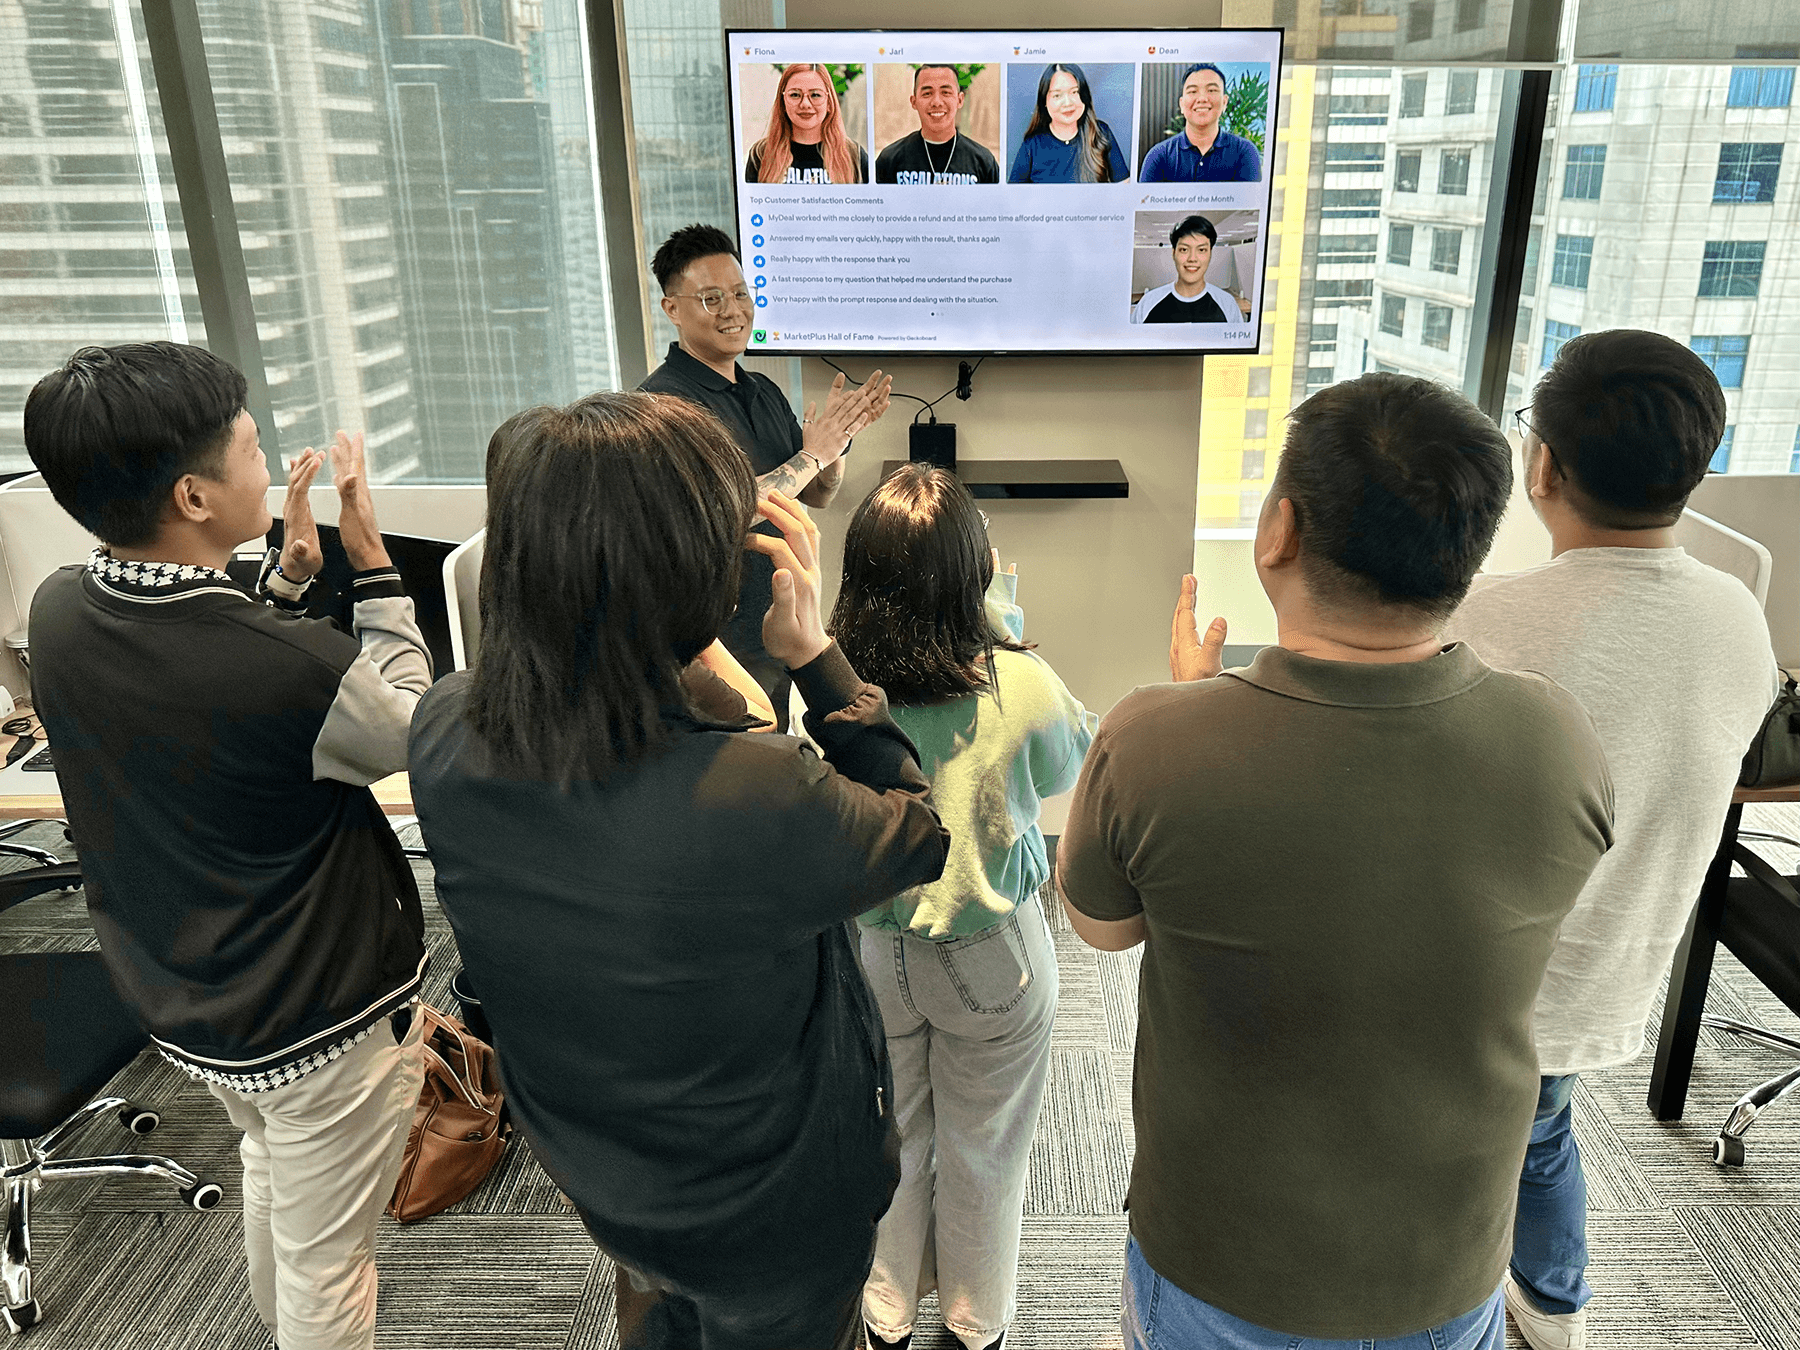
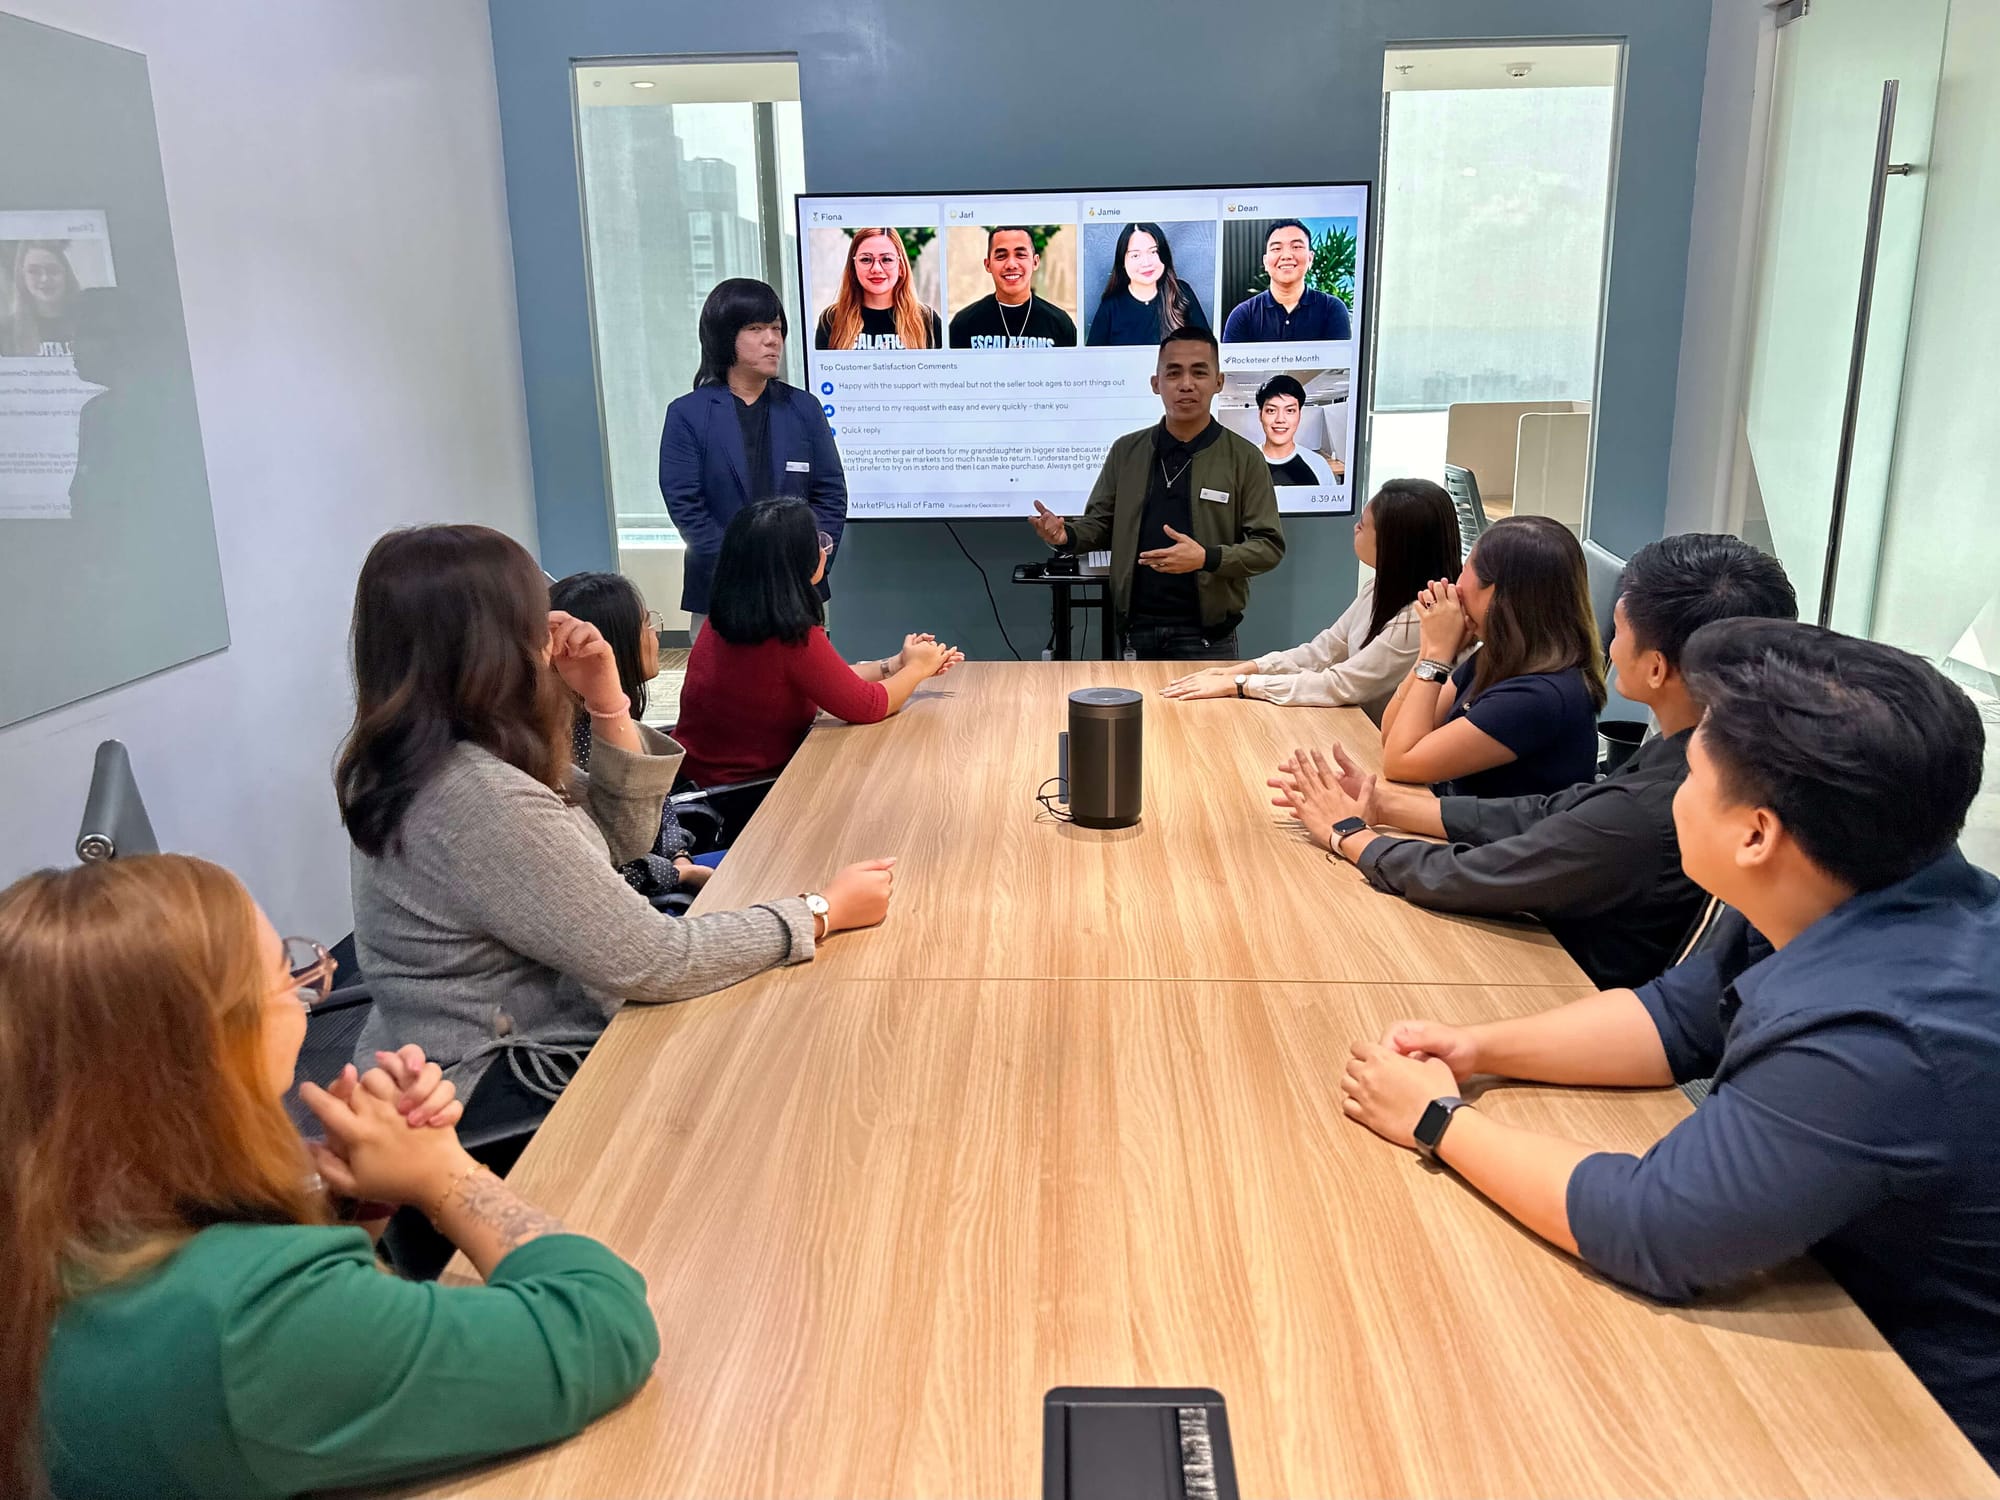
The bonus: Identity, pride, and momentum
What started as a performance tool has also become a source of pride.
Each team created their own dashboard, complete with team photos and a visual theme. This simple step turned metrics into something meaningful.
It’s more than gamification. It’s identity. The teams actually bond with their dashboards.
Kieran’s advice?
"Start a free trial. Connect your Zendesk instance. It’s really easy and the impact is immediate."
Thinking about ways to motivate your support team with real-time data? Learn more about sharing live Zendesk data with Geckoboard.
