Today we’re really excited to announce the launch of our brand new Datasets API, which makes it easier than ever to get data from databases, internal systems and third-party tools into Geckoboard!
We heard your feedback, and realized that getting data into Geckoboard from sources that we don’t have a pre-built integration for was too difficult, and that you needed more control when visualizing that data.
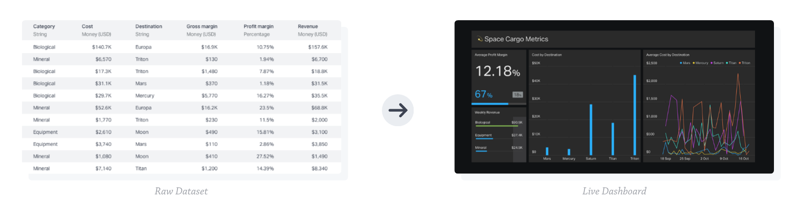
We built our new Datasets API to overcome these challenges.
In a nutshell, the new Datasets API enables developers to spend less time writing code to get data into Geckoboard, and gives everyone the flexibility to visualize their data the way they want on a live TV dashboard, regardless of their technical ability. We’ve written clear and extensive documentation to make it easy for developers to get up-to-speed on how our API works, and provide client libraries so you can get something working quickly. There’s just one, simple, table-like data structure to think about. And now anyone can use a Dataset to build all the visualizations they need from the table of data, just the way they want, using our powerful visualization builder.
Datasets has been built from the ground up to make it as quick and easy as possible to visualize data from any source, exactly the way you want it on your dashboard.
Easily visualize hard-to-reach key metrics
Our new visualization builder is easy-to-use and gives everyone greater control over how your data is presented on a dashboard. Simply choose your Dataset, pick a visualization and make all the adjustments you need to get it looking right. The visualization builder gives you a live preview so you can see how it’ll look before adding it to your dashboard, saving lots of back-and-forth when fine-tuning visualizations. We’ve added a number of features to deliver the customization your visualizations need, including:
- Goal setting: You can now set and update goals on line, bar, column, number and geck-o-meter visualizations in Geckoboard, to ensure your team are continuously focused on the right targets.
- Time bucketing and aggregation: Roll-up multiple values within time buckets of a minute, hour, day, week, month or year on line, bar and column visualizations. You can also choose to take the sum, average, min or max of the values in a bucket to show exactly the metrics you want.
- Fine-tuning: We’ve also added support for adjusting abbreviations (e.g. K for thousands, M for millions or B for billions), decimal places and unit control (e.g. £, $ or €) in the Geckoboard interface. This gives you control when deciding how to represent metrics on your live TV dashboard.
Reduced development time
To start visualizing a Dataset in Geckoboard, you’ll need to send some data via our simple API. Our developers know a thing or two about APIs, so they’ve designed our Datasets API to be as easy as possible for a developer to work with, and keep setup time down to a minimum.
Thanks to a familiar table-like data structure and clear documentation it’s quick and easy to get started. Key new features include:
- Client libraries: Our new client libraries (for Node.js and Ruby) make it simple to pull your most important data into Geckoboard with minimal effort.
- Send incremental updates: We can store your historic data and append new records as we receive them, which removes the need to build data storage into your integration.
- Code-free visualizations: You can now build as many visualizations as you need from a single Dataset without writing any additional code. This means that once you’ve pushed your data to our API you can leave everyone to build their own visualizations.
Here’s what one of our beta users, Jon Leigh, Senior Engineer at Moneybox, had to say about their experience using our Datasets API to build a live TV dashboard:
“We use the Datasets API to push up-to-date company metrics to our Geckoboard, keeping the team constantly informed and motivated to deliver their best. Setup was a breeze and we had our board up and running in under a day.”
Getting started with Datasets
Datasets is available now. To get started, check out the Datasets integration on the integrations list in Geckoboard. We’ve added a sample Dataset so you can try out the editor right away. When you’re ready to start sending your own data, head over to our documentation or pass it to your developer.
What about Custom Widgets?
If you're already using Custom Widgets then fear not - we will continue to support Custom Widgets for the foreseeable future, and let you know well in advance if there are plans to change this.
