
Francis Gwandu, Head of Business Operations at One Acre Fund Tanzania tells us about building a Support team with a KPI-driven culture from the ground up.
Hi Francis, we’d love to know more about your role and One Acre Fund.
I’m Francis Gwandu and I’m Head of Business Operations at One Acre Fund Tanzania. One Acre Fund supports small-holder farmers in remote parts of Africa by providing access to supplies, funding and education, to help them build profitable farming businesses.
I’ve been in my role for 6 years and manage the Customer Engagement team. When I joined, we had just two agents and a mobile phone managing all the incoming calls from farmers. We were using Google Sheets to track tickets – it was a messy system.
Now we have a team of five permanent agents with extra temporary staff during peak farming seasons, and have a CRM system to manage our enquiries.
Why did you look for a dashboard tool like Geckoboard?
Initially, we needed to sort out the hardware and the system behind what we were doing to enable us to talk to more clients. We implemented Zendesk in 2019, which helped us to build a centralized CRM platform for managing tickets. However, there was poor visibility of what was happening with our tickets. As we had an entry level Zendesk account, we weren’t able to access live data, we’d manually download reports with data that was already out of date.
Once we had the infrastructure in place to handle more client enquiries, the focus was then to improve our service. We wanted to implement a KPI-driven performance management system, which meant it became very important for those KPIs to be visible.
My management style is to give team members all the information they need to be accountable for their own work. This meant I needed a solution that would automatically visualize our live metrics in a way that was accessible to everyone.
The only option within Zendesk would have been a pricey upgrade. That would have been unnecessarily expensive because we didn’t need every agent to be able to build reports or manipulate data - they just needed to see our KPIs. This is when I found Geckoboard in the Zendesk Marketplace.
Setting up our dashboards with Geckoboard was so straight forward. I set up our dashboards in 2020 and it has worked well for us ever since. For the team, Geckoboard allows the team to track their key metrics, and for management, it allows us to have a quick oversight of what’s happening.
Tell us about your dashboards
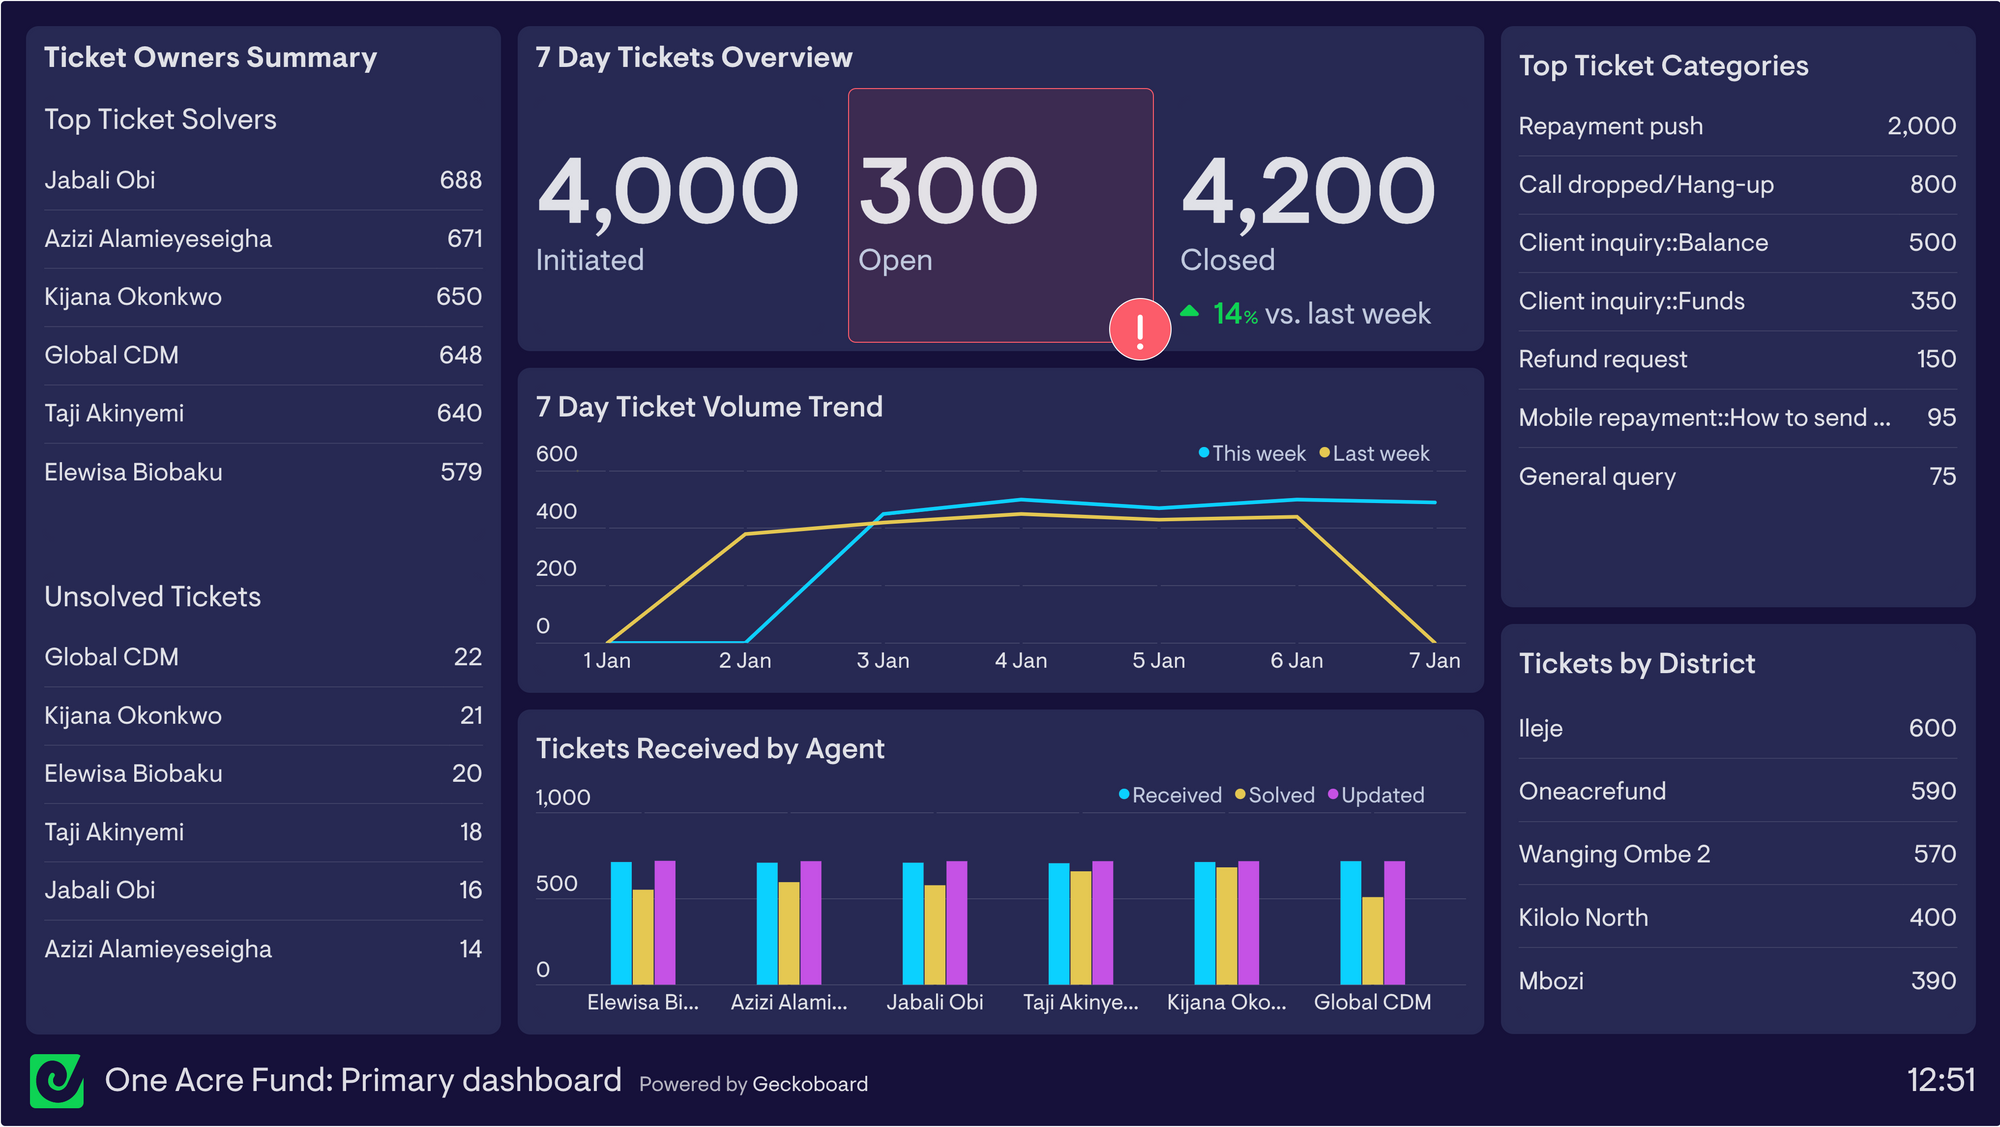
Our primary dashboard shares details on what’s happening with our tickets. We have leaderboards so that agents are able to see who is solving the most, and who holds the most unsolved, and we track ticket trends over time. We look at tickets broken down into categories to see volumes of each, and by district to see where enquiries are coming from. We’re quickly able to see why the boat might be sinking when we look at this dashboard.
On a daily basis the primary dashboard allows me to see how my team is performing but it also inspires competition among our agents. Things get very competitive to be the top ticket solver! I’m able to see who I need to talk to and help work on their progress and what they’re working on. I’ll quickly know if the team needs further support.
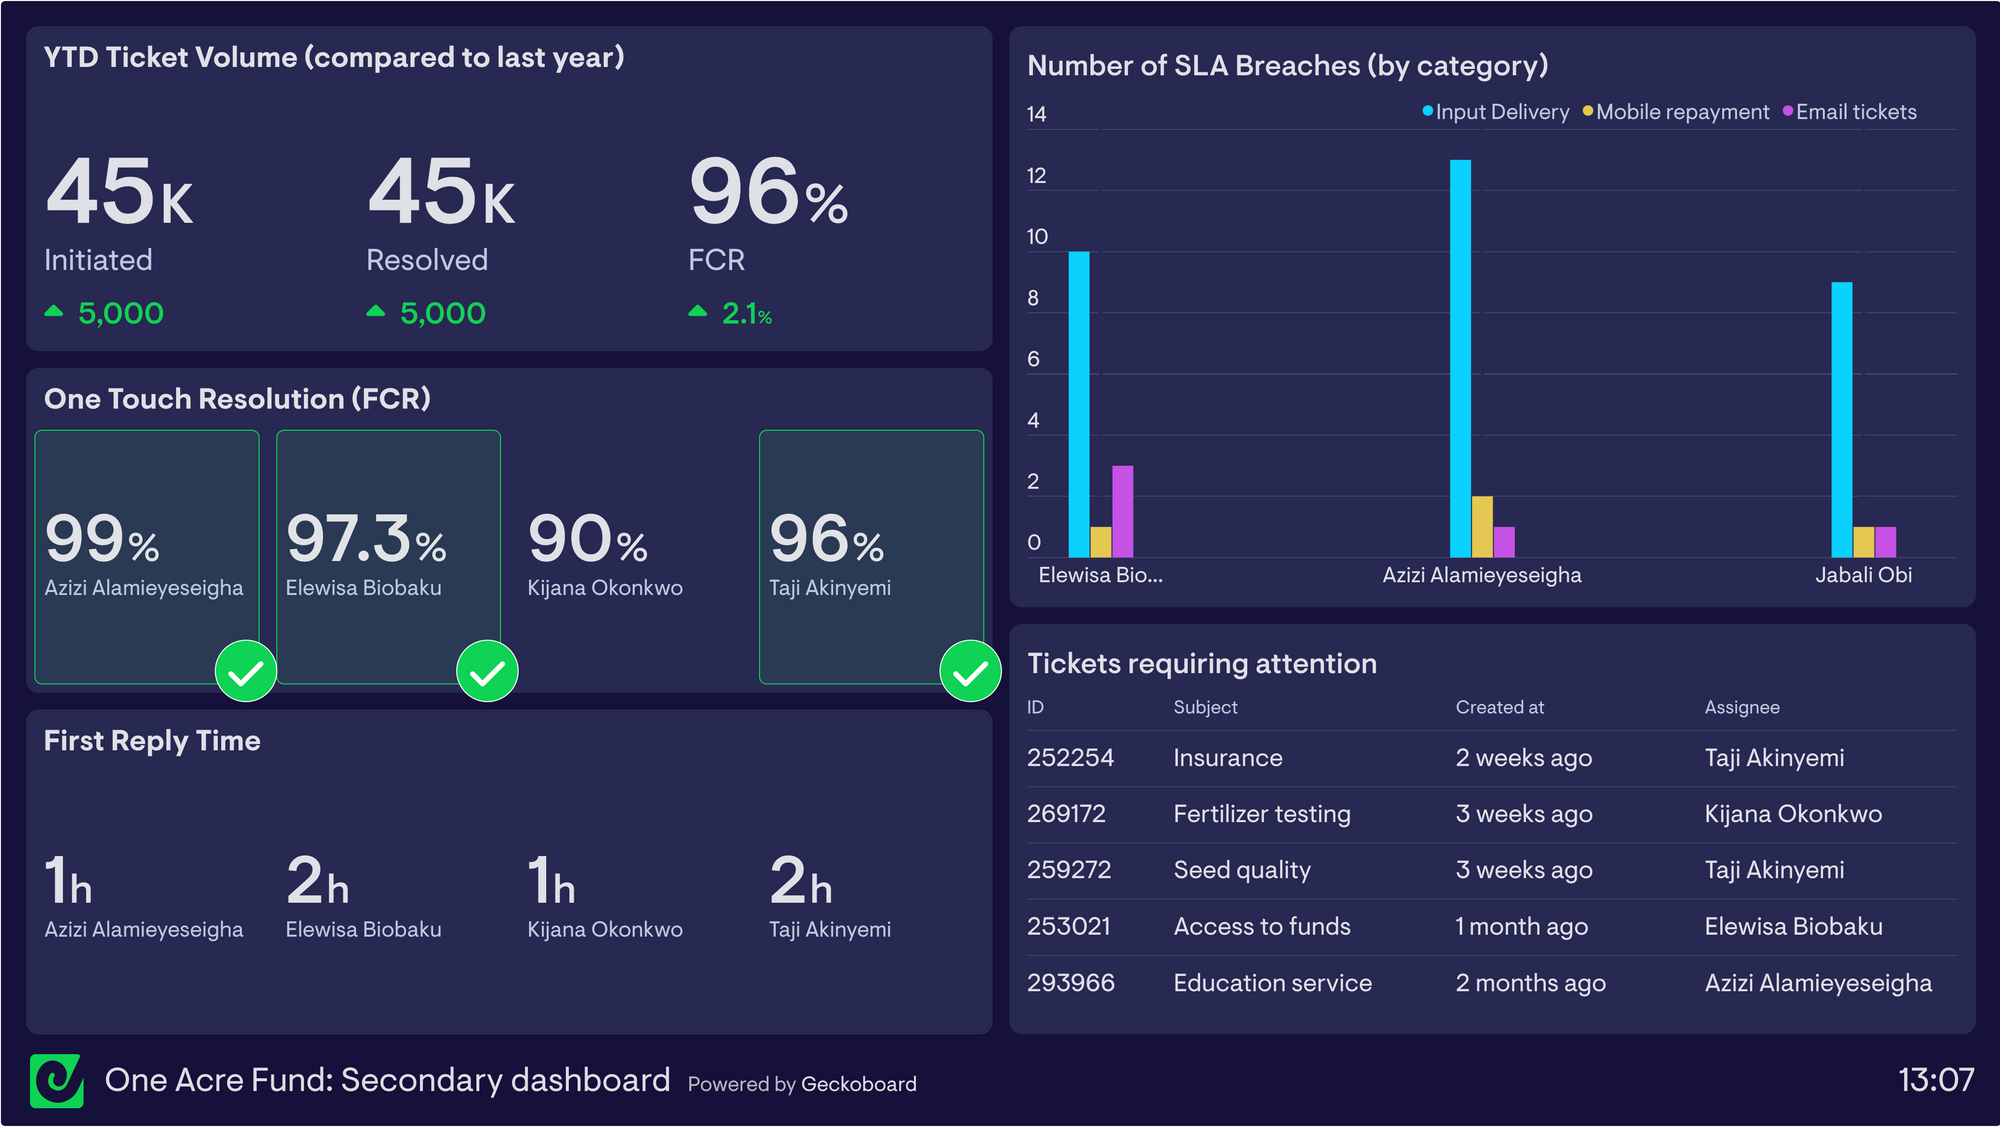
Our secondary dashboard gives me an overview of longer-term performance and areas where individual agents may need training or support in order to achieve their KPIs. I’m normally able to predict how metrics will look on this dashboard but if something is going wrong, I’ll quickly see this here too.
We cover tickets YTD and the efficiency of these, One Touch Resolution Time by agent, First Reply Time by agent, SLA breaches, and tickets requiring attention. One Touch Resolution is one of the key metrics we measure the team on. SLA breaches are broken down into categories so that we can see which issues are doing the most damage here.
The dashboards are seen by the agents (who deal with farmers directly) and the rest of the Business Operations team on a day-to-day basis. It is also viewed by management to see how we’re performing with our KPIs and to see trends in the enquiries we receive. Currently we all view our dashboards via a sharing link pinned in our browsers but we recently moved to a new office so we’re planning on getting them up on a TV for everyone to see.
Finally, what impact have you seen since launching your dashboards?
Implementing the dashboards was really good for driving ticket closure. Before the dashboards, we never really had full visibility of what we had open.
We immediately saw a reduction in the number of open tickets we had.
Agents being accountable for their efforts towards the team KPIs is the most important change that was driven by the dashboards. Before Geckoboard, there was no visibility and team members would feel like they’d done a lot of work but had no idea what impact they were having or how they were performing, compared to their colleagues. They’d need to ask to find out how they were doing and sometimes felt like the metrics didn’t reflect the effort they’d put in. Now, with the dashboards in their hands, they can see what their efforts look like in real-time.
For management, the major advantage has been the ability to see all the team KPIs at a glance without having to process the data. We’re quickly able to analyze trends in the data and take action as a response.
