At Geckoboard, we’re on a mission to help people use data more simply and effectively. We’ve put together a series of quick lessons to help you spot fallacies in data or call out dodgy visualizations so you can use data with confidence and make better decisions both in work and in life.
Data dredging is the use of data mining to uncover patterns in data that can be presented as statistically significant without first devising a specific hypothesis as to the underlying causality [Wikipedia]. In simpler terms, it’s beginning to analyze data without saying what point you’re trying to prove and whether or not that point is actually valid. It’s searching deep for answers in data regardless of whether or not there is really something to be found.
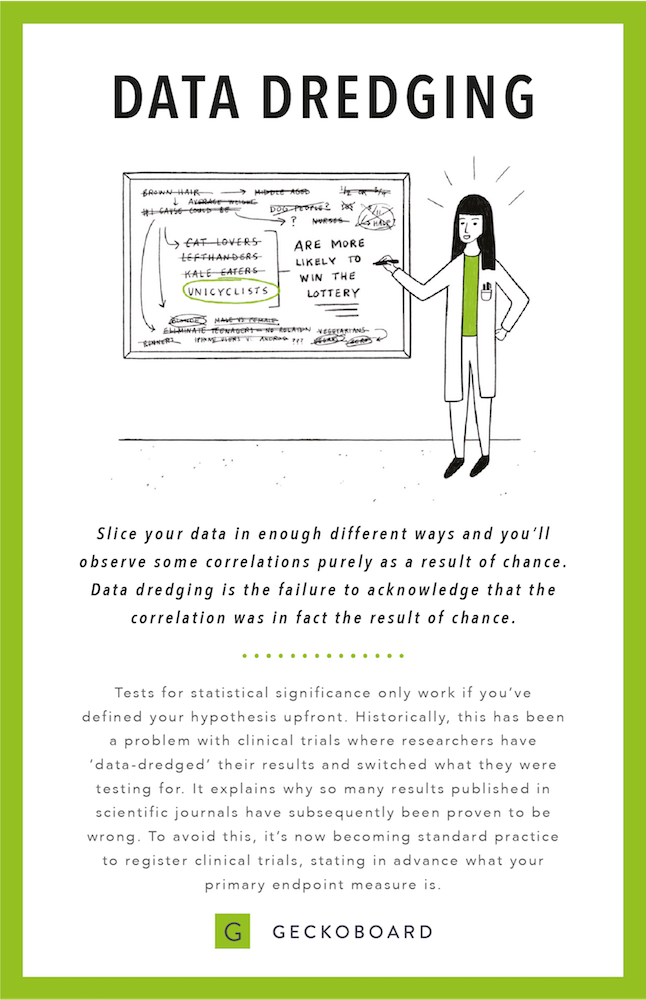
Slice your data in enough different ways and you’ll observe some correlations purely as a result of chance. Data dredging is the failure to acknowledge that the correlation was, in fact, the result of chance. Tests for statistical significance only work if you’ve defined your hypothesis up front.
Take the example illustrated above. By looking at a huge pool of data such as lottery winners without defining what you’re looking for, you’ll draw a whole lot of data points. You’ll start testing hypotheses around things like hair color or animal affiliations until you find the data point you wanted to find -- that unicyclists are more likely to win the lottery, for example.
Historically, this has been a problem with clinical trials where researchers have ‘data-dredged’ their results and switched what they were testing for. That’s why so many results published in scientific journals have subsequently been proven to be wrong. To avoid this, it’s now becoming standard practice to register clinical trials, stating in advance what the primary endpoint measure is.
What Data Dredging could look like in your business
Let’s say you want to see if some subset of your customers is more likely to upgrade than others. You test one variable or customer characteristic (i.e. customers with more than 20 employees) and the test shows no statistical significance.
You then start dredging through all of your data -- because you’re a modern data-savvy person, you’re storing hundreds of attributes about your customers. You develop a hypothesis for each one (i.e. companies in a certain geographic region, revenue bracket, etc.) until you eventually hit the jackpot and find that one of the hypotheses (i.e. “customers in South America are more likely to upgrade”) is significant.
But that conclusion is a false positive. By running these small experiments over and over again, you’re increasing the chances of seeing a correlation that appears to be statistically significant but is, in fact, a false positive. To say this was statistically significant would be a fallacy (because you’re data dredging).
When enough hypotheses are tested (on average, 20 if you're using the standard significance threshold of P=0.95), it’s certain that some will be statistically significant but misleading. Almost every data set with any degree of randomness is likely to contain some false correlations [Wikipedia].
How to avoid Data Dredging in your business
The simplest way to avoid dredging data in your business is to think like a scientist. Analyze your data first, then identify potential trends, then develop a hypothesis, then finally, test it in a systematic and fair way. For added accountability, get your team and/or advisors involved. Have people review and test your research methodologies.
