When it comes to running a successful online store there’s a lot to keep track of. From high-level metrics like revenue or number of orders, down to more detailed information such as customer feedback, there simply isn’t one ecommerce analytics tool that covers it all.
So as a business owner, how can you oversee all the different parts of your online store without wasting minutes or even hours every time you need to look up some important data?
As many online retailers are finding out, the solution could be to set up a dedicated dashboard for your ecommerce site, containing metrics and other data you need to keep an eye on regularly, that can help you spot trends or any issues with your store that might require your intervention. For instance, if you are using eCommerce hosting, you might want to set up a dashboard and determine KPIs related to uptime and overall speed performance. This gives you information at a glance about how your website is performing.
In this guide we’ll take a look at what an ecommerce dashboard is, some different flavors of dashboard, and how they can help you and others in your business keep on top of the metrics that matter.
What is an Ecommerce dashboard?
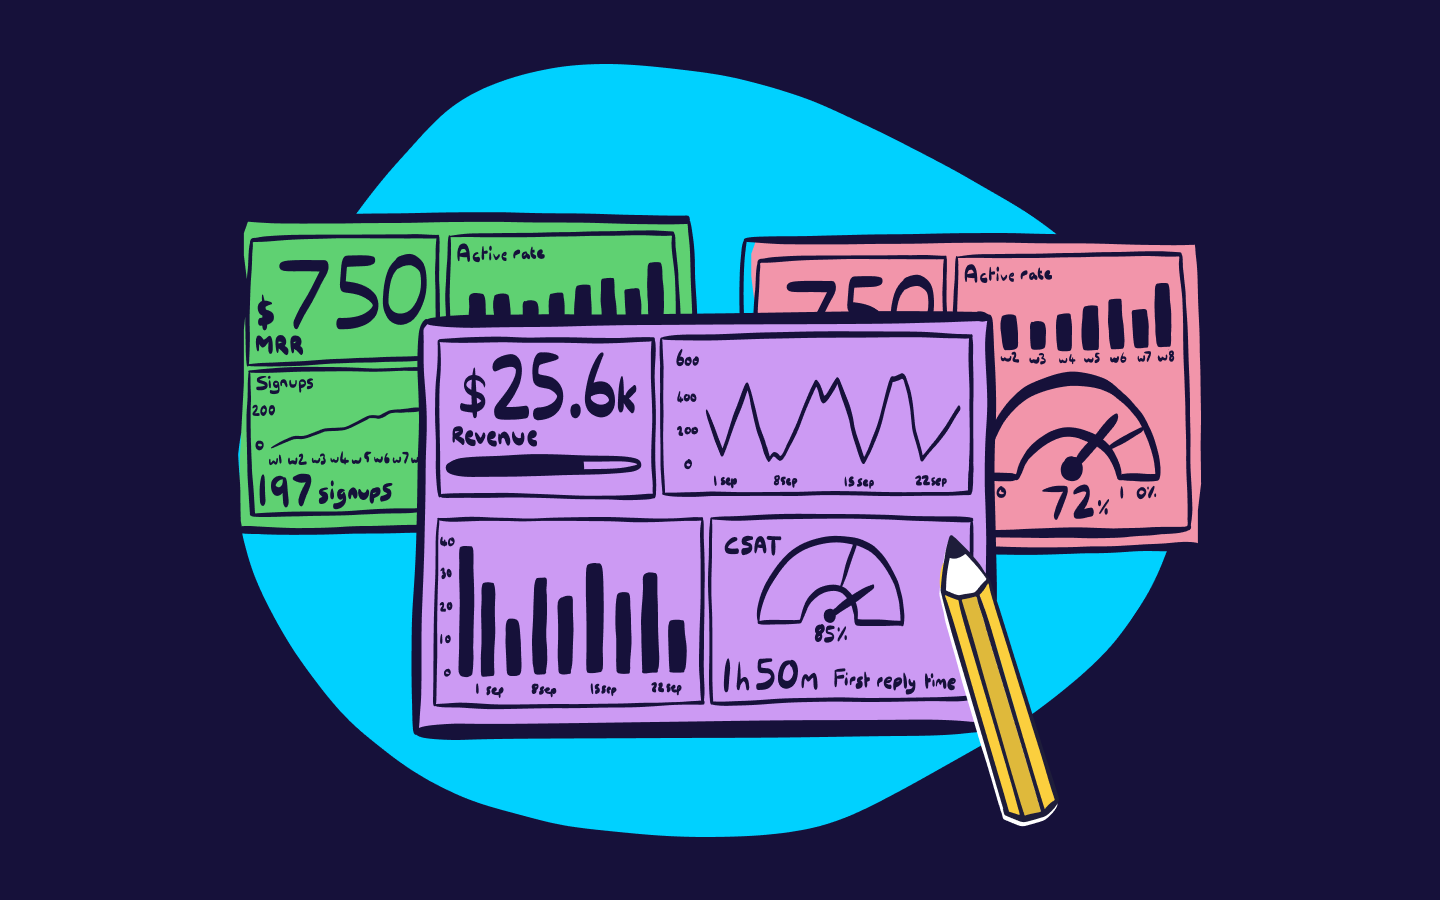
In its purest form, an ecommerce dashboard is a curated set of metrics, KPIs and other data that’s designed to highlight, in the clearest possible way, trends, anomalies and information related to an online store that regularly warrants attention.
Dashboards differ from more specialised ecommerce analytics tools and reports, in that their purpose is to surface just the most important information viewers might care about, rather than every possible metric that can be sliced and diced in an infinite number of ways.
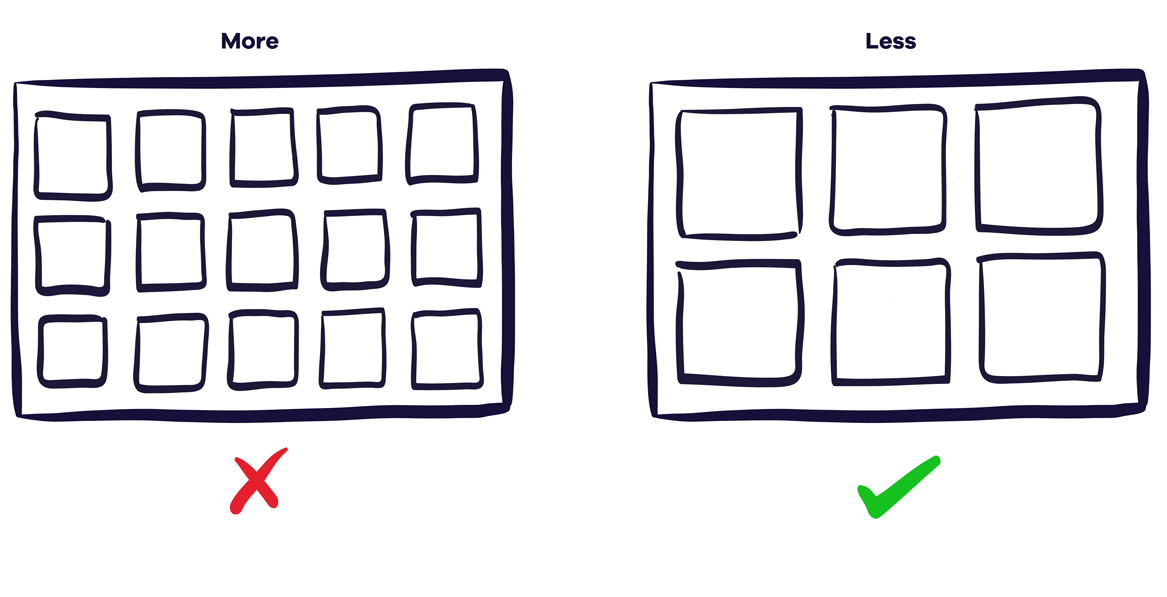
That’s not to say reports and analytics aren’t valuable - larger stores in particular will need bespoke analytics tools for digging into the finer points of their store’s performance. But if you’re managing a smaller store or if you’re an offline retailer that’s just getting started with selling online, then a handful of carefully chosen metrics will likely serve you better than a plethora of information.
‘What sort of metrics,’ you ask? There’s no ‘one size fits all’ when it comes to which metrics should go on an ecommerce dashboard, simply because of the huge variety of businesses out there. An online sports shoe brand that sells its products around the world will have a very different set of requirements to an organic food store that serves a local community, for example.
Furthermore, depending on the size and depth of the operation, an ecommerce business might consider building several dashboards to keep on top of different parts of the organisation, with dashboards that are dialled in to show everything from website performance to fulfilment, to ad performance over in marketing and support queries.
Many small businesses start off on their dashboard journey relying on the built-in dashboards that are baked into their ecommerce platform (e.g. Shopify). These tools are quick to get started with, but aren’t easy to tailor to your business’ specific requirements, or see data from several sources side by side. They also tend not to cater well to businesses that run multiple stores.
That’s where a dedicated ecommerce dashboard comes in…
How can an Ecommerce dashboard help your business?
As we’ve learnt, dashboards are not for presenting lots of information or reveal long-term insights - they’re there to give you and others in your organization just enough information in order to take appropriate action throughout the day.
NB: if you want to dig deeper into some of the theory behind different types of dashboard, check out the Practical Dashboards book by Nick Desberats
One of the most common type of use case that a dashboard covers is making sure that any major problems or issues are detected quickly so they can be fixed. Some of the things dashboards can alert you to include:
- Website downtime
- Build ups of support queries
- Order fulfilment issues
- Low stock
- Drop offs in ad performance
- Negative PR or social media backlash
Dashboards don’t just help with monitoring your operations in real time though. Another important use for them is as a powerful team motivation tool.
Whether individuals on the team are intrinsically or extrinsically motivated, seeing the direct results of their work can provide a huge motivation boost. Surfacing important sales data, showing progress towards financial goals, and highlighting other core business KPIs can all help with keeping staff engaged with their work, and can often be the catalyst for sparking some healthy competition that pushes the team to achieve more. It also helps to encourage a strong data-driven culture that can have a powerful effect on the business as a whole.
One other fundamental way dashboards can help your ecommerce business is with saving everyone across your company time and effort when it comes to accessing data. Dashboards bring data together into a streamlined view that can be easily shared, bookmarked or even displayed up on the walls of your workspace. A single carefully considered dashboard can make sure data is only a click or a glance away, cutting out unnecessary logging into another tool and digging through to find the number you need. Even if it’s a few minutes every day, add that up for everyone across the business who needs to check their numbers regularly, and that can be some serious time savings.
Some ecommerce dashboard examples
Exactly what dashboards you need, and what metrics should go on them, varies hugely from business to business, and the best dashboards should always reflect your business’ needs at the current time.
Some of the factors that can radically affect the flavour of dashboard(s) you might build include:
- What sort of products you sell, and whether it’s a one-off purchase or is bought frequently
- Whether you’re selling to businesses (B2B) or consumers (B2C)
- Whether you’re outsourcing fulfilment, delivery or support, or all of is as a drop shipping operation
- Whether you serve local, national or international markets
- Seasonality
- How many individual products your store stocks
- Volume of orders
- Expectations around delivery times
These factors vary from business to business, and a dashboard that works for one may not make any sense for another. Nevertheless, it’s always useful to see some examples of what’s possible as inspiration for your own dashboard. Below are some example dashboard outlines that represent some common use cases and patterns we’ve seen across thousands of ecommerce companies who have built dashboards using Geckoboard, our easy-to-use business dashboard software.
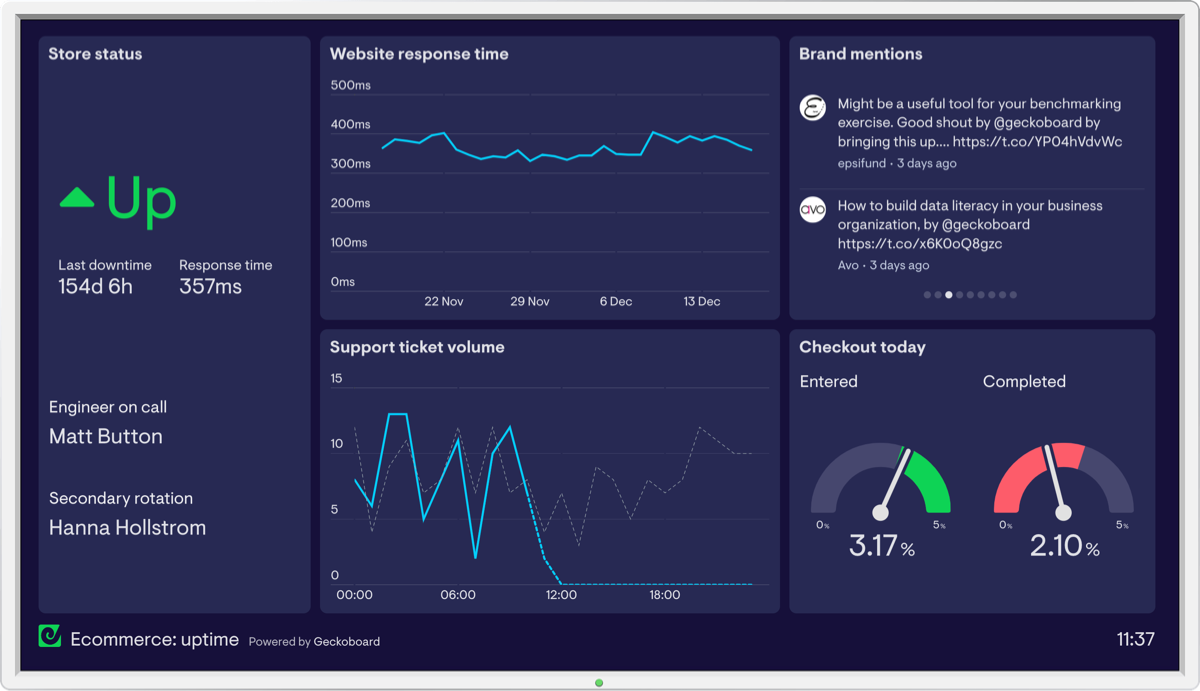
The “Is the store working right now?” dashboard
Are orders coming through OK? Is something broken on the website or with fulfilment? This sort of dashboard exists to answer these questions and give you peace of mind that the critical parts of your operation are running smoothly, and if they’re not, to flag that quickly so things can get fixed.
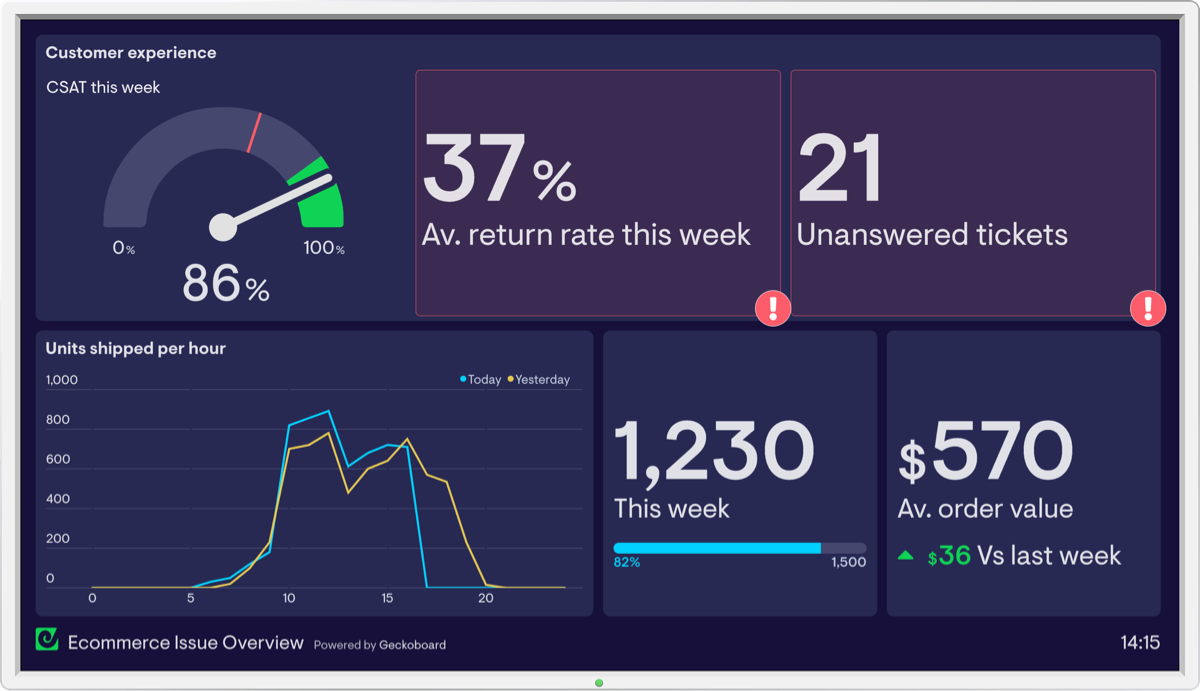
The “Are there any problems in the business right now?” dashboard
In addition to the focus areas above, these sorts of dashboards shine also shine a spotlight on business and operational metrics that can rapidly cause negative knock-on effects if they’re not monitored closely.
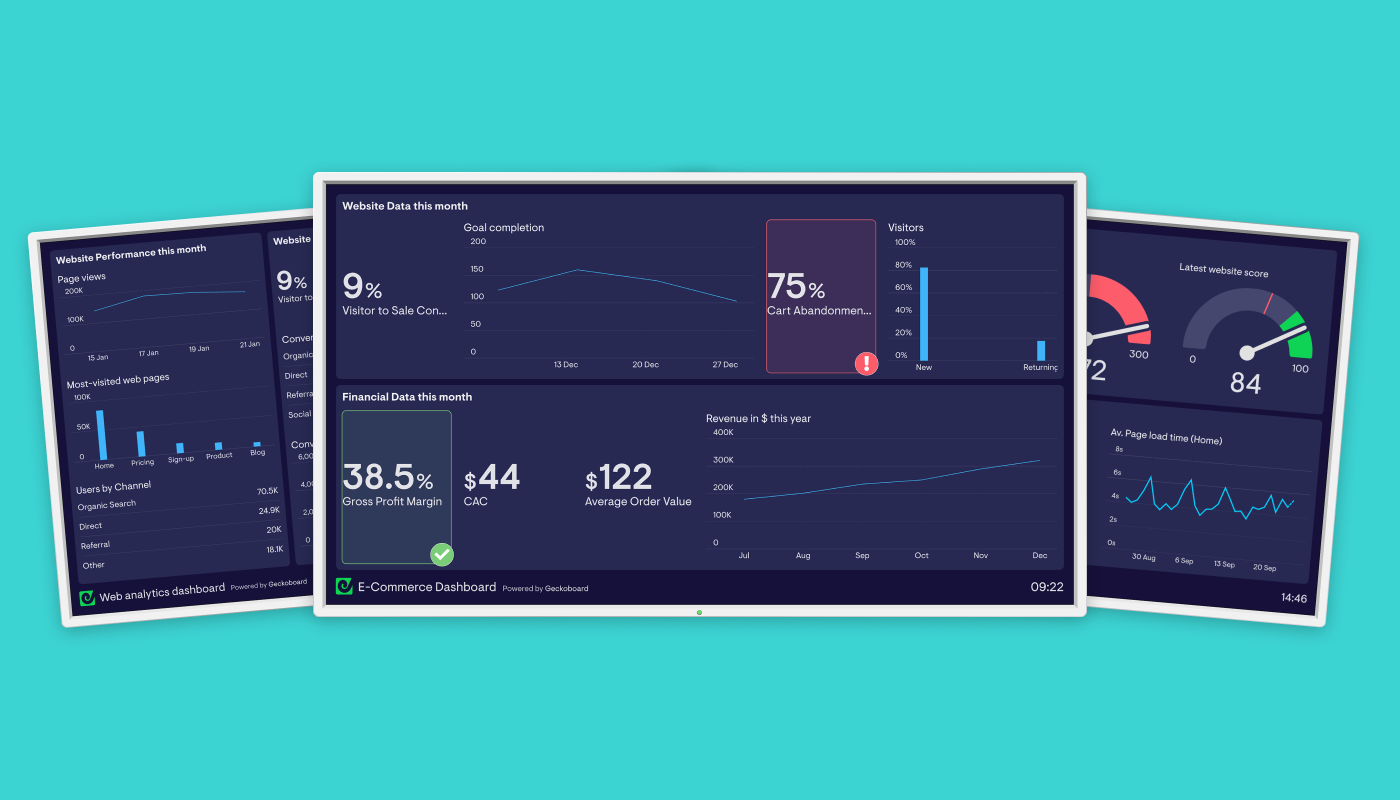
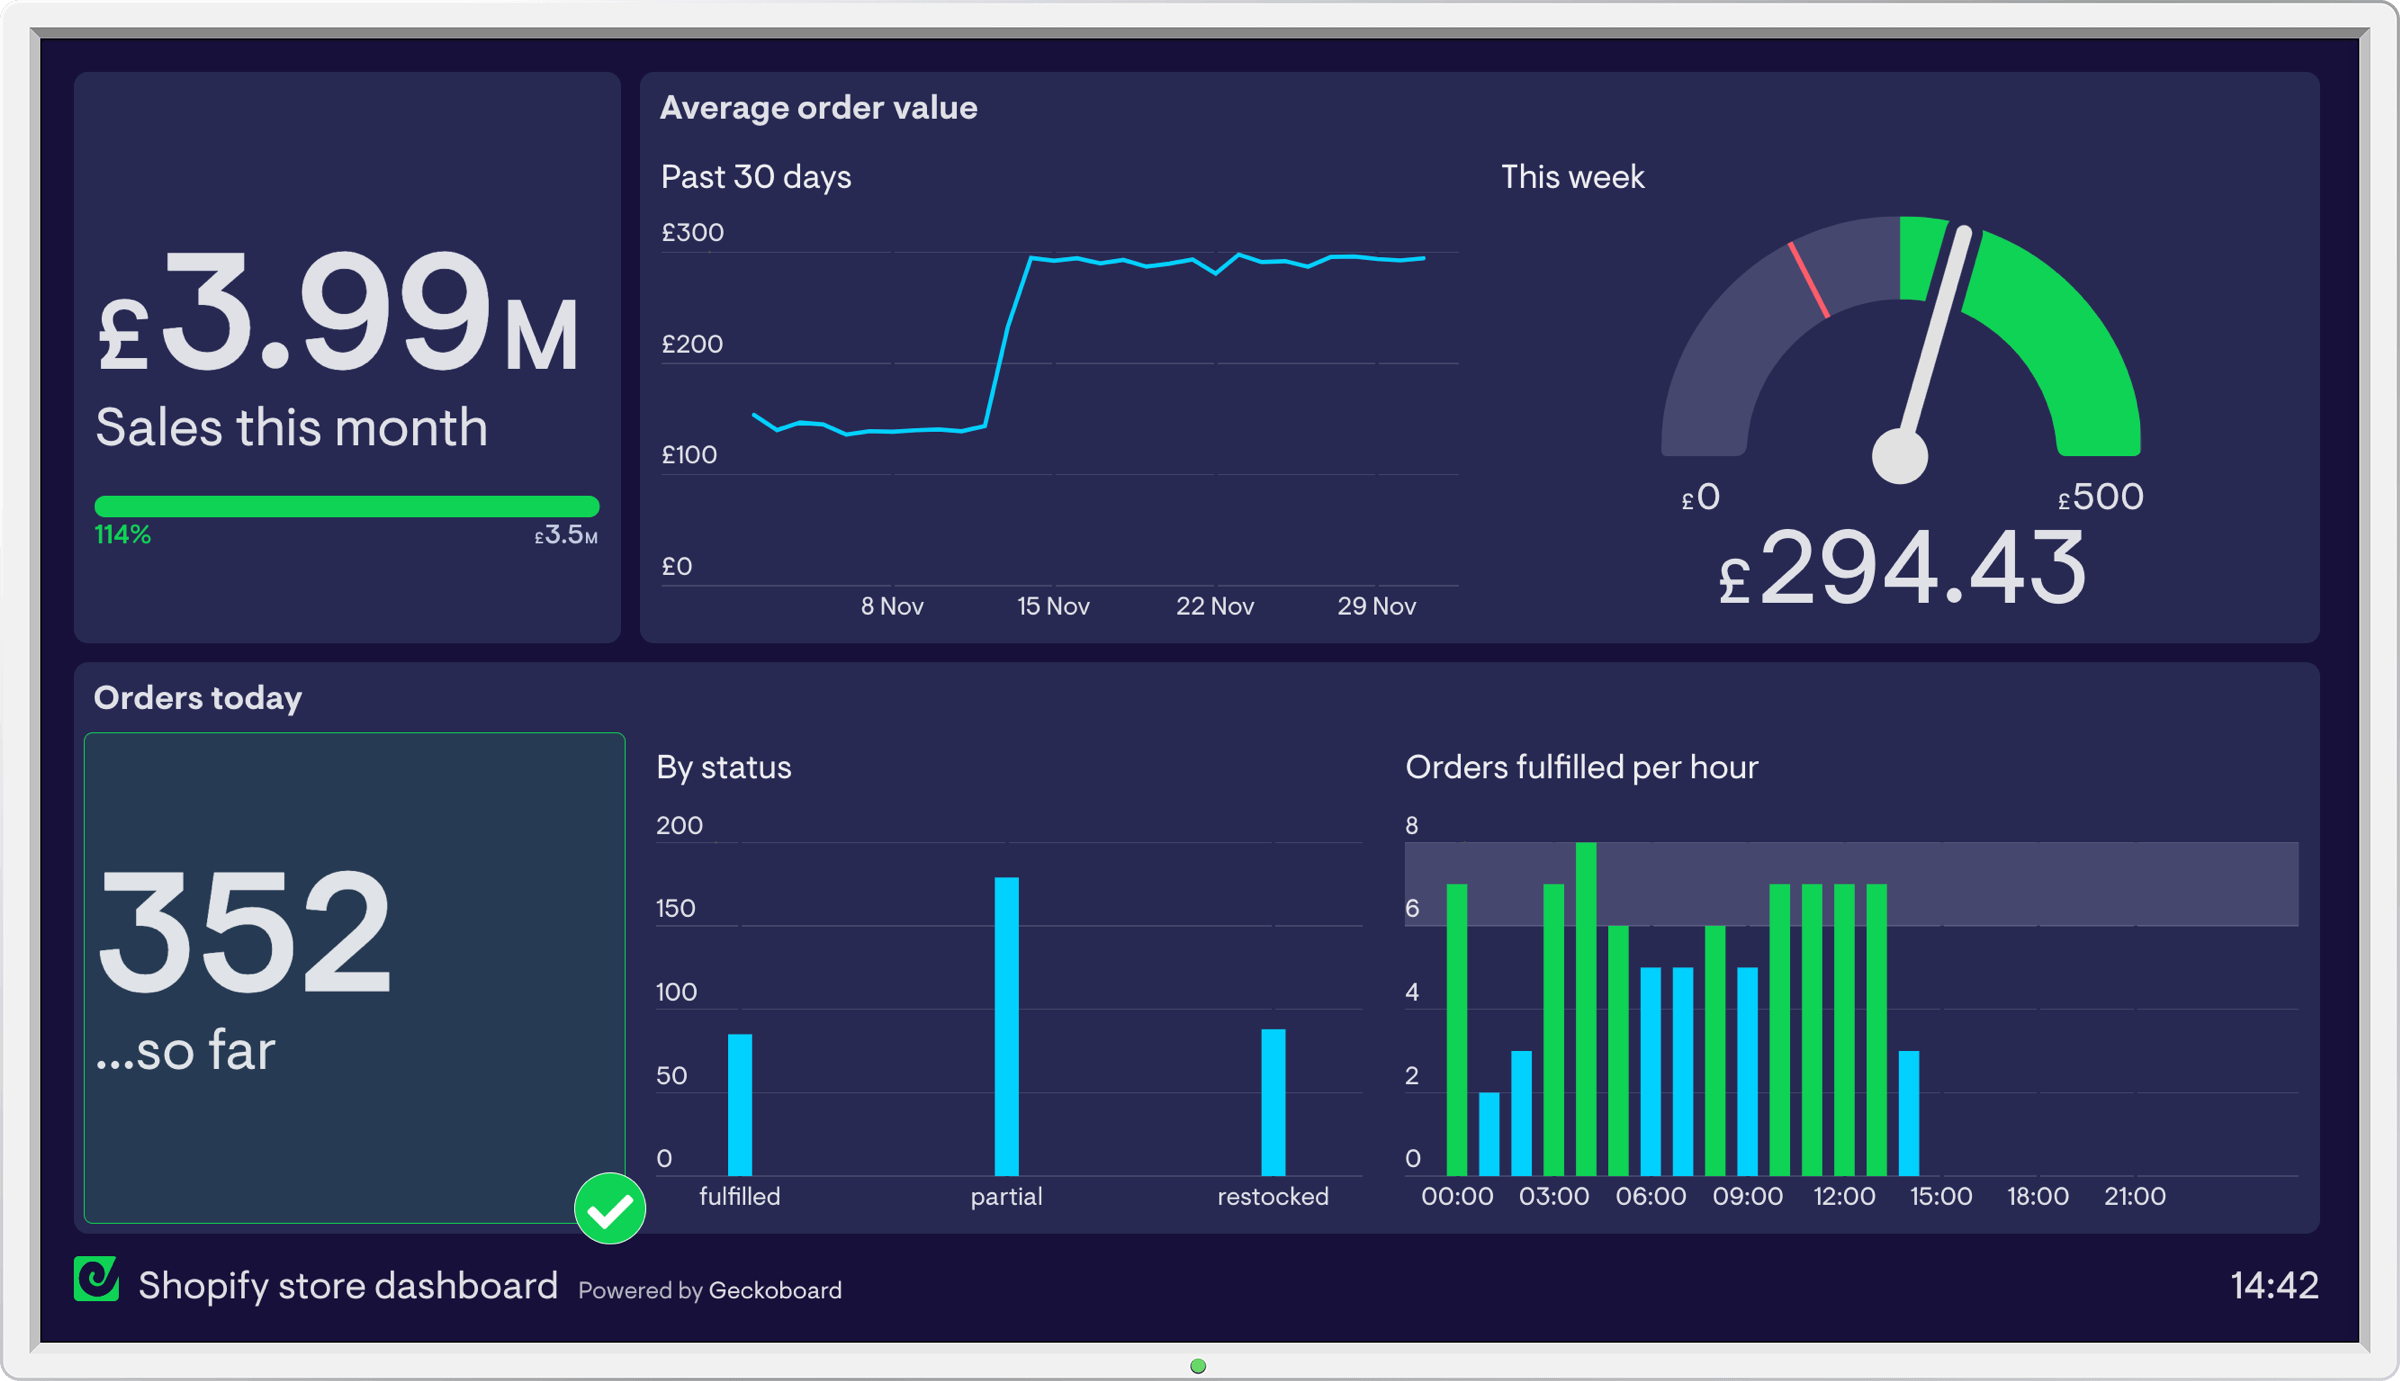
The “Weekly or monthly store performance” dashboard
The categories of dashboard above are focused on critical metrics that help you survive. This sort of dashboard zooms out a little and is focused on metrics that help you thrive. ‘Are we on track to meet this month’s target?’. ‘Are sales going up?’ ‘Which products are performing best?’ These questions, if answered frequently, can help ensure an ecommerce operation is moving in the right direction and financially healthy.
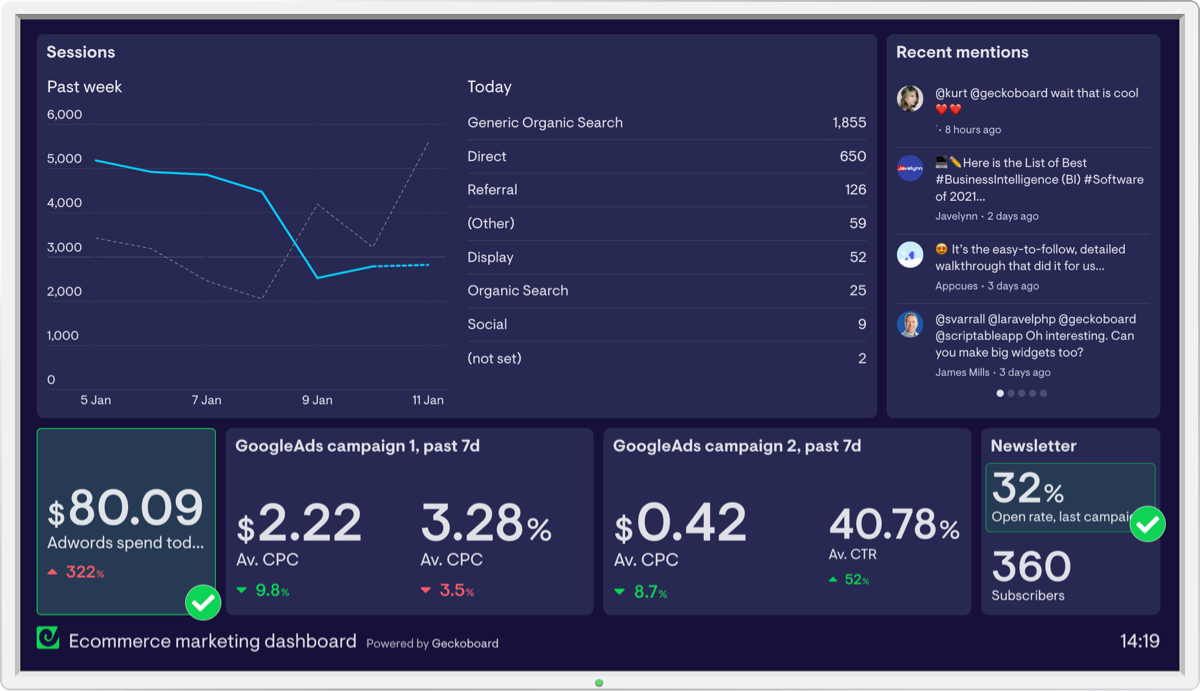
The “Marketing performance” dashboard
There are hundreds of ways to drive traffic to your online store, and any number of small things can have a big impact on your bottom line if you’re not on top of them. Even in the cases where you have no direct control over what’s happening, it pays to know what’s going on so you can mitigate any negative consequences.
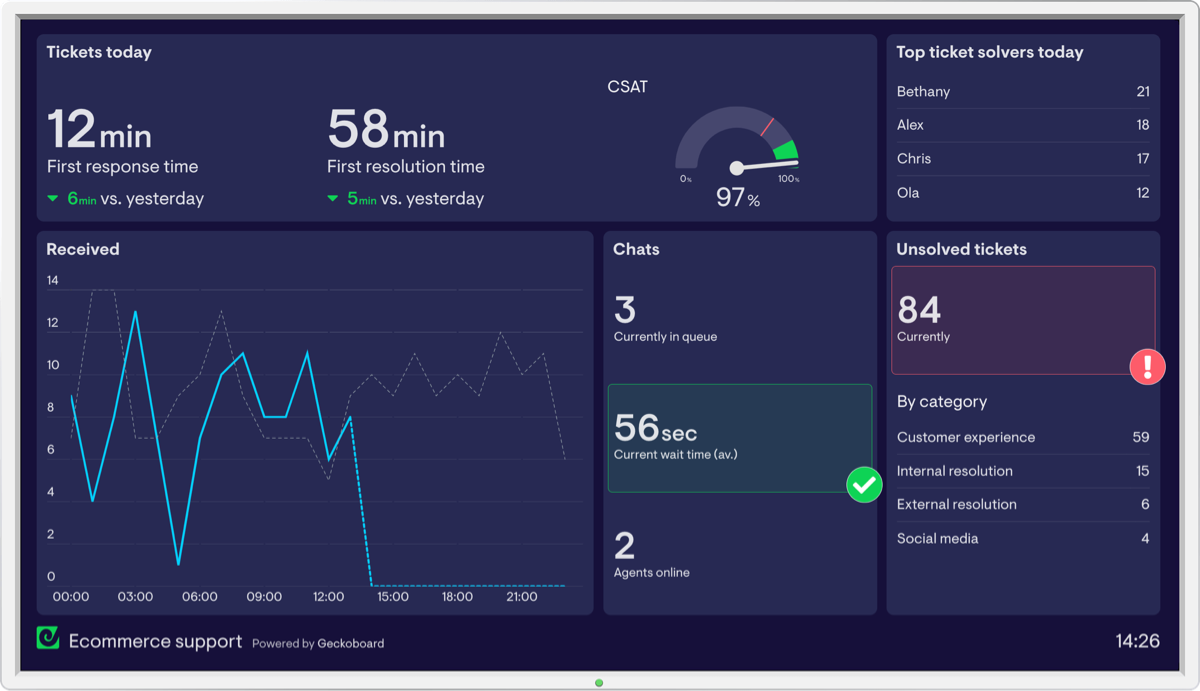
The “Are there any customer support issues right now?” dashboard
For stores that consider customer experience to be a priority, it’s essential to keep on top of core metrics like CSAT and ticket volumes to make sure your team is delivering great service and leaving customers happy.
Conclusion
The dashboard examples above are by no means a comprehensive list (you can browse other dashboard examples in our gallery here), but they should hopefully give you an idea of some of the directions you might want to explore if you’re considering building a dashboard for your ecommerce business.
For more information on how to build a highly effective dashboard, check out the following resources. Good luck!
