
If you’ve spent any time in Zendesk Explore, you have probably run into the same limitation as most support teams.
The standard metrics are useful, but they only tell part of the story. Ticket volume, first reply time, resolution time, CSAT. They are a starting point, not the full picture.
As soon as you want to dig into how your team is performing against SLAs, backlog, workload, or automation, you need something more tailored to how your support operation works.
That’s where Zendesk custom metrics come in.
This guide explains what Zendesk custom metrics are, when you’ll need them, and how to use them effectively. It also shows how to avoid leaving valuable support data hidden in Explore by surfacing it in ways teams can act on.
What are Zendesk custom metrics?
You may see the terms custom metrics and calculated metrics used interchangeably in Zendesk.
That’s because they’re the same thing. Zendesk custom metrics, also referred to as calculated metrics, are metrics you create yourself using Zendesk Explore’s calculation builder.
They allow you to combine existing metrics and attributes, apply formulas, and create ratios or thresholds that reflect how your support team operates.
Teams use Zendesk custom metrics to answer questions that default reporting doesn’t cover, such as SLA compliance, backlog aging, reopen rates, or how effective automations are.
These are everyday operational metrics, but they aren’t available out of the box.
When are Zendesk custom metrics used?
Most teams turn to custom or calculated metrics when standard Explore reports reach their limit in being actionable.
This usually happens when you need to move beyond averages and totals and start answering deeper, more targeted questions of your data.
For example, knowing your average first reply time is useful. Knowing what percentage of tickets are breaching your first reply SLA right now is far more actionable.
Zendesk provides the raw data for these insights, but expects teams to define what good performance looks like for their operation. Custom metrics are how teams bridge that gap.
If you find yourself exporting data to spreadsheets, manually calculating percentages, or debating whether a metric really reflects reality, it’s usually a sign you need a custom metric.
How Zendesk custom metrics work in Explore
Zendesk calculated metrics are created in Zendesk Explore.
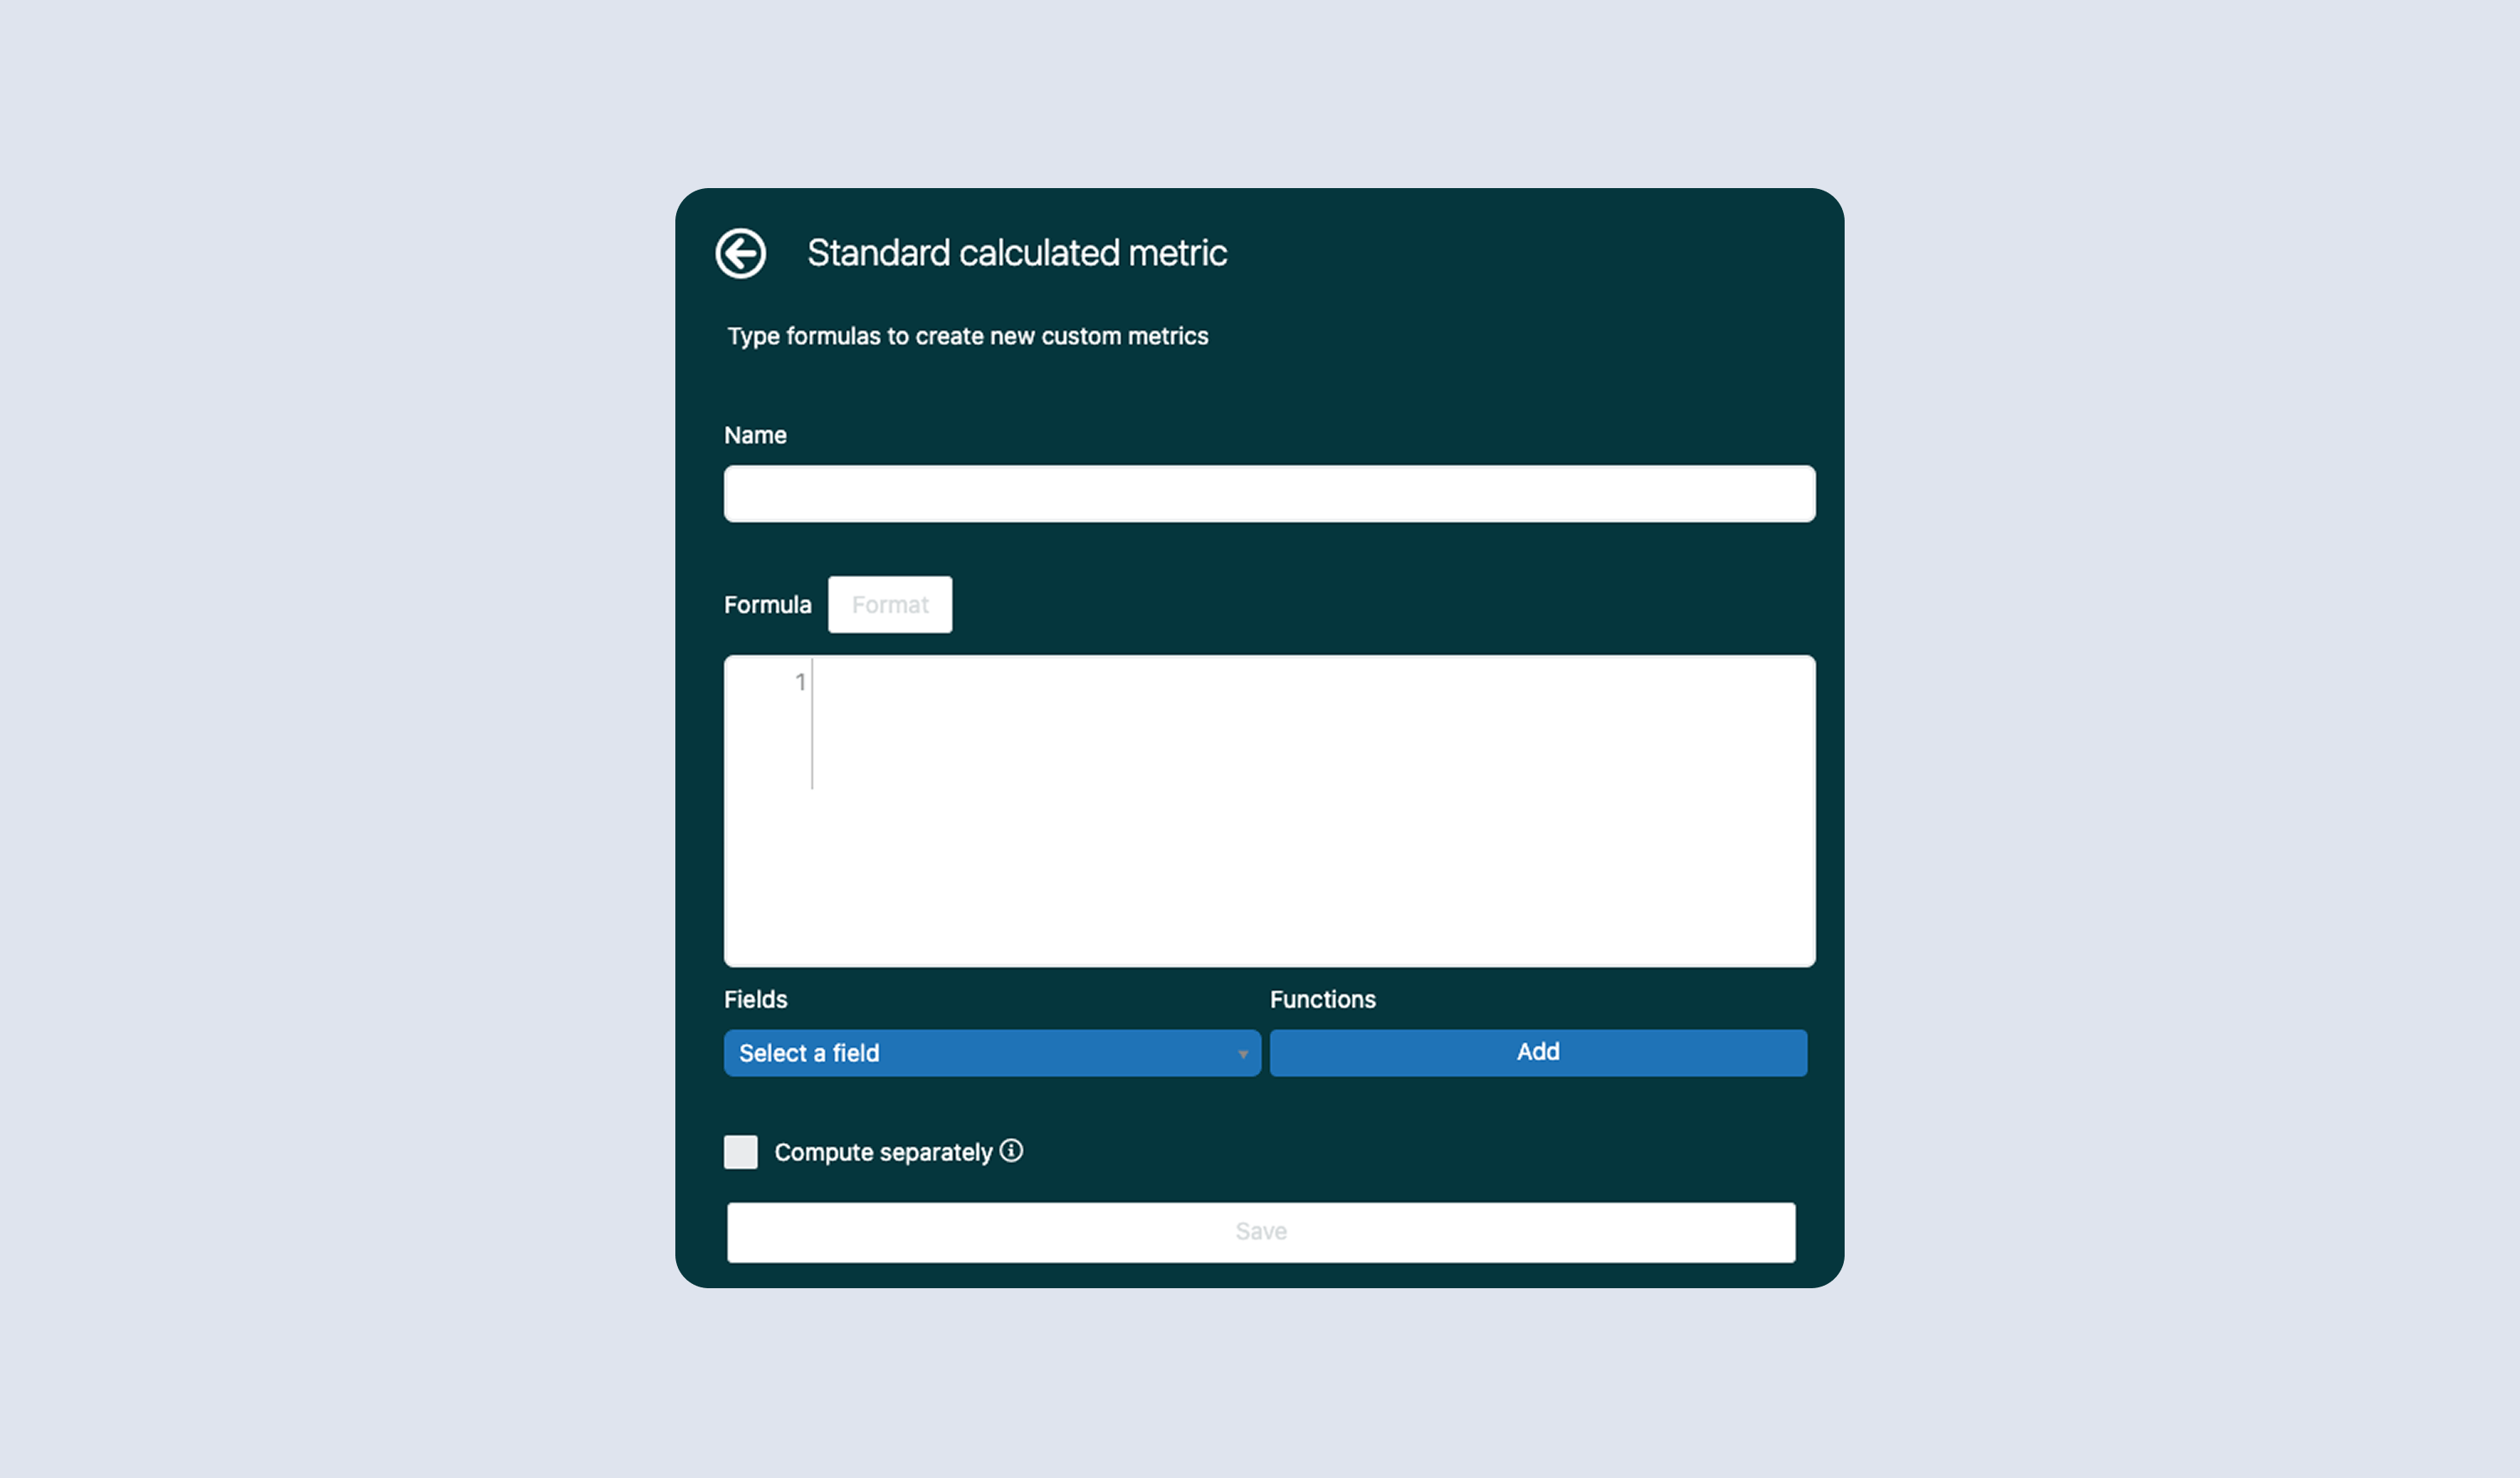
At a high level, you choose the base metrics and attributes you want to work with, apply a formula, and save the result so it can be reused across reports and dashboards.
For example, a common calculated metric is first reply SLA compliance. This is typically created by dividing the number of tickets that met the SLA by the total number of tickets with an SLA applied.
The capability is powerful, but it comes with a learning curve. Teams often struggle with knowing which base metrics to use, how to write formulas correctly, and how to avoid subtle mistakes that skew results.
Common Zendesk custom metrics teams build
While every support team is different, the same types of custom and calculated metrics come up repeatedly across Zendesk teams.
These metrics typically exist to answer practical, day-to-day questions that default Explore reporting doesn’t handle well.
SLA and fast-resolution metrics
SLA-related reporting is one of the most common reasons teams create custom metrics in Zendesk Explore.
Zendesk shows SLA timings, but it doesn’t always make it easy to report on performance against a clear threshold. As a result, teams often create metrics such as:
- Tickets solved within a specific time window, for example under 20 minutes
- Percentage of tickets solved within that time window
- Percentage of tickets breaching an SLA target
These metrics help teams move beyond averages and understand whether they’re consistently meeting expectations.
Backlog and ticket aging metrics
Another common reporting gap is understanding the health of the backlog.
Zendesk makes it easy to see ticket counts, but much harder to understand how long tickets have been waiting or which ones are becoming a risk.
Custom metrics in this category often include:
- Tickets older than a defined number of minutes, hours, or days
- Tickets currently breaching or approaching SLA thresholds
- Tickets waiting on agents versus tickets waiting on customers
These metrics help teams prioritize work and prevent issues before they escalate.
Contact reason and categorization metrics
Reporting on contact reasons can quickly become messy when categories are split across multiple conditional fields.
To simplify analysis, teams often create custom metrics or attributes that combine category fields into a single, consistent dimension. This makes it easier to report on why customers are getting in touch without complex filters or duplicated logic.
Zendesk Talk metrics
For teams using Zendesk Talk, custom metrics are often essential.
Default Talk reporting doesn’t always reflect how calls are actually handled or resolved, particularly when tickets are created or updated as part of the call flow.
Common custom metrics in this area include:
- One-touch Talk tickets, where a call is resolved without follow-up
- Percentage of Talk tickets resolved in a single touch
- Percentage of inbound calls that go unanswered
These metrics help teams assess call handling quality, staffing levels, and overall Talk performance.
Need help with custom metric code? We’ve built a library
Working with Zendesk Consultant Jude Kriwald, we’ve curated a library of the most commonly requested custom metrics Zendesk implementation partners get asked for: the Zendesk Explore custom metrics library.
The library is a collection of proven custom metrics and attributes that support teams commonly need but don’t get out of the box.

Each metric in the library includes a clear explanation of what it measures, the exact Explore formula required, and the dataset it applies to. That makes it much easier to build reliable metrics without trial and error.
Teams use the library to speed up reporting, avoid mistakes, and establish consistent definitions for key performance metrics.
Explore the full library here.
Here are a handful of the most popular custom metrics you’ll find in the library:
- Tickets solved in less than 20 minutes
- % tickets solved in less than 20 minutes
- Second categories combined
- True one-touch Talk tickets
- % true one-touch Talk tickets
- Non-answered inbound calls %
Showcasing Zendesk support data so teams can take action
Creating Zendesk calculated metrics is only part of the job.
The real value comes from making those metrics visible to the people who need them.
In reality, many custom metrics stay locked inside Explore dashboards that are checked infrequently. Agents rarely see them, and depending on your Explore refresh rates, issues are often discovered after SLAs have already been breached.
Best practice is to surface key Zendesk metrics where teams already work, so performance stays visible throughout the day.
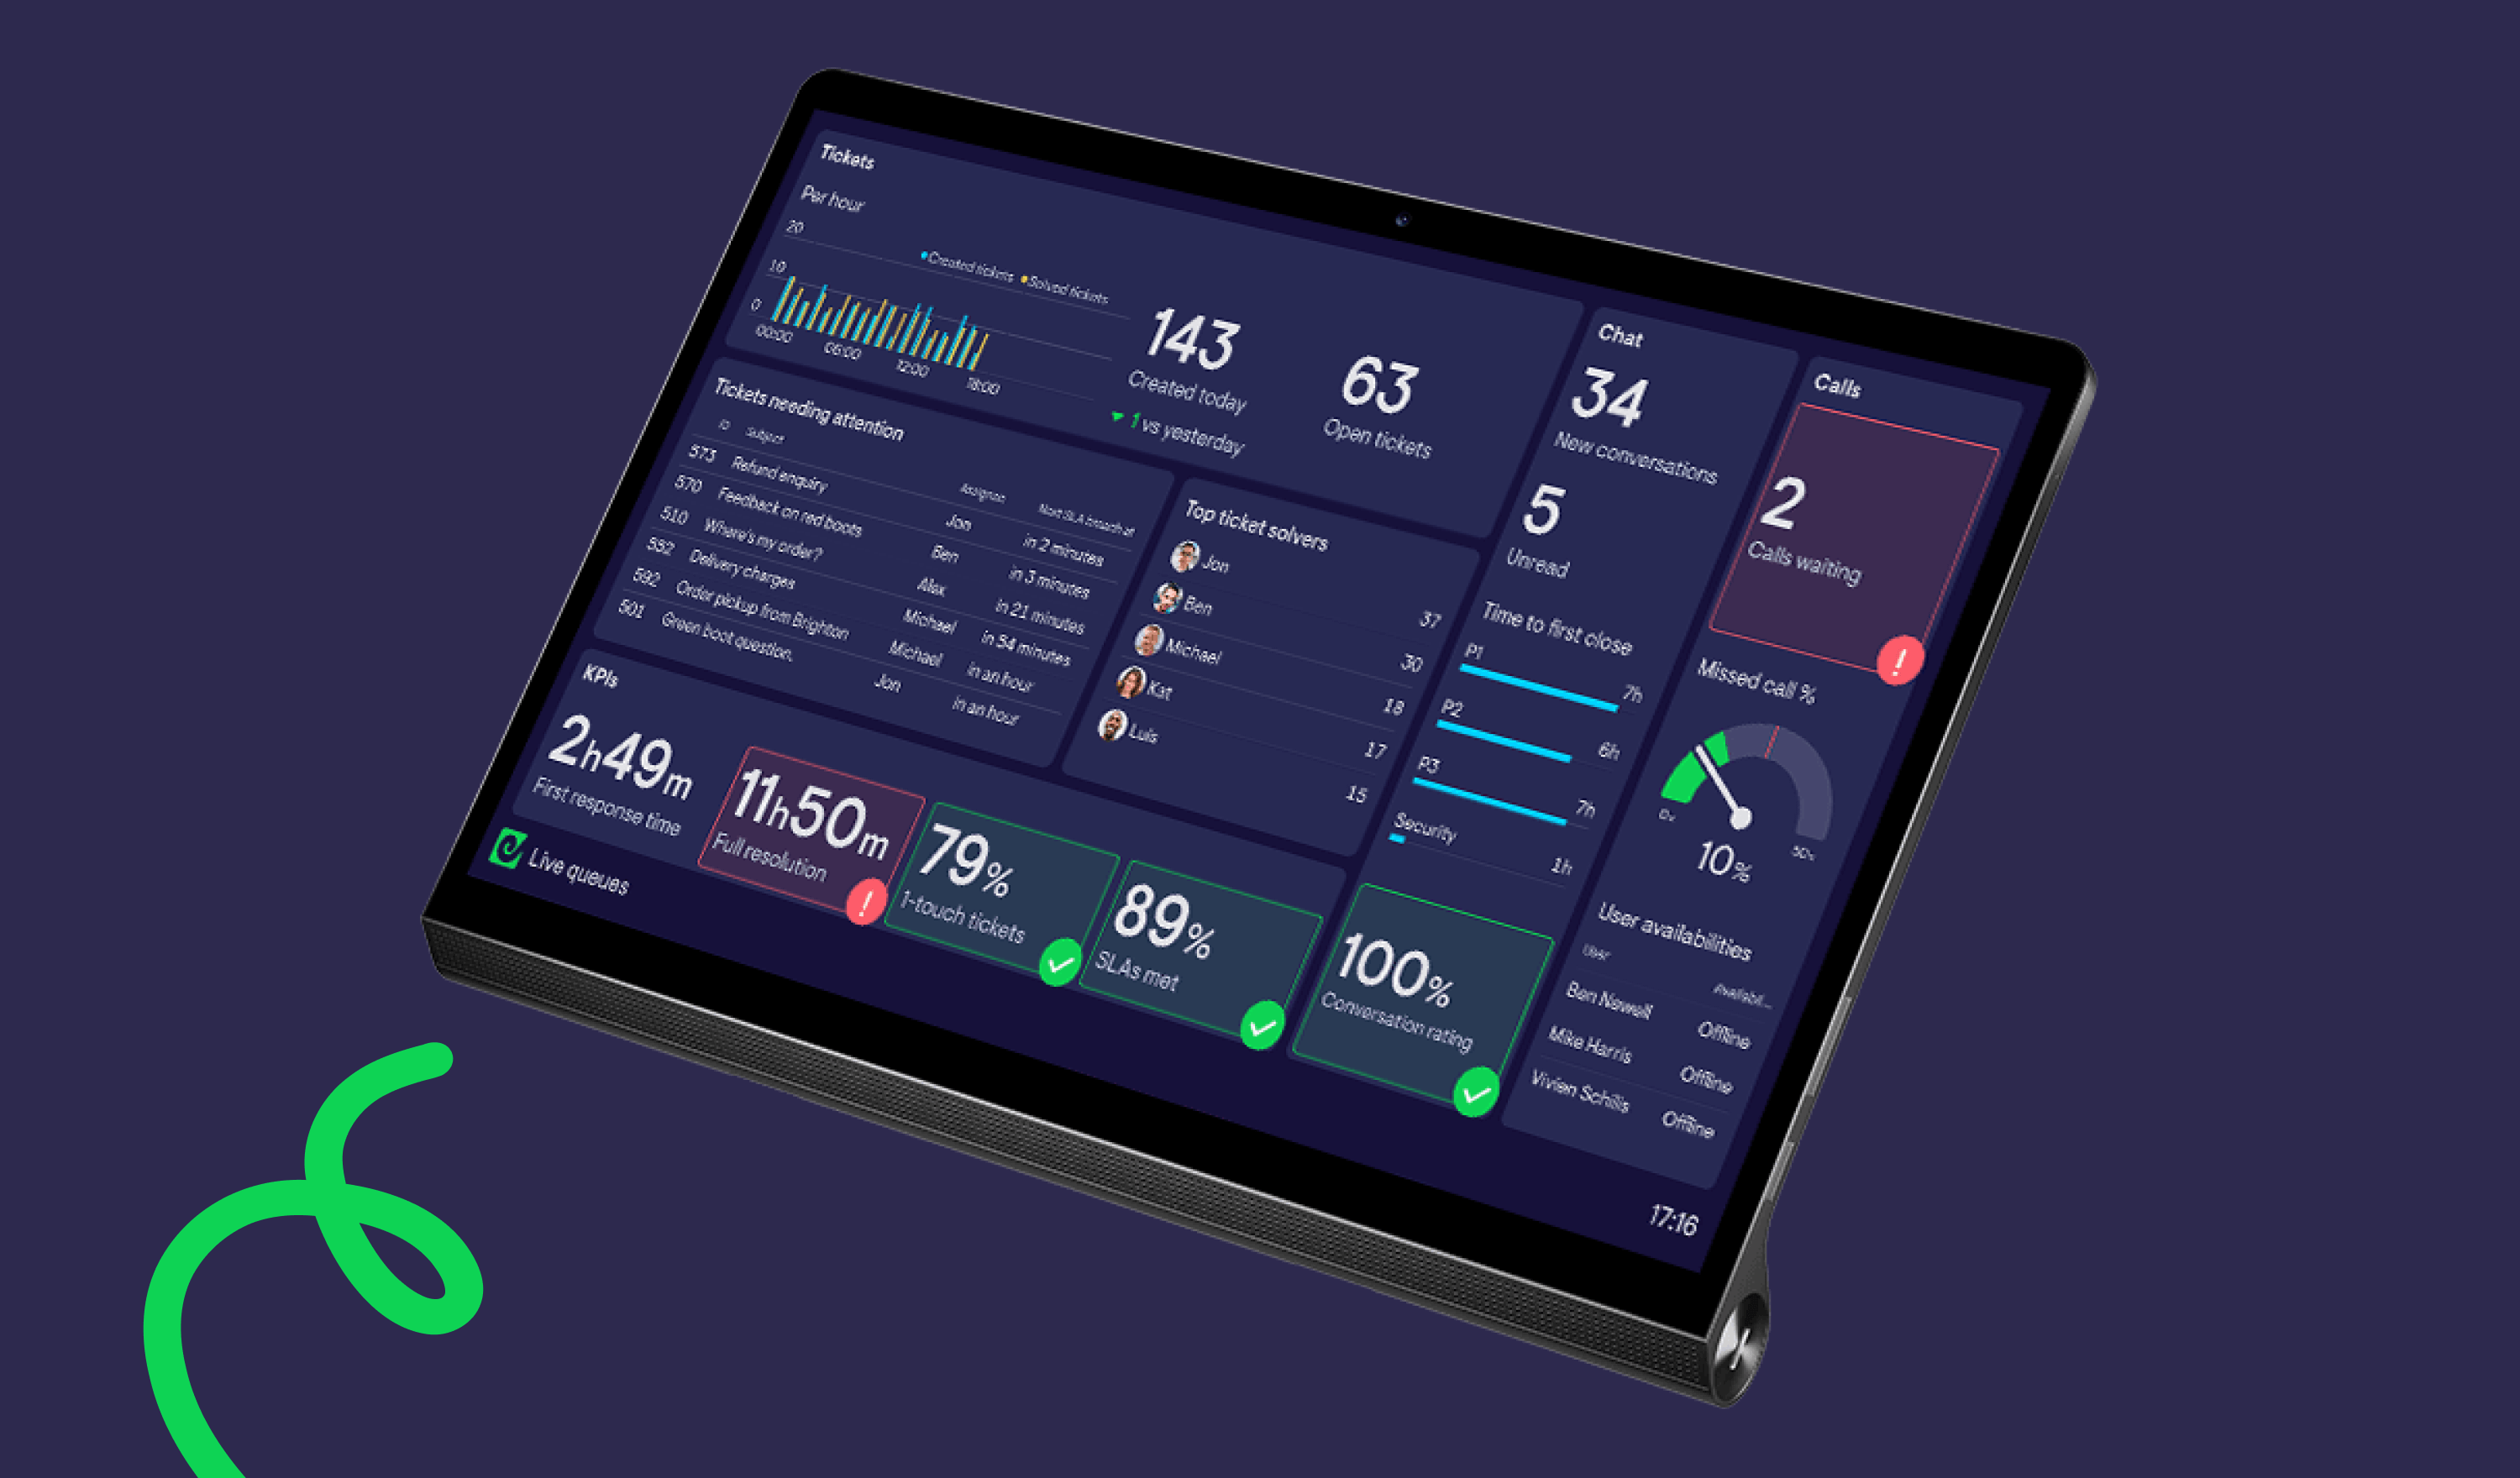
That’s where Geckoboard fits alongside Zendesk.
Geckoboard connects directly to Zendesk and turns custom and standard metrics into live dashboards that support leaders, agents, and stakeholders can understand at a glance.
Teams use Geckoboard to keep SLAs visible in real time, share backlog and workload context with agents, and create accountability without manual reporting. Metrics that were previously hidden within Explore are now available to everyone, creating visibility into the work support teams do every day.
Geckoboard dashboards can be shared across TV screens, Microsoft Teams, Slack, email, shared links, and can even be embedded directly into Zendesk. Regardless of where or how your team works, they should have access to real-time data that helps them perform at their best.
As a bonus , many commonly missing custom metrics can also be created directly in Geckoboard with just a few clicks, without writing Explore formulas. That allows teams to spin up real-time dashboards highlighting their most critical metrics in minutes.
Bringing it all together
Custom metrics are essential for support leaders using Zendesk as their customer support platform. It’s not a matter of if, but when you’ll need to begin reporting on data that falls outside Explore’s default metrics.
Zendesk provides the data, but not the everyday metrics most teams rely on to manage performance. Custom metrics fill that gap.
Whether you build them yourself from scratch, use ready-made formulas from the Zendesk Explore custom metrics library, or surface them through live dashboards in Geckoboard, the goal is the same.
Create metrics that reflect the most important data your team needs to meet its service levels. Visualizing that data with a tool like Geckoboard makes sure your team can act on it in real time.
That’s when Zendesk reporting starts to influence behavior, not just document it.
