Editor's note: this is a guest post by Adam Rogers, content marketer at Kayako.
The more effort you require from a customer when making a purchase, the greater the risk you run of them churning - that is, canceling their subscription or not making a repeat purchase.
Forrester found that 77% of customers say “valuing their time is the most important thing a company can do to provide them with good online customer service.” If these customers aren’t getting the service they feel they deserve, 55% of customers are quite happy to abandon their shopping carts.
But what about the customers that are patient enough to stick around? Well, 61% of your customers are searching your website for an answer, and only 11% successfully find an answer on your FAQ page. Either the customer will pick up the phone as a last resort or just bounce entirely.
Keep customers engaged with intuitive self-service
What if your customer could get the answer they need in seconds?
Self-service is the most effective way for customers to get the answers they need and reduce workload for live support teams. And it can be surprisingly easy to set up and optimize when you focus on the correct customer service metrics.
Today, only 28% of customers report that they primarily rely on the phone as their main support channel. That means a staggering 72% of your customers are going to your company’s website.
If your self-service isn’t answering their question, your customer will send an email or engage in a live chat before they think about calling. With this data in mind, it’s both frustrating and costly to invest and rely on phone support. Chances are, if a customer has to call to get the answer, they will likely bounce to a competitor with better self-service.
With so many possible customer support metrics to analyze, it can be overwhelming to know what KPIs you should track. Keeping a close eye on the success of your help center content is one of the most important ways to keep your self-service channel healthy and relevant.
Customer Support Metrics and KPIs You Should Track
You can keep your self-service up-to-date with the following self-service support KPIs:
1. Knowledge base views
Monitoring knowledge base (a.k.a. support center or help center) views allows you to see how often your customers attempt to self-serve and find their own answer.
If your knowledge base gets thousands of hits per month, look to the articles with views in the single and low double digits first. Consider eliminating very low-volume articles that take substantial time to keep updated. You’d be surprised how many customers and reps won’t complain, and how much extra time you’ll save on editing and updating those articles.
2. Pages viewed per session
Pages viewed per session gives you a clue as to what information your customer needed and which articles could be improved.
For example, if you find that customers are viewing certain articles frequently, but you’re still receiving lots of calls or emails about those topics, you should improve those articles with clearer explanations, images and even a short recorded video.
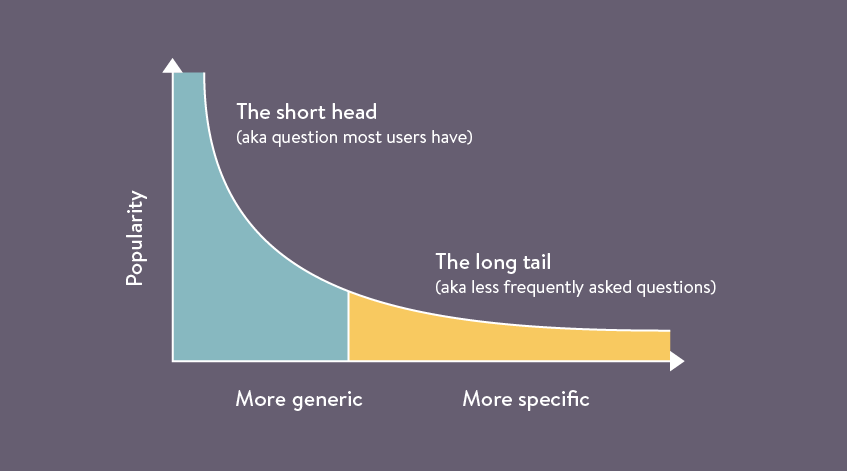
Keep an eye out for articles that might only get 30 views out of your 10,000 monthly views, but solves a problem that your biggest customers face - review each article with the context in mind. Consider reorganizing your knowledge base or help center accordingly. Put the most helpful topic - the one your customers ask about the most - front and center.
3. Ratio of views to submitted tickets
Monitoring the ratio of help center views to submitted tickets helps you to see how well your customers are able to self-serve and how many inbound tickets you are able to deflect.
You want the number of views to be relatively high (compared to the number of submitted tickets or calls), because you want to have more people self-serving than talking to your agents. This metric shows that customers are prioritizing your self-service for help instead of using another channel to contact your support team.
4. Number of positive votes
Some help centers allow your customers to cast a vote on the helpfulness of an article. Looking at the number of positive votes means you can see which ones are most helpful.
Review those poorly performing articles and republish with better consistency. Make sure that you track your publishing dates to look for changes in metrics. If an article fails to acquire positive votes even after several revisions, consider that it might be better served with human-to-human contact.
5. Bounce rates
Measuring your bounce rate helps you to see viewers who are using the content on your help center, or if they are just simply clicking off the page.
If you have a very high bounce rate, it’s likely that customers don’t have trust in the content they have found, or it’s not relevant to the issue. Think about presenting the information in your help center a little better by using:
- Easier navigation and menus
- Table of contents for each area of your product
- User-friendly language
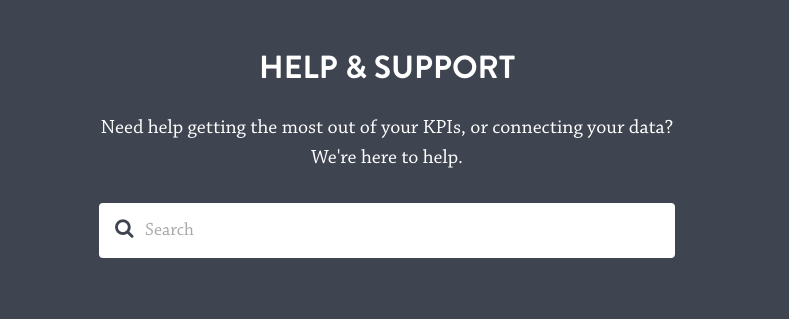
Example of an intuitive support center with user-friendly language:
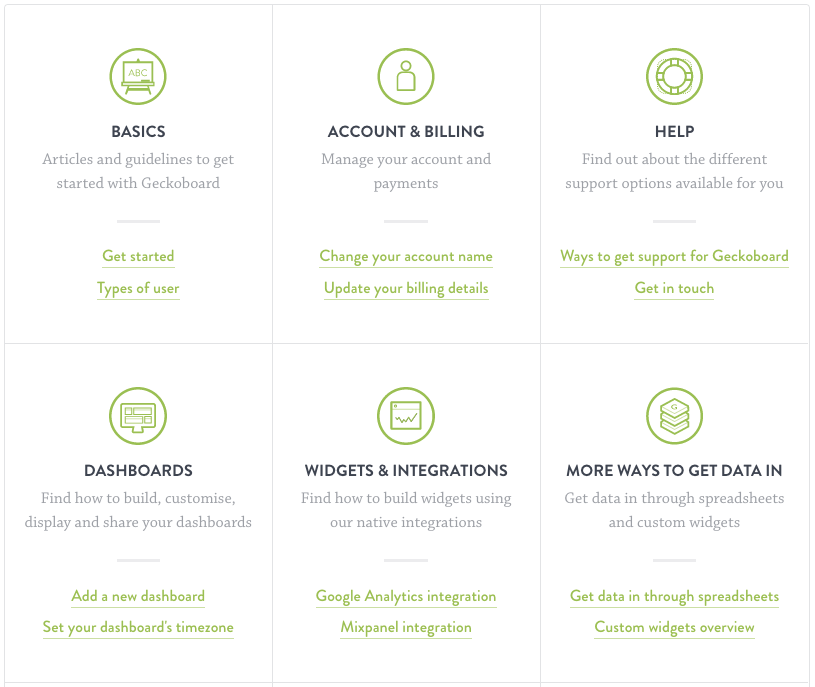
Example of easy navigation in a support center:
6. New vs returning users
Looking at new vs returning users allows you to see what proportion of customers are turning to your help center for self-service support.
If you find you have higher volume of returning users, it may mean that your customers are unaware that your support center exists.
If you have a higher volume of new users and few returning users, it could mean that your customer support center isn’t helpful, so your customers are turning to alternative support channels instead.
Audit regularly for a healthy help center
Auditing is like clearing your browser’s cache. Doing it once isn’t good enough. Audits should be done regularly to maintain a healthy help center.
It’s important to create a schedule to do this, whether weekly, monthly or quarterly. Regular content audits ensure you are connected to customer trends and satisfaction ratings. You’ll discover what’s working, what isn’t, and what kind of help your customers really need.
Improving your support center and knowledge base not only helps increase customer satisfaction but can also help with search engine optimization (SEO) and search rankings (if the support center is hosted on your site).
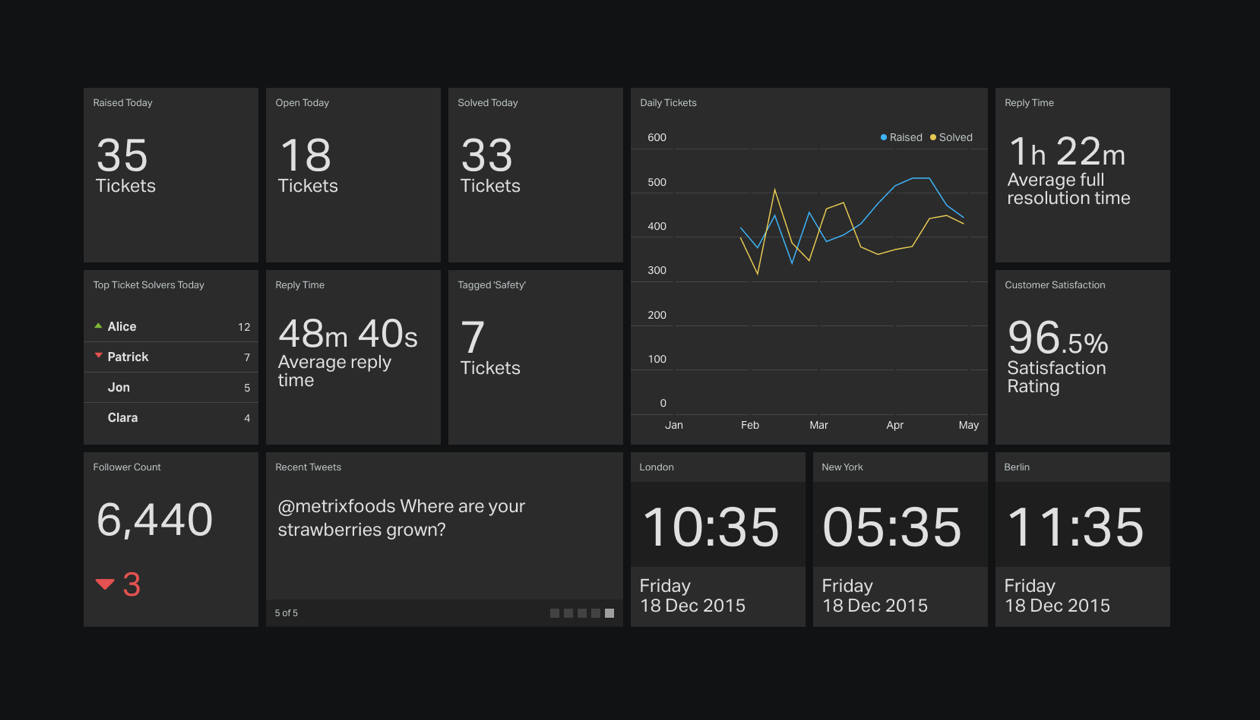
If you want to fully optimize your help center, communicate and monitor your customer support KPIs and metrics in real-time with a TV dashboard. Constantly tracking metrics enables you to see issues quickly and take corrective action.
Example of a customer support dashboard:
Improve customer experience and prevent disloyalty
If you want to reduce your call volume, then you need to start investing in better self-service and not more staff to handle simple queries. Keep your customer support easy to use: 96% of customers who had high-effort experiences reported being disloyal, compared to only 9% of customers with low-effort experiences who reported being disloyal.
You can improve your customer experience by analyzing what’s in your help center, how it’s helpful, and what needs improving.
While gathering and evaluating customer support metrics may be time-consuming, all those numbers contain valuable, actionable insights that will help you to improve your self-service, provide a better customer experience, and ultimately prevent customer disloyalty.
Guest Post:
Adam Rogers is a content marketer for Kayako helping customers get better at customer service. You can find Adam’s writing all over the internet, but on his own blog he focuses on content marketing strategy. You can find him on Twitter or Linkedin.
