
Customer support is a vital aspect of business in any industry - it’s how you address questions and concerns and resolve problems so customers continue using your product or service. Yet many customers dislike contacting support. A Statista survey found that 60% of respondents worry about long hold times, and 59% are concerned they will be transferred to different departments and have to continually repeat their problem.
By improving your support team’s efficiency, you can reduce friction for customers, so they leave support interactions feeling positive and satisfied. And the first step toward increased efficiency is tracking customer support metrics that give you a clear picture of your team’s performance and your customers’ experiences.
With dozens of customer support metrics to choose from, deciding which ones to prioritize can be daunting. That’s where we come in! We identified five metrics to help you monitor your team’s efficiency, stay on top of support tickets, and keep an eye on customer satisfaction.
1. Customer Satisfaction (CSAT)
Customer satisfaction (CSAT) is a measure of how happy your customers are. It’s based on a survey, which customers usually fill out after interacting with your support team. Though the survey’s exact questions may vary, it asks customers to rate their experience on a scale, which allows you to quantify the often-qualitative metric of client satisfaction.
CSAT is an essential customer support metrics. Ultimately, the goal of customer support teams is to help clients and ensure they are happy. CSAT measures the success of these efforts and offers insight that comes directly from the customer.
How to calculate CSAT
[ Number of positive responses / Number of total responses ] X 100 = CSAT (%)
The definition of a “positive response” will depend on your questions and your scale. If the customer can respond on a scale of one to five, with five being the best experience, then you would probably count a four or a five as a positive response. A three would be neutral, and a two or a one would be negative.
Consider breaking CSAT down by support channel to see if customers are more or less satisfied when contacting your team by phone than by chat, email, or other channels. If your CSAT is low, looking at individual sources might give you an idea of where to focus improvement efforts.
2. First Response Time
First response time, also called first reply time, is the time between when a customer submits a support ticket and when a customer support representative provides an initial response. First response time is a measure of your support team’s efficiency because it indicates how long a customer has to wait before being helped.
No one wants to wait for a long time to hear back about a problem they’re having, so keeping your response times short can lead to greater customer satisfaction.
“At Geckoboard, we have found that timeliness and speed has a direct correlation with satisfaction,” says Luis Hernandez, VP of customer success at Geckoboard. “A first response perceived as fast can set you onthe right track for a positive first impression.”
You can track first response time for each customer support rep, as well as the average across the team. If the average is too high, tracking times for individual agents can help you see who might need additional help or training. According to Zendesk, 12 hours is a good first response time for email, two hours or less for social media, and an hour or less for live chat.
How to calculate first response time
Sum of first response times / Number of tickets = Average first response time
First response time for a single ticket is the number of hours or days between the customer’s initial support request and the first contact from a support rep. Companies typically measure this time in business days, so weekends and off-hours will not bring down your average response time.
Give your support team a boost
With Geckoboard’s real-time dashboards, everyone knows exactly what’s happening in CS right now.
Find out more
3. Average Resolution Time
Average resolution time (ART) is the average time it takes your team to address a support ticket, from when the ticket is first opened to when it is resolved and closed. Long resolution times mean long wait times for customers, which can impact satisfaction rates and, ultimately, customer retention.
Though resolution time will vary by company, you can use industry benchmarks to see how your average resolution time compares to companies in your industry. If your ART is high week over week, it might indicate that your current support processes are inefficient or that your agents’ workloads are too high. Talk to your support team to find out where they are encountering problems and what you might be able to do to speed up the ticket-resolution process.
Also look at the average resolution time per agent for the whole team. This will help you see if any particular team members are struggling.
How to calculate average resolution time
[ Total resolution time for all resolved tickets / Number of resolved tickets ] = Average resolution time
Check average resolution time regularly to watch for changes. A steady increase over time may indicate your support team needs more help or training to deal with new, more complex issues that customers are bringing up.
A similar customer support metric you might track is average handle time (AHT). This measures the average time an agent spends on a single call or chat exchange with a customer. Unlike average resolution time, AHT doesn’t include the time a client spends waiting for an agent to pick up their ticket and make initial contact.

4. Ticket Backlog
Ticket backlog is the number of unresolved tickets in your queue at the end of a given period. For example, if your support team works Monday through Friday, you might look at ticket backlog at the end of the day on Friday to see how many customers will have to wait until Monday for their issue to be resolved.
“Backlog is important because every open case means you have a customer waiting to be satisfied and each case has a ‘holding cost,’” says Marci Reynolds, EVP of service delivery and customer experience at ACI Worldwide.
Customer support metrics like ticket backlog provide a snapshot of potentially dissatisfied customers — each open ticket represents someone waiting for your team to respond and solve their problem.
How to calculate ticket backlog
Sum of open tickets = Total ticket backlog
Compare ticket backlog to total ticket volume to see the percentage of submitted tickets still unresolved at the end of the week. If the ratio is high week over week, you may need to expand your support team.
5. Ticket Volume
Ticket volume is the total number of support tickets your team receives during a set time frame. Monitoring ticket volume is vital for planning workload distribution among support agents, determining time frames where you might need more agents available, and identifying current gaps in coverage.
A variation of this metric is total conversations, which counts all engagement with customers, whether through an official support ticket, a Facebook message, or another social channel.
Track changes in ticket volume over time to identify times of day and days of the week when your team receives the most support requests. With this information, you can more effectively plan shifts and distribute workload. Not only does this help ensure that your support agents are not overwhelmed, but it also increases your team’s response efficiency, so customers spend less time waiting and get their issues resolved more quickly.
How to calculate ticket volume
Sum of all tickets = Total ticket volume
Finding ticket volume is simply a matter of adding up all tickets submitted during the time frame in question. That might be a single day, a week, or a month.
Display customer support metrics in real time with a robust dashboard
Customer support metrics like ticket backlog and ticket volume fluctuate constantly. With a real-time customer support dashboard, your team can see these changes as they happen. A real-time dashboard consolidates data from multiple support channels and updates regularly, so your team can immediately see any issues and stay on top of incoming tickets.
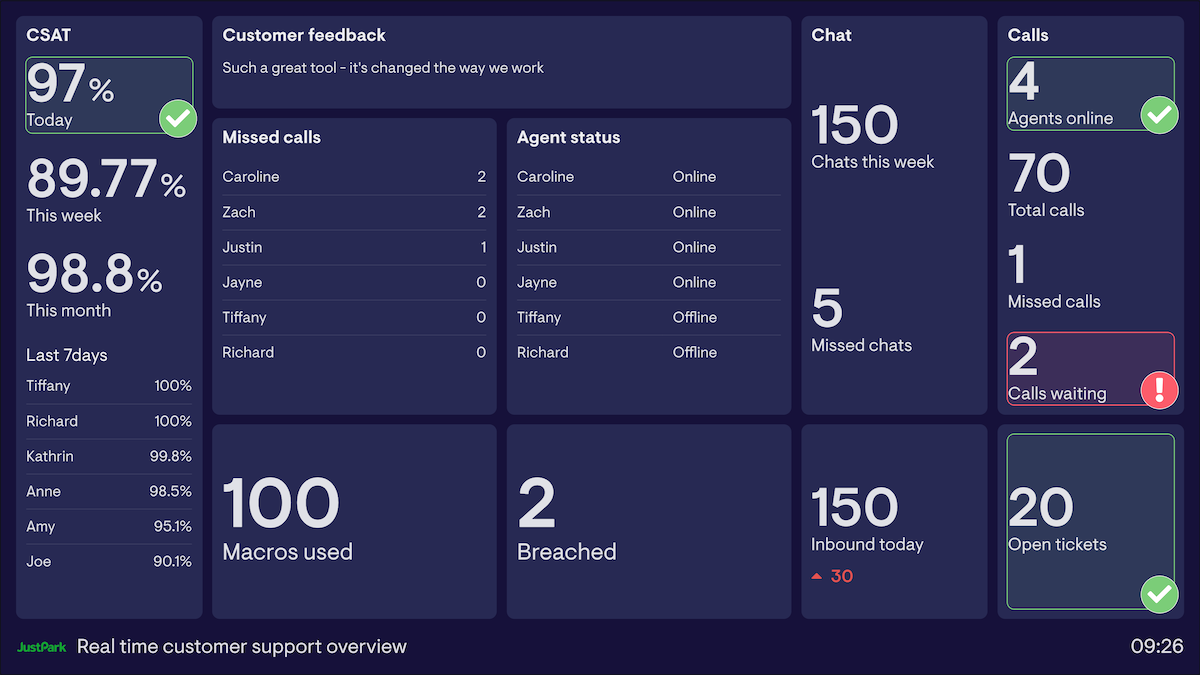
JustPark’s real-time customer support dashboard. Contains sample data.
Here are a few other customer support metrics you might add to your real-time dashboard:
- Call abandonment rate
- Current open tickets
- Current calls waiting
Want to see how a real-time dashboard can help your customer support team? Start your free trial today!
