
Email marketing may not always receive the same level of fame and attention as other digital marketing channels, but for many businesses, email continues to be the backbone of their communications plan.
Whether it’s increasing direct sales or supporting your longer term brand building, the performance of your email marketing strategy can have significant implications for the health of your business, overall.
Unfortunately, for many companies, the email metrics and KPIs that reveal the effectiveness of their email marketing stay buried – in spreadsheets and across different marketing platforms (which only a select few have access to). And worse – some of the most important email marketing metrics receive no attention at all.
We’ve created a guide to the nine most important email marketing metrics to track right now – including how to calculate them and how to make sense of them.
We’ve also used our dashboard tool to show how easily you can integrate data from multiple sources (such as Klaviyo, Mailchimp, Google Analytics and your own spreadsheets) into one, easy to understand dashboard. Dashboards like these keep the health and overall performance of your email marketing visible, for all the team to see.
1. Email Bounce Rate
Bounce Rate measures the percentage of emails that don’t get delivered. To calculate the Bounce Rate for your email campaign, divide the number of emails that weren’t delivered by the total number of emails sent:
Email Bounce Rate (%) = (Number of emails that bounced / Total number of emails sent) * 100
So if you send:
100 emails
95 emails are delivered successfully
5 emails bounce
Your Bounce Rate is 5%
Alternatively, your marketing platform may use Successful Delivery Rate instead of Bounce Rate. Successful Delivery Rate is the percentage of emails that do get delivered – so it’s just the inverse of Bounce Rate.
In the example above, Successful Delivery Rate would be 95%.
Hard and Soft Bounces
Bounce Rate includes ‘Hard Bounces’ and ‘Soft Bounces’. A Hard Bounce occurs because the recipient’s email address no longer exists or is invalid. Whereas a Soft Bounce occurs because of an issue on the recipient’s side. This could be anything from a full inbox that can’t receive any more email – to their server’s spam filter rejecting your email.
Monitoring Bounce Rate
Bounce Rate might seem like an odd metric to include first in our list. But marketers ignore this metric at their peril – not only is it an important indicator of the overall health of your list, it’s an area that regularly requires further action or attention.
For example, if you are using a lower-tech email platform, you will need to create a system for processing and cleaning emails that bounce (particularly Hard Bounces). Otherwise these defunct contacts will build up. And continuing to send emails to these contacts will likely damage your reputation with Internet Service providers (ISPs).
And even if your marketing platform cleans bounced emails automatically, you should continue to monitor this metric, and investigate anything abnormal.
I once managed a mailing list where we saw a sudden spike in the Bounce Rate. Our marketing platform dutifully cleaned the contact records by unsubscribing them. However, it was only on further inspection we realized that one of our biggest clients (a local government institution) had changed their URL structure (and their email address syntax along with it) causing over 1,000 of our contacts to bounce.
Because we regularly monitored the Bounce Rate, we were able to notice the change, and re-establish mailing consent for these contacts.
2. Open Rate
One of the most widely-used email marketing metrics, Open Rate measures the percentage of recipients who opened and viewed your email.
But is it the most valuable metric to be tracking? Arguably not. (More on that later)
Be aware that Open Rate is calculated as a percentage of successful deliveries, not a percentage of total emails sent. You need to discount bounced emails when you calculate Open Rate.
Open Rate (%) = (Emails opened / Successfully delivered emails) * 100
Or if you prefer:
Open Rate (%) = (Emails opened / Emails sent - Bounced emails) * 100
If you send
100 emails
20 emails bounce
80 emails are successfully delivered
40 emails are recorded as opened
Your Open Rate would be 50%
Because 40 / 80 = 50%
What is my Open Rate telling me?
Open Rate is an indicator of how engaged your contacts are as a whole. A higher Open Rate generally reflects increased engagement, whereas a lower Open Rate indicates your audience is becoming less engaged.
Why is my Open Rate declining?
The first question to ask yourself is whether you are seeing a declining open rate over time, or a dip in Open Rate for just one or two email campaigns. A declining Open Rate generally reflects a lack of engagement, but there may be many short-term and long-term factors behind this:
- The subject line: the obvious place to start. Is your subject line enticing enough?
- The sender: who’s sending it? A named person? A brand? A team?
- The time/day/season: Open Rate can vary depending on when your audience receives the email. For example, B2B emails generally have a lower Open Rate when received on a weekend.
- Email dissatisfaction: “I haven’t found your emails to be valuable in the past so now I’m not going to bother opening them...”
- General email fatigue: “I receive too many emails from you to read all of them, even if I do find them valuable”
- The ‘Other Inbox’: some email service providers, including Outlook, now provide an ‘other’ inbox feature. Theoretically, less important emails are filtered here, via a sorting algorithm. It’s a tricky one to account for, but sending unengaging emails over time is a surefire way to land yourself in this inbox purgatory.
- Spam, Spam, Spam… there are many factors, including spammy subject lines and previous spam complaints, that might cause your emails to end up in the spam folder - with lower Open Rates to show for it...
Is Open Rate accurate?
You should be aware how Open Rate is tracked. Email marketing platforms track opens by including a tiny, transparent one-pixel image in each email. If that image is loaded, they will mark it as a successful open. (They also count link clicks as evidence of opens).
Because a proportion of users (and their IT departments) configure their email clients to block images (or at least not download them automatically), the Open Rate is rarely accurate. The true Open Rate is usually much higher.
Can I trust Open Rate?
You can trust Open Rate as a comparative measure of performance, especially within the same mailing list – where factors such as image blocking are likely to be consistent across the sample. An increase in Open Rate over time will likely reflect an increase in the true Open Rate.
But be careful when making decisions on a more specific level. Just because your email tool records that a new subscriber has not opened the last two emails, it doesn’t always mean they haven’t opened them.
What is a good Open Rate?
It depends.
You can find various benchmarks online, which normally quote an average Open Rate of between 15 - 25%. However, figures like these might be a good way to set the expectations generally (especially if you have one or two overzealous stakeholders expecting Open Rates of 90% and above). But these are hardly benchmarks to live by.
It’s far better to align your targets meaningfully with your own strategic goals, which, by definition, are different for everyone.
3. Click-through Rate
Click-through Rate (CTR) is the percentage of successful deliveries that result in at least one click.
So if you send:
100 successfully delivered emails
40 emails are opened
20 of the recipients clicked one or more links in the email
Your CTR would be 20%.
Because 20 / 100 = 20%
Click-through Rate (CTR) is not to be mistaken with Click-to-open Rate (CTOR)
4. Click-to-open Rate
Click-to-open Rate (CTOR) is the percentage of opened emails that resulted in at least one click.
So if you send
100 successfully delivered emails
40 emails are opened
20 of the recipients clicked one or more links in the email
Your CTOR would be 50%.
Because 20 / 40 = 50%
You may also see other terms used:
- Click Rate (CR): Mailchimp uses this term instead of CTR. Click Rate usually means the same as CTR
- Unique Click-through Rate (UCTR): this usually also means the same as CTR
- Total Click-through Rate (TCTR): this refers to the total number of clicks divided by the total number of opens (/or sometimes successful deliveries). It’s not a well-used metric because it takes into account multiple clicks from the same users, and so can be heavily skewed by outliers.
To make matters worse, occasionally, you will also see people (and marketing platforms) use CTR when they are in fact referring to CTOR.
Yes.
I know...
The point is
It’s very easy to make a misstep here, or find yourself comparing apples with oranges. Don’t take any of the given labels for granted, and check how these figures are calculated with your marketing platform. Regardless of how the metrics are labelled, the thing to bear in mind is that CTR and CTOR – two distinct metrics – are both worth considering as you develop your dashboards and reporting.
Is CTR better than CTOR?
In truth, they are measuring different things. CTR is better for measuring the overall effectiveness of your email campaign, whereas CTOR can be helpful for measuring the effectiveness of the actual contents of the email.
Many marketers prefer CTR because it is not affected by Open Rate, which as we have discussed, can be inaccurate.
5. Unsubscribe Rate
Unsubscribe Rate measures the percentage of people who were sent your email and then unsubscribed from your list. To calculate the Unsubscribe Rate, divide the number of people who unsubscribed, by the total number of emails sent:
Email unsubscribe rate (%) = (Number of unsubscribes / Number of emails sent) * 100
So if you send:
100 emails
10 people unsubscribe
Your Unsubscribe Rate is 10%
Unsubscribe Rate is an important metric to track on your email dashboard because it’s a good sense check of how engaged your contacts are by the emails you’re sending. A steady increase in unsubscribe rate over time might suggest that people are getting email fatigue and that you might be sending too many emails. Or it could indicate the content you’re sending doesn’t match your subscribers’ expectations.
Because Unsubscribe Rate is generally recorded against individual email campaigns, rather than the list as a whole, it can be tempting to assume a causal link between each email campaign and its respective Unsubscribe Rate. When in reality, unsubscribes tend to be driven by more general or long-term factors, like these:
- “I don’t find your emails valuable any more”
- “You send too many emails and are clogging up my inbox”
- “This is no longer relevant to me”
- “I don’t remember signing up to this newsletter in the first place”
6. Number of Conversions / 7. Conversion Rate
Conversation Rate is the percentage of recipients who complete a stated goal as a result of your email, such as a signup or a purchase – normally outside of the email via your app or website.
Conversion Rate (%) = (Number of recipients who complete a stated goal / Number of emails sent) * 100
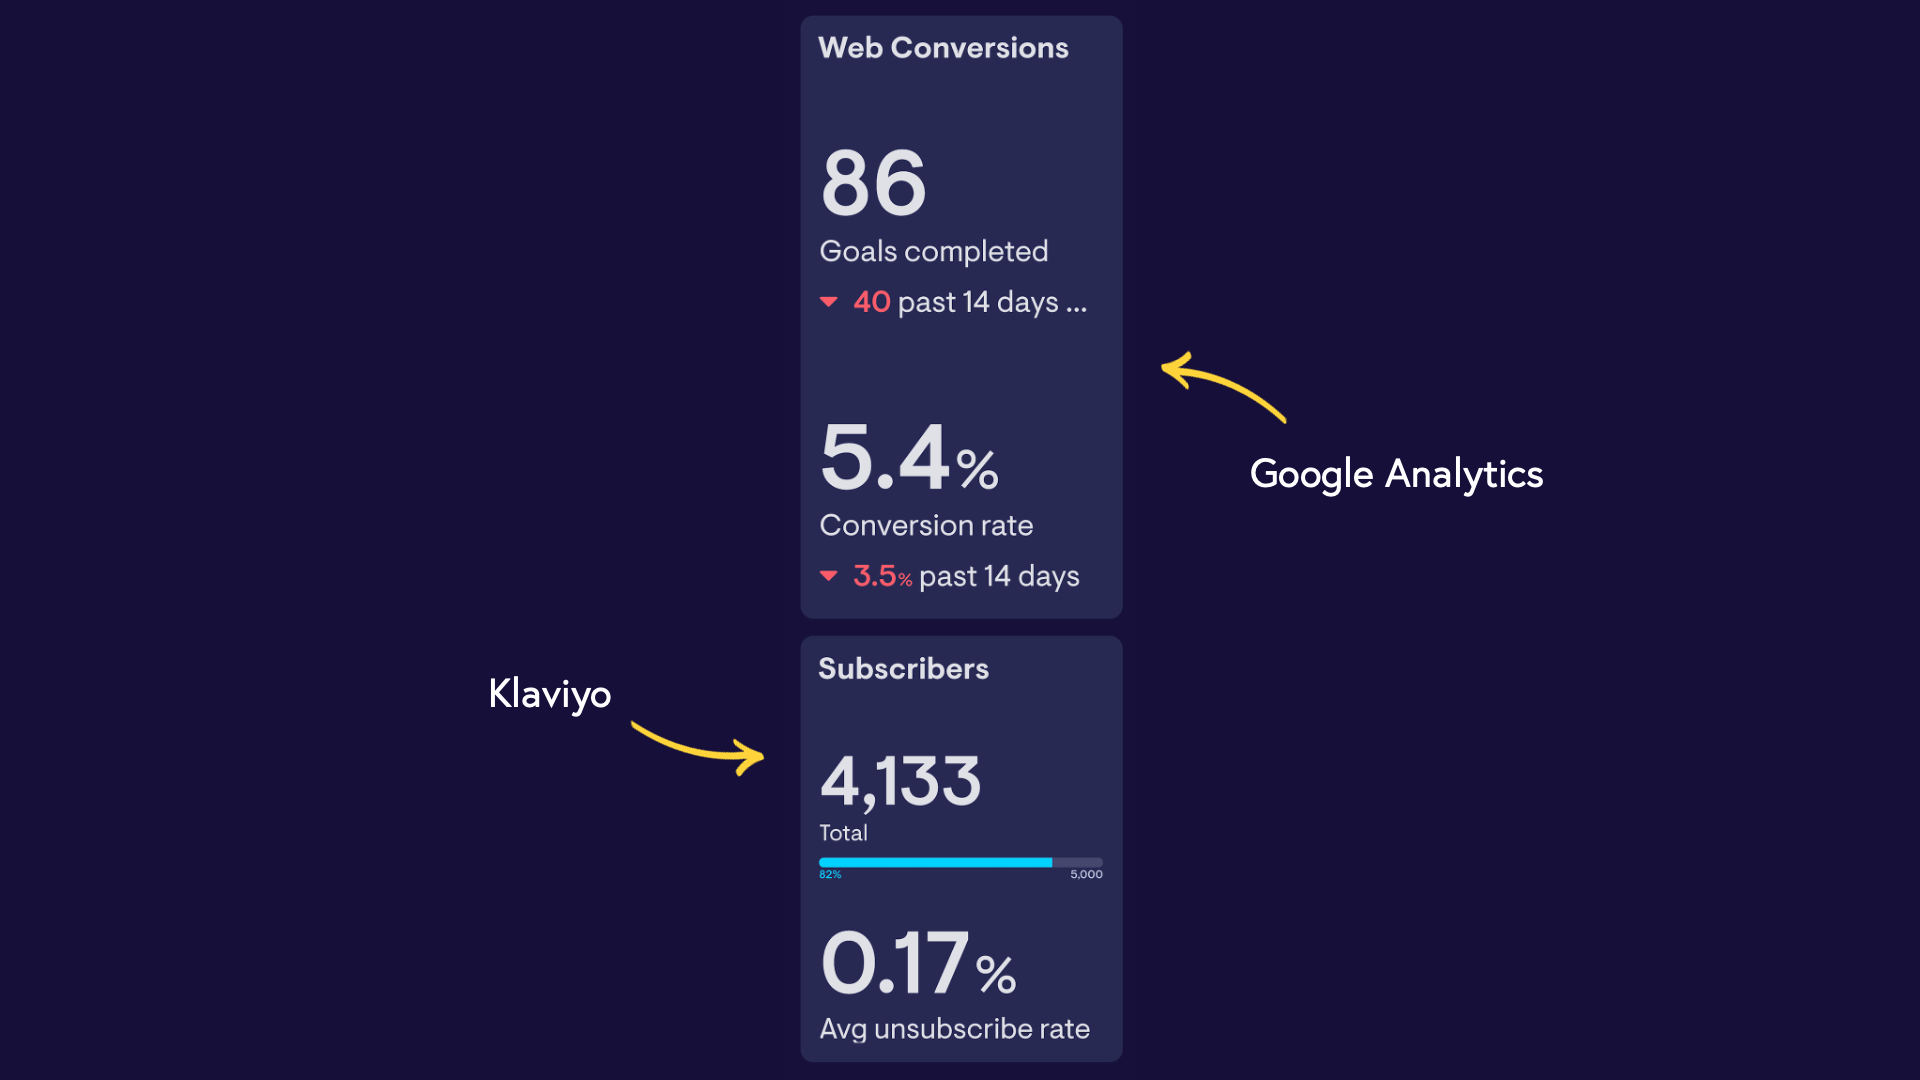
Here we hit a major stumbling block for most email marketers. Achieving conversions is often the primary goal of the emails we send. Yet, many email tools are not able to pull in the data from 3rd party sources (such as Shopify or Google Analytics) where this conversion data is recorded.
You may be using an all-in-one marketing platform capable of joining up the customer journey. But that’s not always possible or practical for every business.
Most of the time, we can get around this by setting up UTMs, by tracking Acquisition by Source data in analytics, and through spreadsheet analysis. However, this does make it difficult to communicate the full picture to team members, because the different metrics inevitably stay buried in multiple places.
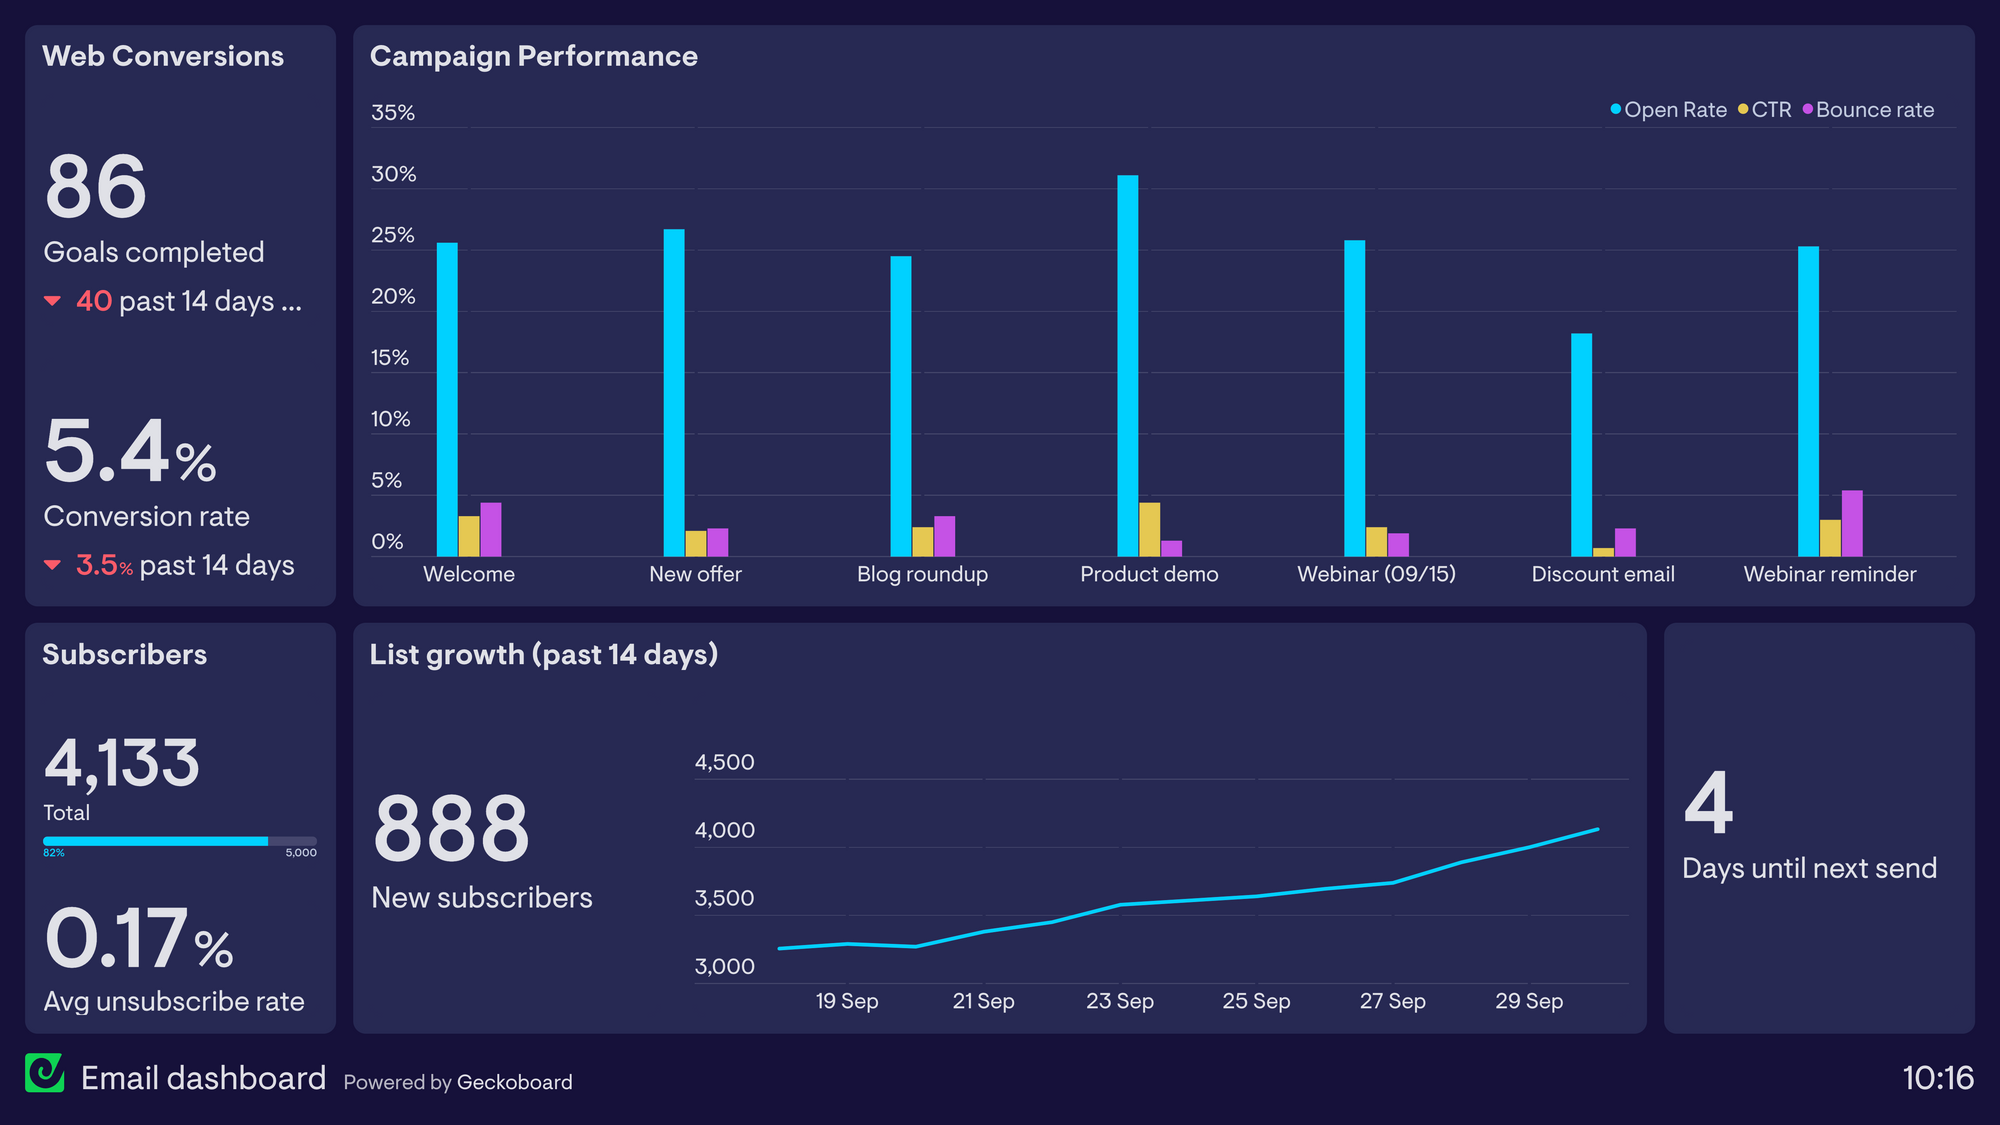
This is where a data dashboard, like Geckoboard, comes into its own. By pulling metrics from multiple sources and displaying them, side by side, in real time, you can keep the team updated on the health of your email marketing overall. We can see Key Performance Indicators such as Website Conversions alongside secondary metrics such as Subscribers and Unsubscribe Rate.
8. Number of Subscribers / 9. New Subscribers
It’s useful to communicate the overall size and growth of your subscriber list via a dashboard. This metric is directly affected by other marketing initiatives and channels, but it’s usually something teams have low awareness of, unless it’s reported on directly.
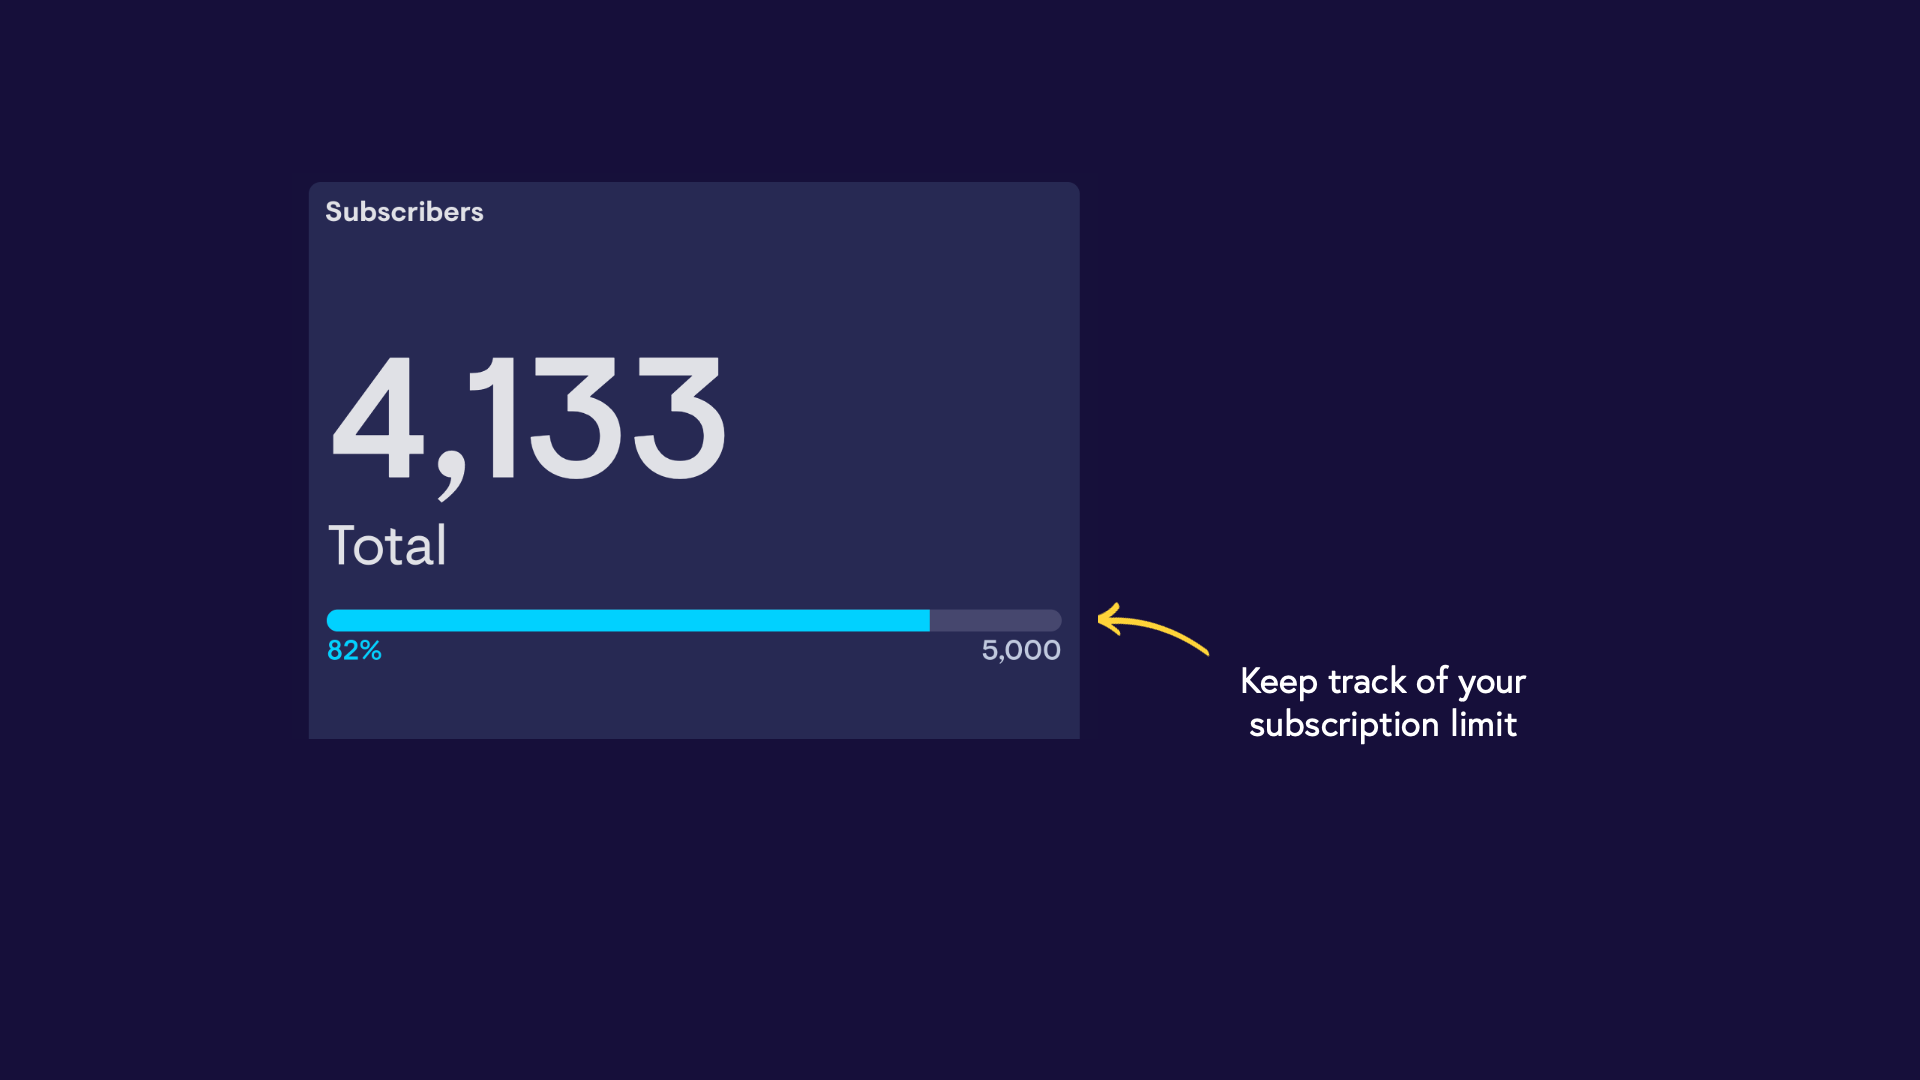
On a practical level, it also makes sense to track Number of Subscribers via a dashboard if your email marketing platform has pricing tiers based on the number of subscribers or contacts you have. By tracking subscribers over time, you can easily predict when your email list is likely to exceed the limit of your email marketing software’s current package.
Bonus inclusion: Number of Days Until Next Email
Although it’s not a reporting metric, one bonus addition you can make to your email dashboard is a countdown until your next email goes out.
This keeps deadlines front of mind for the whole team, and is particularly useful if you regularly find yourself chasing others for content and assets. It also helps to avoid scheduling conflicts with other teams who might be planning emails around the same time.
Use your existing data to build an email dashboard
A dashboard tool like Geckoboard integrates with more than 60 data sources (and counting) – so you can quickly and easily bring together key metrics from the tools you use every day, including Google Sheets, Excel files, Mailchimp, Klaviyo, Shopify and HubSpot.
And beyond email marketing, Geckoboard can be used to create dashboards that support every area of your marketing strategy. So check out our Marketing Dashboard Examples today.
