For many businesses, the run-up to the holidays is one of the most high-stakes times of the year. Whether you work in ecommerce, marketing, customer support or sales, the holiday season is one heck of a ride. So there’s no point pretending we’re not going to make mistakes along the way.
But what about the rookie mistakes? The ones that were oh-so-easily avoidable? Well, they’re the ones that are really going to sting, come January.
So this week, we wanted to keep things simple, and look at five easily avoidable mistakes you can make this holiday season. And explore how you can expertly swerve them by using a data dashboard.
1. "A webpage broke and we didn’t notice”
It goes without saying – if your website is down, you ain’t making money.
Sure, you’d hope it wouldn’t take too long to notice something major like your whole website going down. But what about the smaller, harder-to-spot issues that can be equally damaging in limiting access for your customers. Has a key landing page broken? Are there usability issues affecting specific devices? What about issues that affect certain geographies?
During the holiday rush, when it comes to downtime, every precious second counts. Because if your customers (well… somebody else’s customers, now) can’t access your website, then they have already moved on.
How can a dashboard help website monitoring?
A live dashboard that highlights website downtime can make the difference on your busiest days. By connecting your dashboard to services like Pingdom, you can quickly see if your site is creaking under a spike of traffic, or worse, completely down.
And on the same dashboard, you can also monitor website health metrics from Google Analytics, like bounce rate, page load timings or engaged sessions, which can reveal important usability issues. This is especially helpful if you quickly want to see isolated metrics for key pages, as well as the whole website.

2. "We took too long to respond to all the customer queries”
The holiday rush inevitably creates a massive uptick in customer queries and requests. Especially if your product or service is a popular choice for gift-givers. Because with gift-giving, our whole psychology shifts. You can expect more queries around delivery timings, delivery format and product suitability. Customers need to be sure that everything about this purchase is ‘just right’.
If your customer support tickets start to build up, or the length and quality of your response time starts to change, you need to be all-over that in a flash. Moving around your people and priorities, if necessary.
After all, if your customers are not getting quick, satisfactory replies from your support team, then they are outta there. Your competitors are only a click away.
How can a dashboard help you manage customer queries?
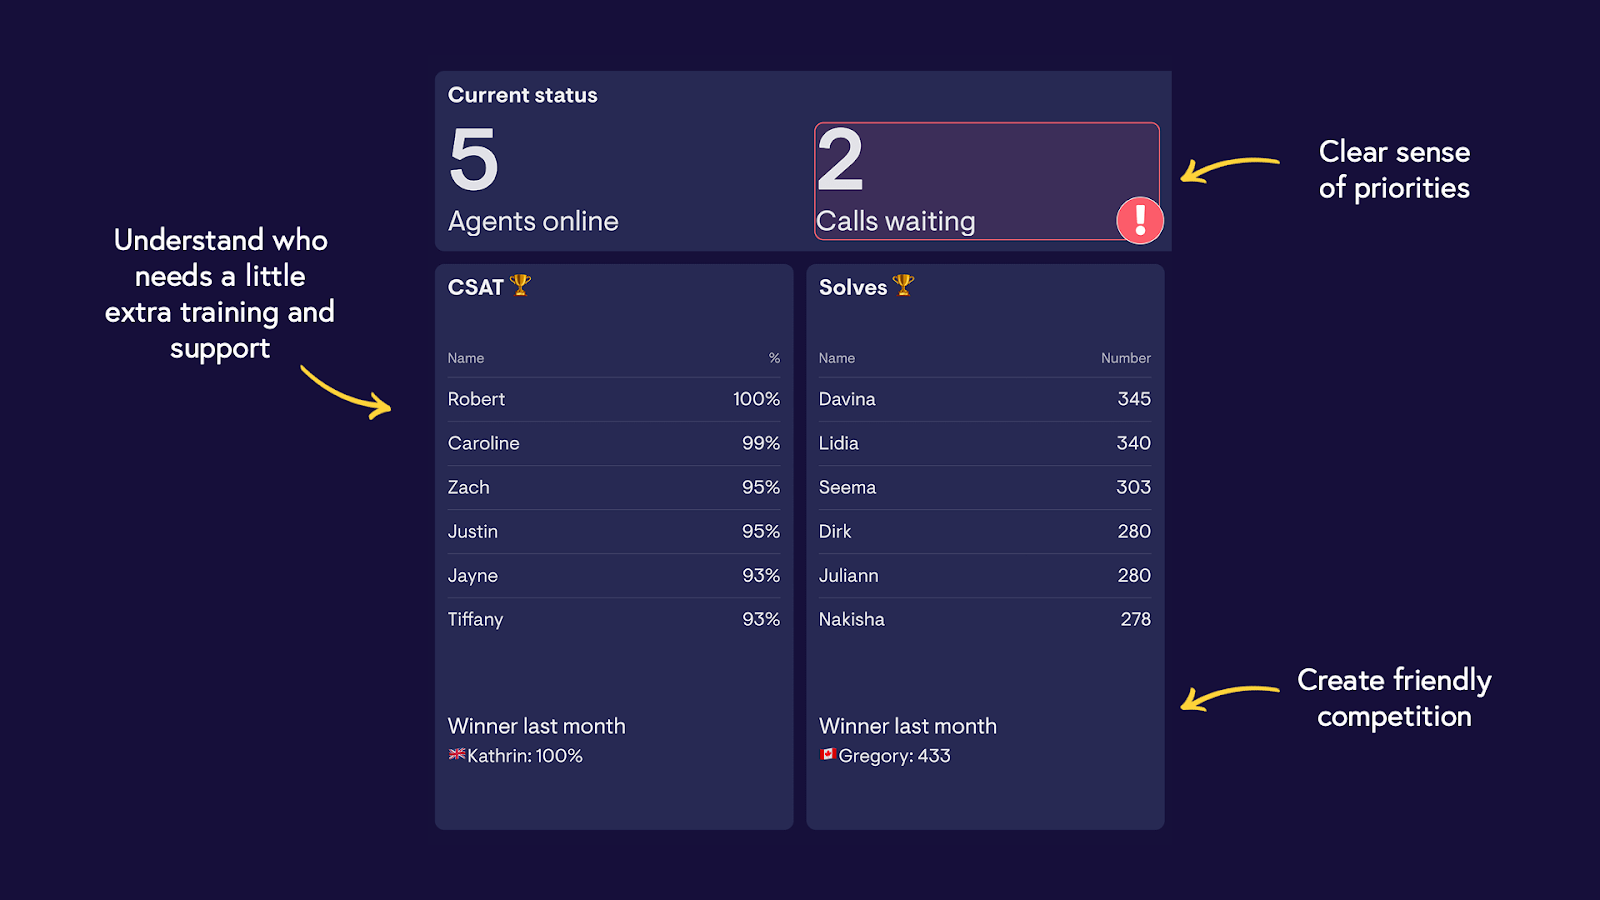
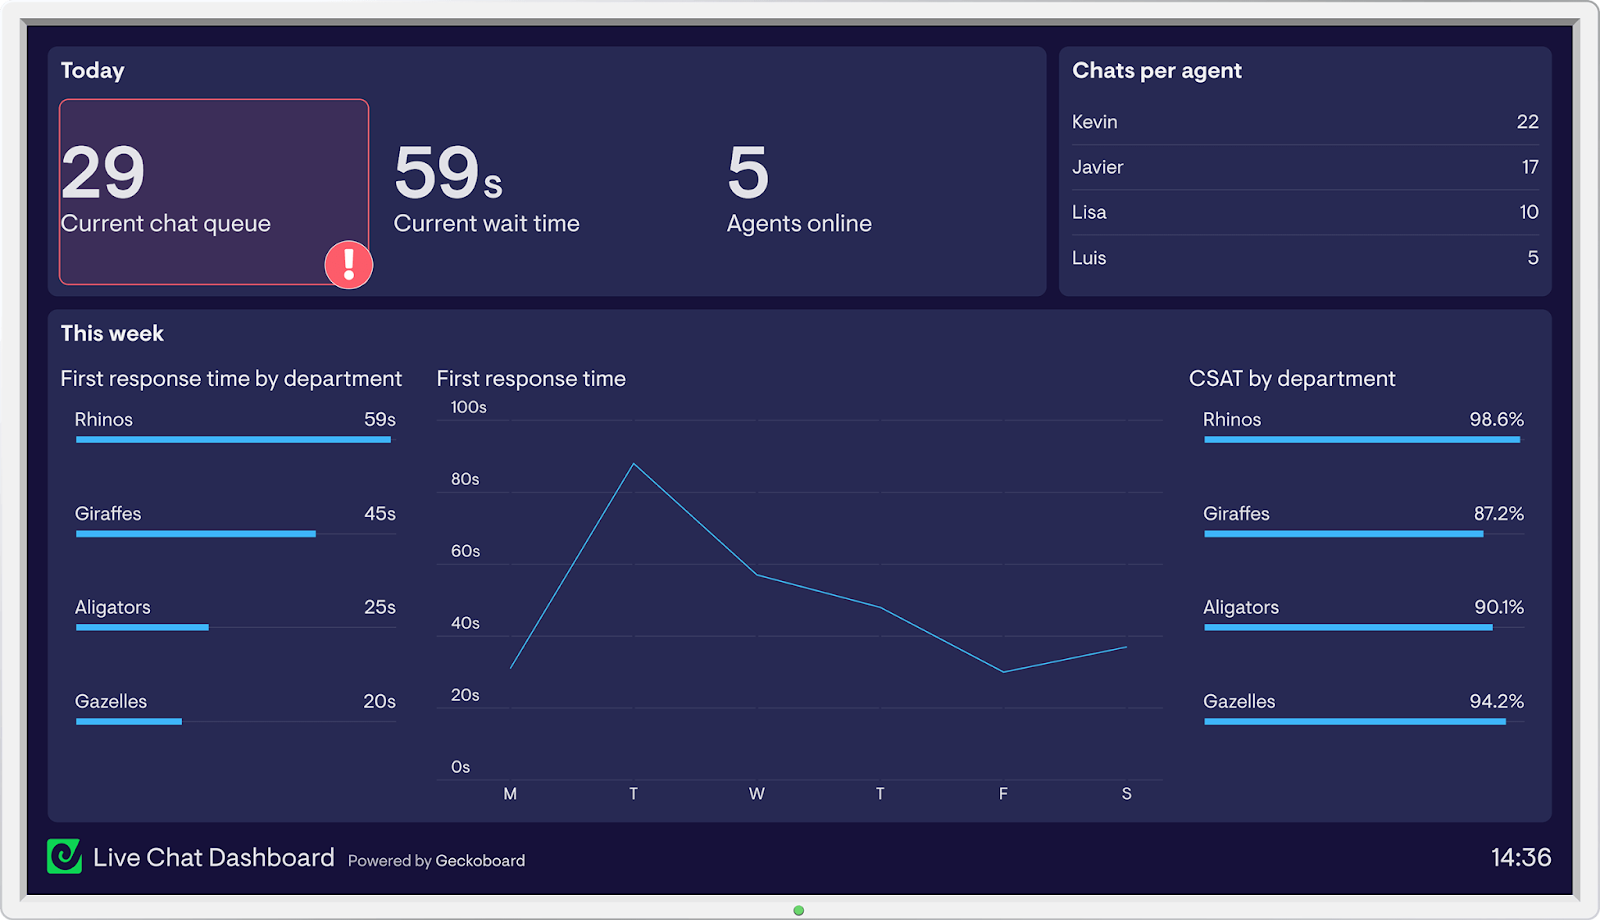
A live dashboard gives you that instant snapshot of how you are handling customer support. Monitor different support channels to see where the customer queries are coming from and show your agents where they need to focus in order to meet demand.
You can also keep a constant eye on crucial metrics like First Response Time (FRT) and Customer Satisfaction Score (CSAT) to see if these are meeting your usual expectations or SLAs.
If they’re not, you may need to rethink your support team’s processes or tooling, or even consider hiring more agents.
3. "We ran out of ad budget too early’ / ‘We didn’t spend all our ad budget”
The holiday season is normally a time to turn on the spending taps and run special seasonal advertising campaigns, as you try to bring new customers to your door.
At the end of any ad campaign, there’s always a long laundry list of things we’ve learned – copy we can improve, targeting we can tweak. If you’re using a ‘test and learn’ approach, the word ‘mistake’ might not even enter your vocabulary.
But poor budget utilization? Well that’s a mistake. A common mistake. One you can easily avoid.
You don’t want to find out you've spent December’s advertising budget by Black Friday, because your digital marketing manager accidentally mistook ‘lifetime budget’ for ‘daily budget’. Equally, you don’t want to get to New Year and find you’ve got mountains of ad budget left because your team weren’t aggressive enough with their campaign setup.
If the budget holder is the person managing the ads, this is less likely to happen. But when responsibilities are delegated, or if you’re running several campaigns across different platforms, these issues can easily occur. And in the rush of other priorities, Campaign Spend practically becomes a hidden metric, which you can only access within your different campaign platforms.
How can a dashboard help you manage ad campaigns?
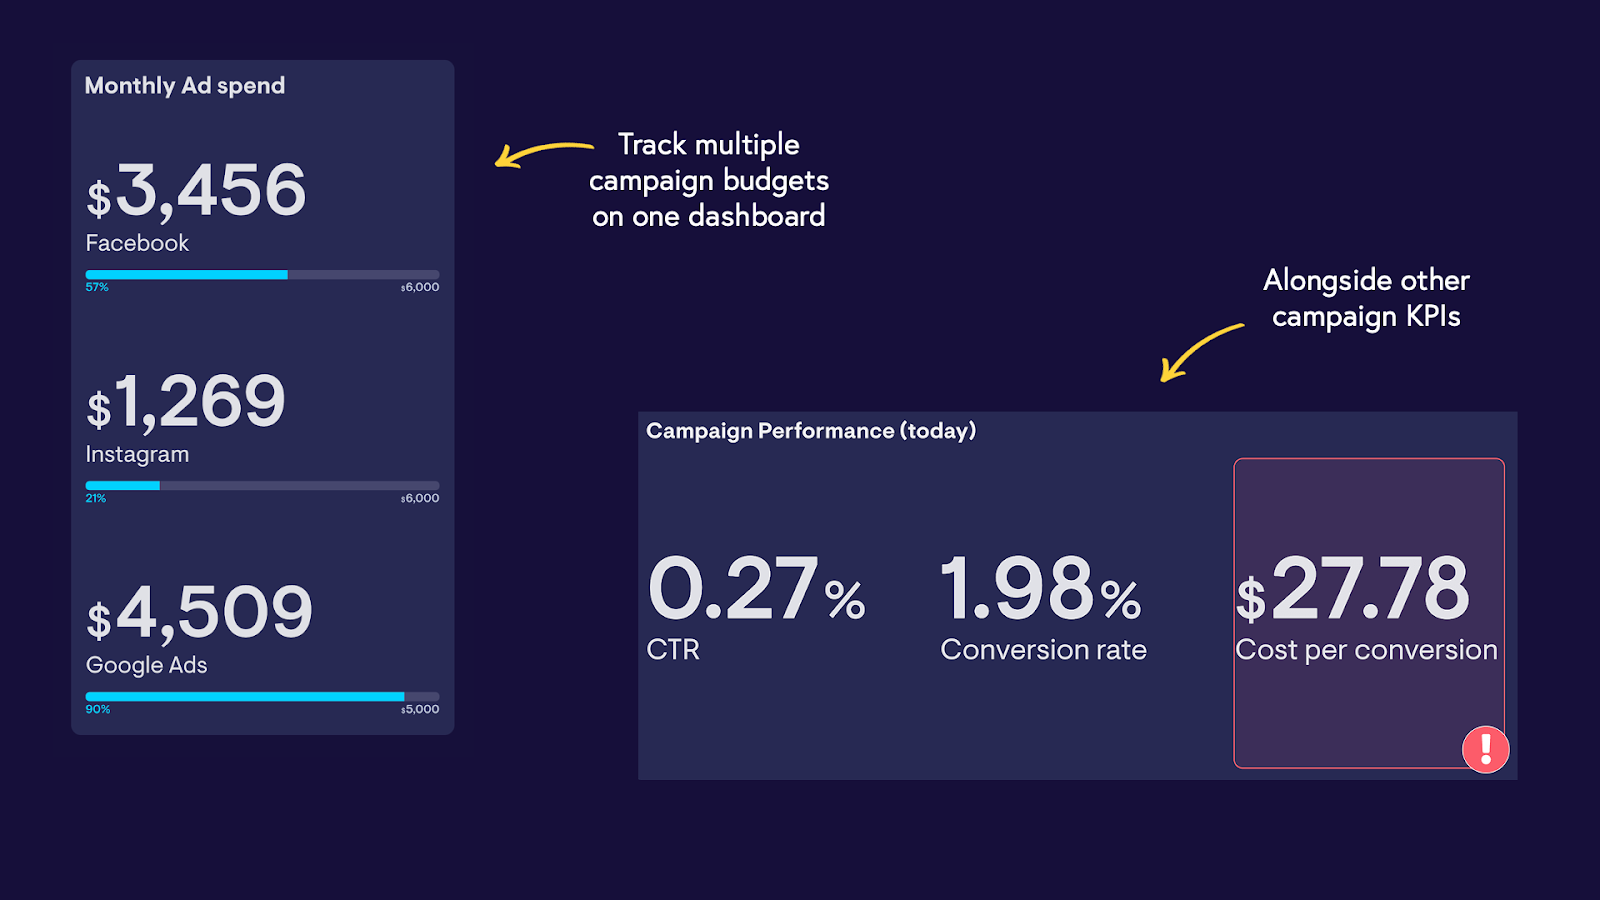
Check everything is on track with a single campaign dashboard, showing ad spend from across the different platforms you’re using, such as Google Ads, Facebook, Instagram and LinkedIn. You can break this out further to show your budget utilization for each individual campaign.
Plus, you can include other important metrics on your dashboard such as Conversion Rate and Cost per Conversion. So instead of waiting until January to review your performance, you can make quick decisions about which campaigns you should kill, tweak, and where to ramp up spending.
4. "We didn’t realize we ran out of stock”
You can add “we couldn’t ship in time” to this one too. We’re talking about fulfillment, of course. And it’s the backbone of any successful retail or ecommerce operation.
A clear understanding of your stock and fulfillment capabilities is crucial at any time. But during peak season, as things change quickly, you need that data instantly.
How can a dashboard help fulfillment?
Using a data dashboard to keep track of your stock in real-time will make sure everyone stays in the loop. Not to mention, you can also track other important KPIs related to fulfillment such as Supplier Lead Times, Inventory Accuracy, Perfect Order Rate, Backorder Days Out and Return Rate.
Many companies even find it beneficial to create a ‘warehouse dashboard’, which is prominently displayed in the warehouse. This helps strengthen the communication and understanding between fulfillment teams because everyone can see how the inventory is changing. It means they don’t miss important changes, and can anticipate issues before they become big problems.
For more on this, read our guest blog: 5 eCommerce KPIs to track over the 2021 Holiday Season
5. "Our temps didn’t know what they were doing”
At first, temps never know what they are doing. So that’s why it’s our responsibility to train them and show them the ropes.
But realistically, with seasonal workers, you’re never going to be able to invest the same amount of time on induction as you would with a full-time joiner. So induction becomes a careful balancing act – get the balance right and they will seriously help to lighten the load. Get it wrong and the whole exercise becomes counterproductive.
How can a dashboard help with temporary staff?
Your temps may be used to doing things a certain way from previous jobs, but dashboards that everyone on the team can easily access create a shared understanding of what ‘good’ or ‘bad’ performance looks like in your team.
Whether you are bringing in extra team members to help out in sales, customer support or another area of the business, openly sharing individual performance data – such as tickets solved or deals closed – can help you see which new staff are flying high, and who needs some extra training and support. More experienced staff might even jump in and help anyone who’s struggling without you necessarily needing to intervene.