Make your life easier with step-by-step guides to your favourite tools, and recommendations for new ones.
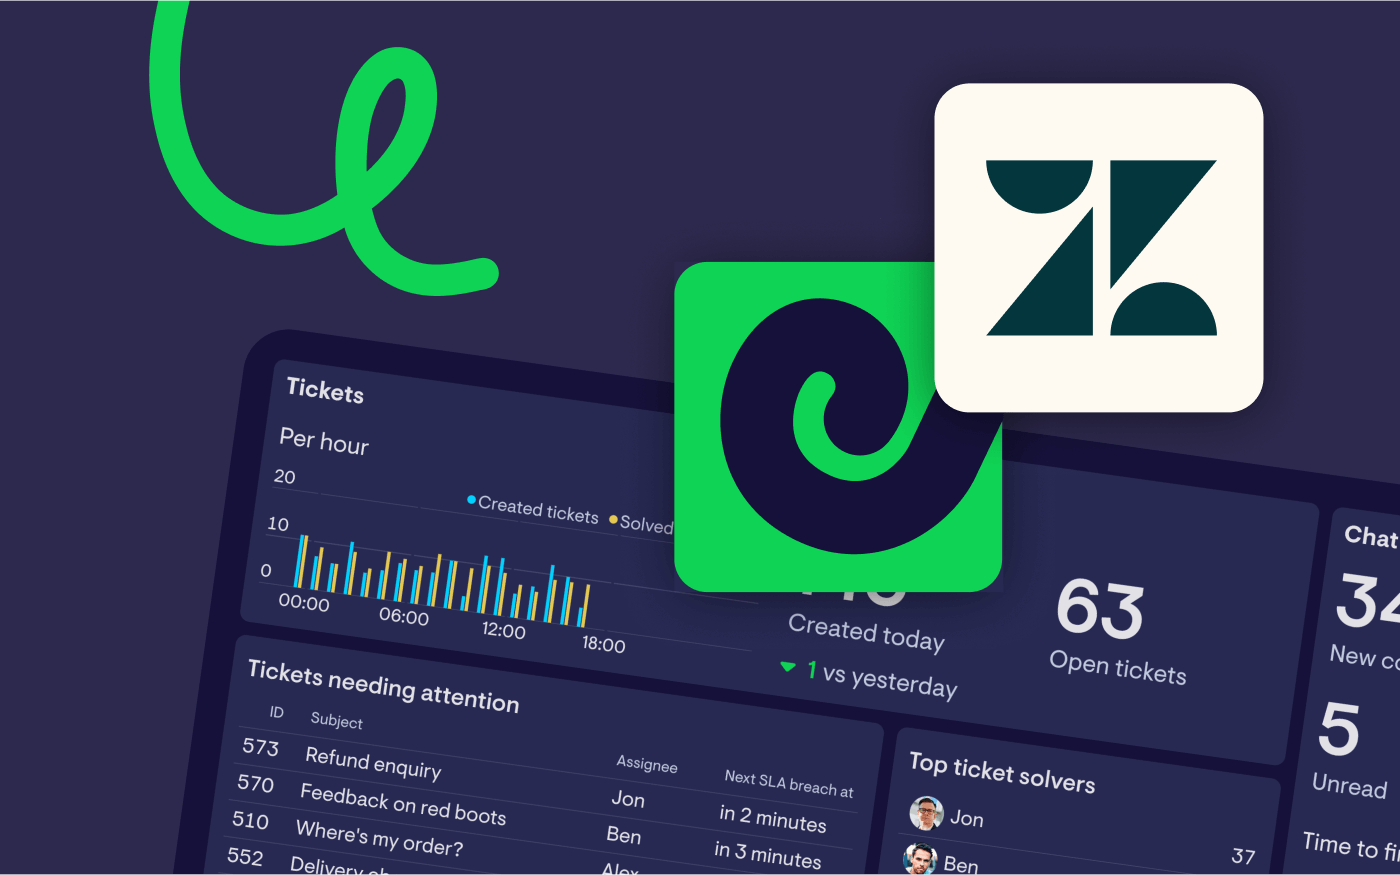
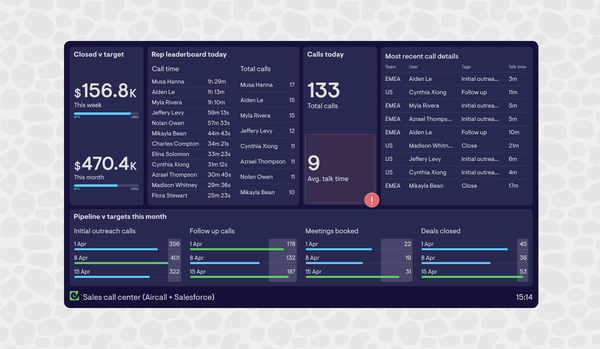
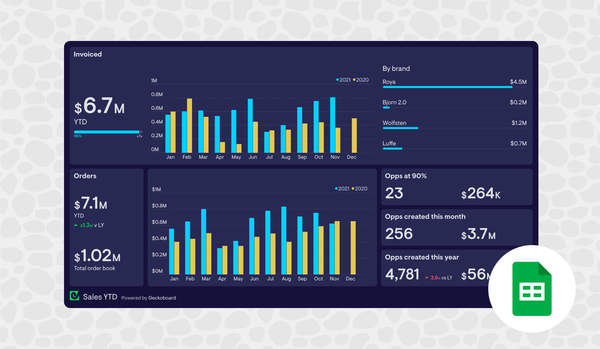
Geckoboard is the easiest way to make key information visible for your team.