If you work in a fast-paced business, it’s not hard to see why real-time analytics might be valuable. Being able to analyze live (or near-live) data can help you and your team react faster, and make more informed decisions in the moment.
Setting up analytics and reporting systems always has the potential to cause a headache – this is especially true when it comes to working with real-time data.
What’s more, most of the guidance on this subject tends to be written for larger organizations who have access to teams of data specialists and engineers. That’s why this article will focus more on some of the ways small to medium-sized businesses (and non-specialists) can utilize real-time analytics.
Why would a business need real-time analytics?
It’s important to remember that not all analytics tasks need real-time data. For many strategic decisions, a fixed sample of recent historical data will work just fine.
But there are many operational decisions that need to be made in response to what’s happening right now. And the quality of this decision making can be radically improved with access to real-time data. These types of decisions are relevant in all areas of a company including sales, marketing, support, finance, operations and fulfillment.
Some examples might include:
- An ecommerce business owner who has noticed incorrect orders are being shipped, and needs to get on top of the situation
- A marketing team, who’s noticed that shopping cart completions have dropped sharply, and needs to investigate why
- A customer support manager, who has noticed a sudden increase in First Response Time, and wants to know what’s causing this.
How to set up real-time analytics in your business
If you’re thinking about introducing real-time analytics to your business, you’ll probably want to understand some of the different approaches, rather than going all-in on a solution that might not be right for you.
In the rest of this article, we’ll explore the pros and cons of three different approaches:
- Using a data warehouse
- Using native reporting tools
- Using Geckoboard
RELATED: Choosing the best dashboard software for your business
1: Using a data warehouse
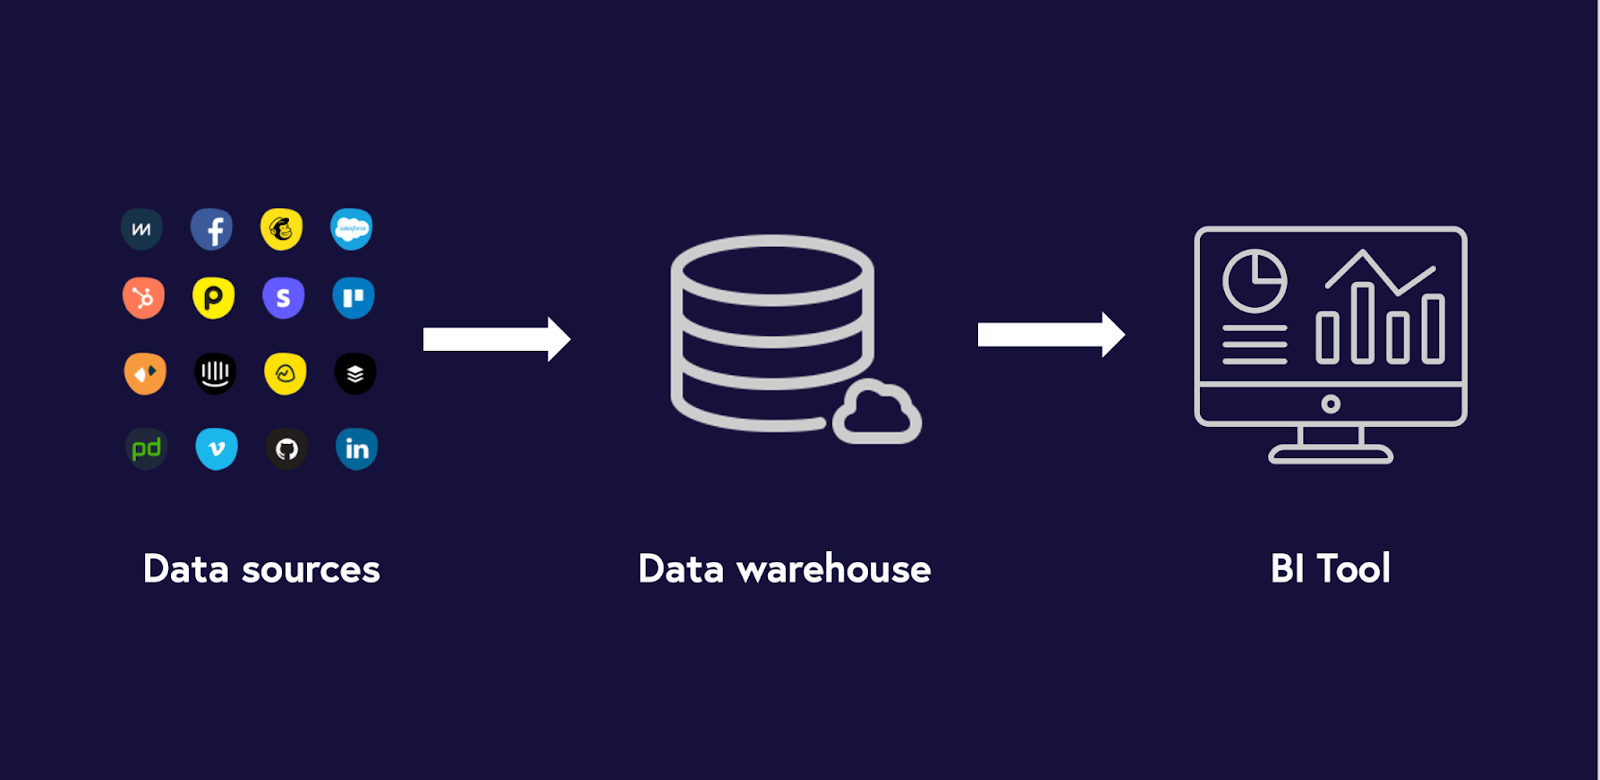
When you begin to research real-time analytics, you’ll notice that most of the guidance is geared towards the data-warehouse approach. However, this option is only realistic if you have access to data specialists and engineers who can also write SQL.
The basic premise involves creating a setup where all your data sources import into a data warehouse (such as MySQL). You can then use a BI tool (such as Tableau) to query that data, and conduct analysis.
To make this setup work for real-time data, you'll need to ensure that both the import of your data happens in real-time, and also that the data warehouse itself continually refreshes in real-time.
Here are some further resources on designing the architecture for a real-time data warehouse:
Pros
The obvious benefit of using a data warehouse is that all of your data is in one place. This means you’ll be able to make comparisons between different data sets, and calculate metrics using data from multiple sources. This will result in a richer level of analysis.
Cons
There are however several drawbacks to using data warehouses in this way:
- Complexity: Even for businesses with specialist functions, this is not an easy task. And for businesses without access to data specialists, this is just not a realistic solution.
- Refresh rates: To save on costs, most data warehouses refresh once or twice a day. Increasing the refresh rate to near-real time will radically increase costs.
- Getting data in: Depending on where your data is generated, you will need to build (or use) APIs that import data in real-time. Some of the business tools you use will make this easier than others.
2: Using native reporting tools
By this, we mean using the native reporting features within the business tools you already use - such as Shopify, Zendesk, or Google Analytics.
Pros
The major benefit to this approach is that a) there is no setup involved and b) reporting is usually priced into your plan.
Cons
The downsides include:
- Efficiency: If your data is stored across multiple platforms, it can be cumbersome and time consuming to monitor all the metrics you need to track.
- Team access: Access to these platforms is usually managed by a select group of people in the organization. Meaning it can be hard for others to access the data they need to see, at least without paying for extra licenses or training. (Your CEO doesn’t want to have to learn how to navigate Facebook Ads.)
- Refresh rates: Not all business tools offer real-time data refresh. Zendesk Explore, for example, offers hourly or daily refresh depending on your plan.
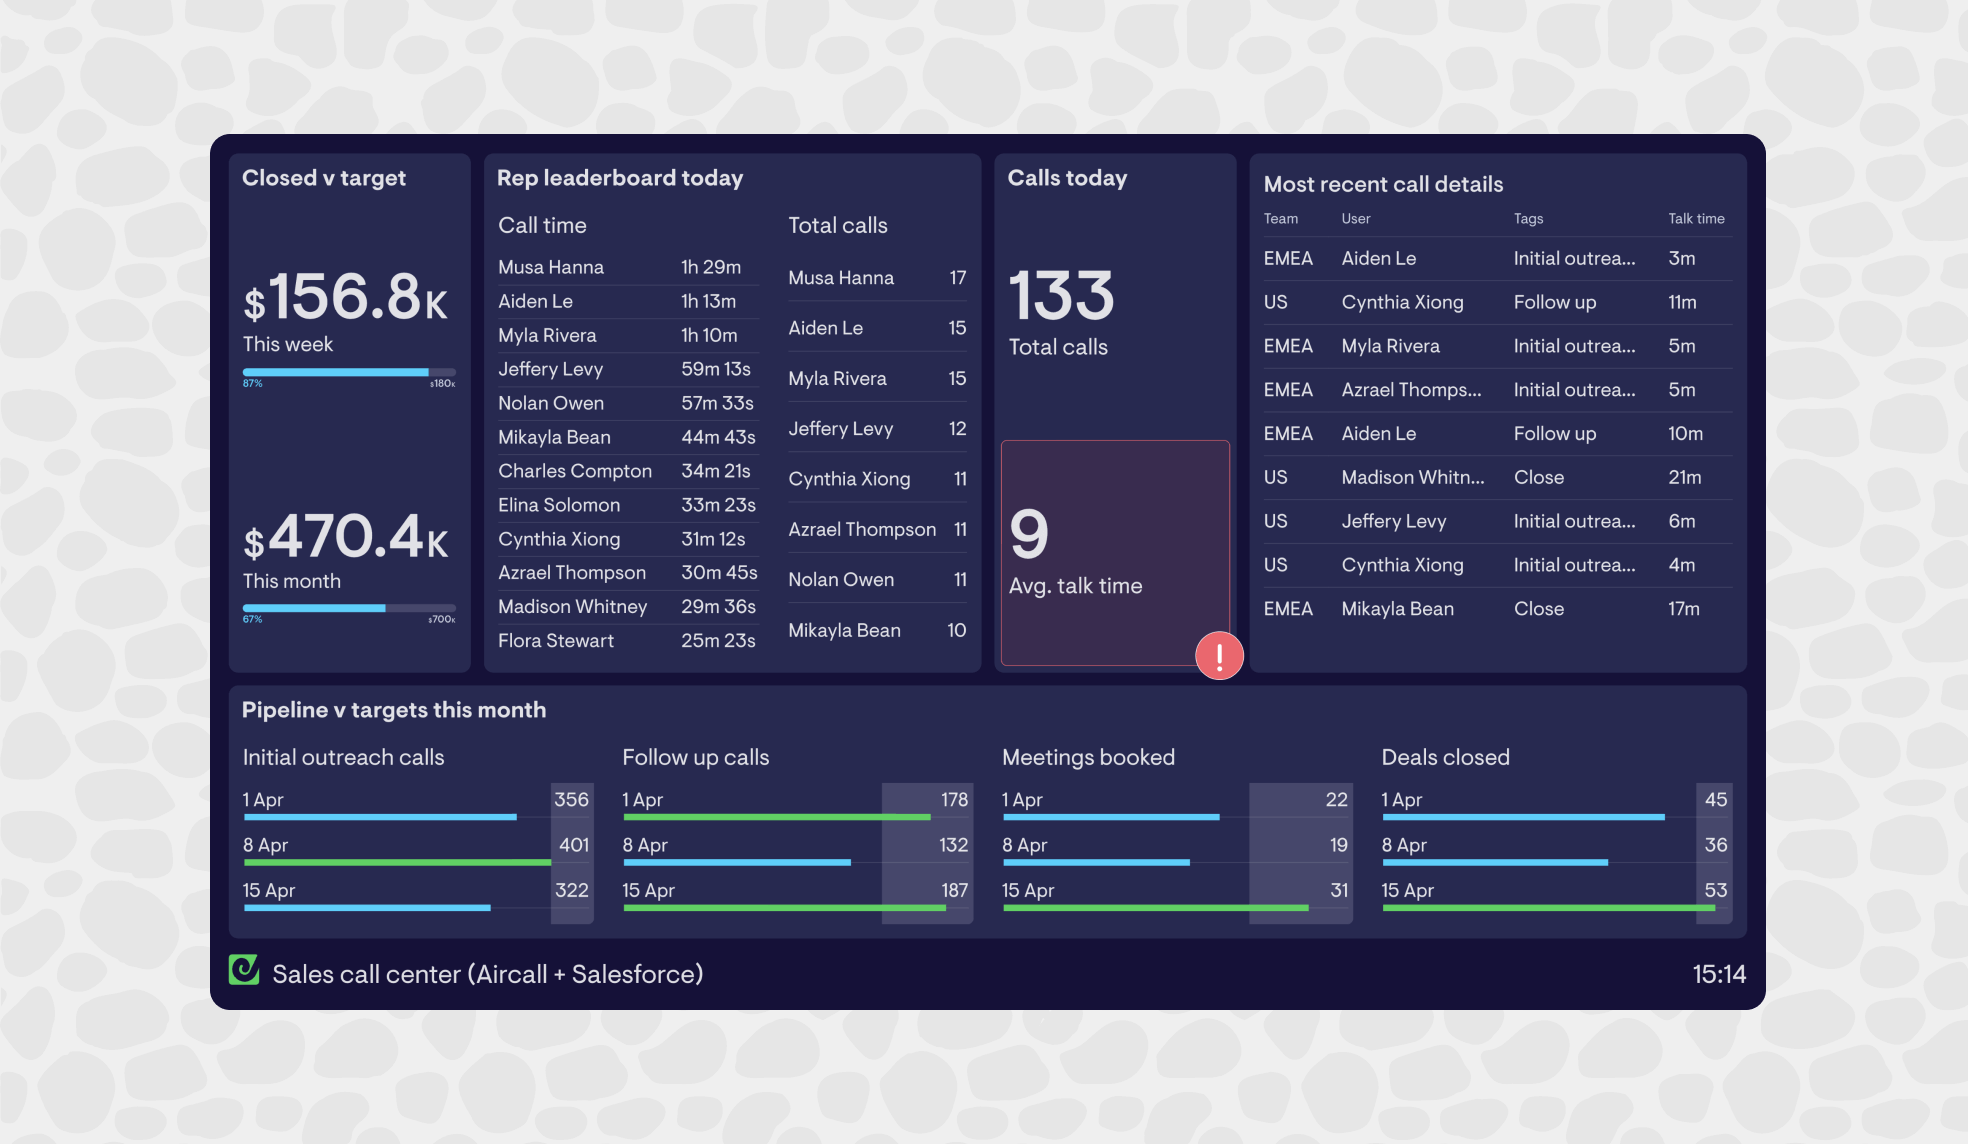
3: Using Geckoboard
For many businesses, Geckoboard offers a simple, efficient way to utilize real-time analytics in the situations that matter, without needing to invest in a specialist data setup.
Pros
Geckoboard is simple to use and set up, so it’s accessible to nearly every kind of business. You can monitor important metrics in real-time, set up notifications when they change, and use Interactive View to drill into your metrics when you need to understand why they’ve changed.
Cons
The main downside to Geckoboard is that it’s not a BI tool, like Tableau. Although you can display data from multiple sources side by side, you can’t run advanced computations like you can with a BI tool. Think of it more as a real-time monitoring tool.
The data refresh rate varies depending on the data source. Some integrations like Aircall update live, whereas some, such as Zendesk Support refresh every 10 minutes (which is still faster than Zendesk Explore). However, unlike some other dashboard tools, Geckoboard does not throttle refresh rates – that means the fastest possible refresh rates are available on all pricing tiers.
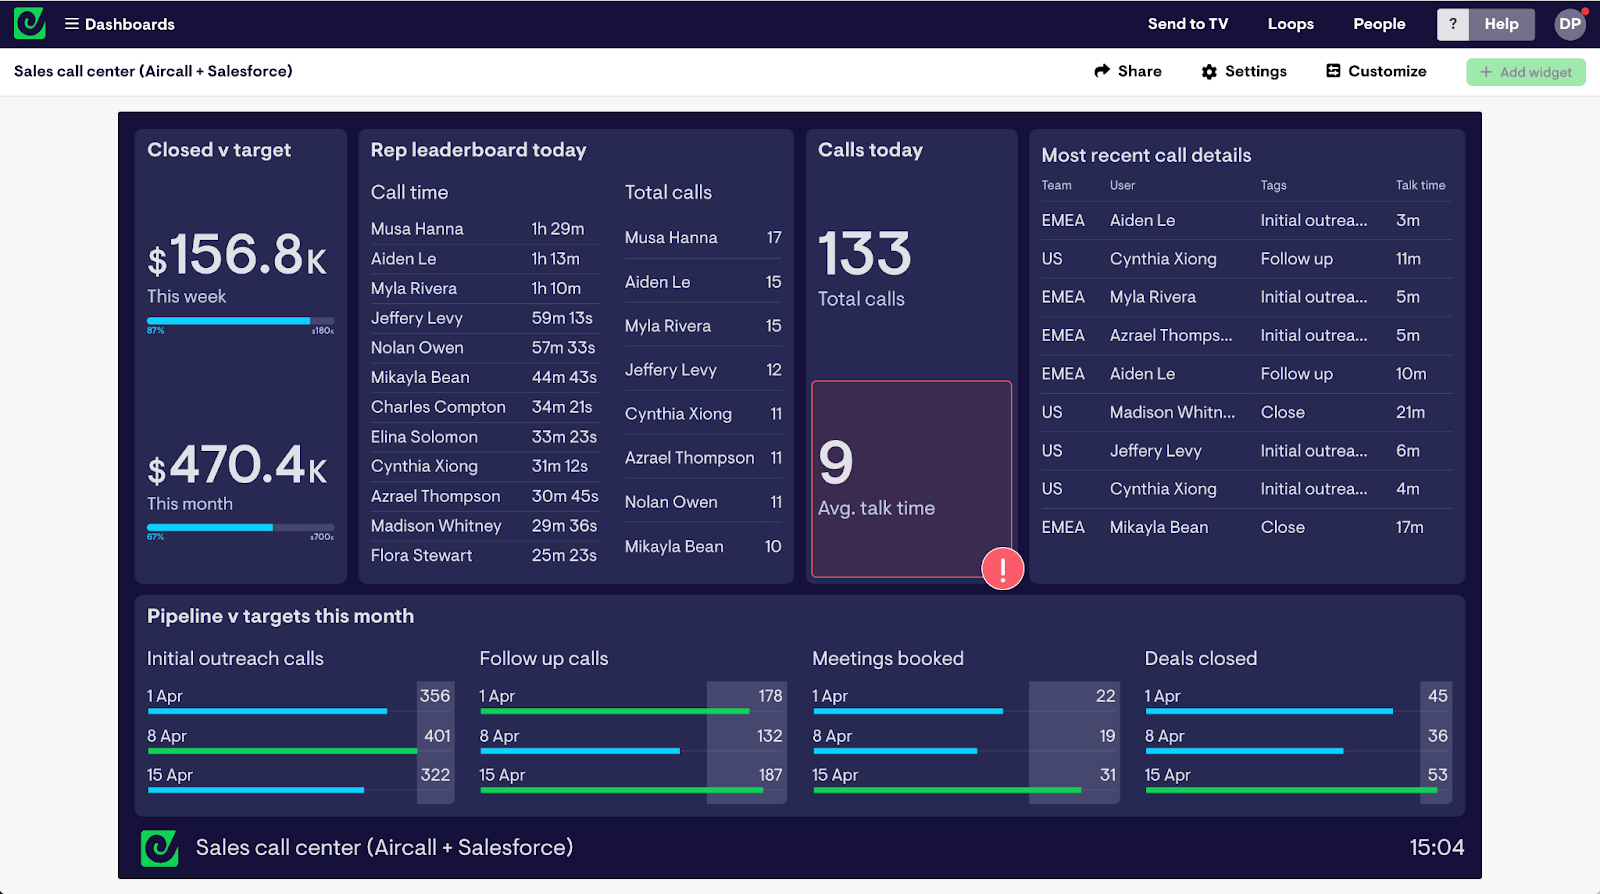
How does it work?
Connect Geckoboard to one or more of 90+ data sources, including Zendesk, Shopify, Aircall and Pipedrive. In a few minutes, you can set up a real-time dashboard you can use to monitor important metrics.
What if I need to investigate a metric that has changed?
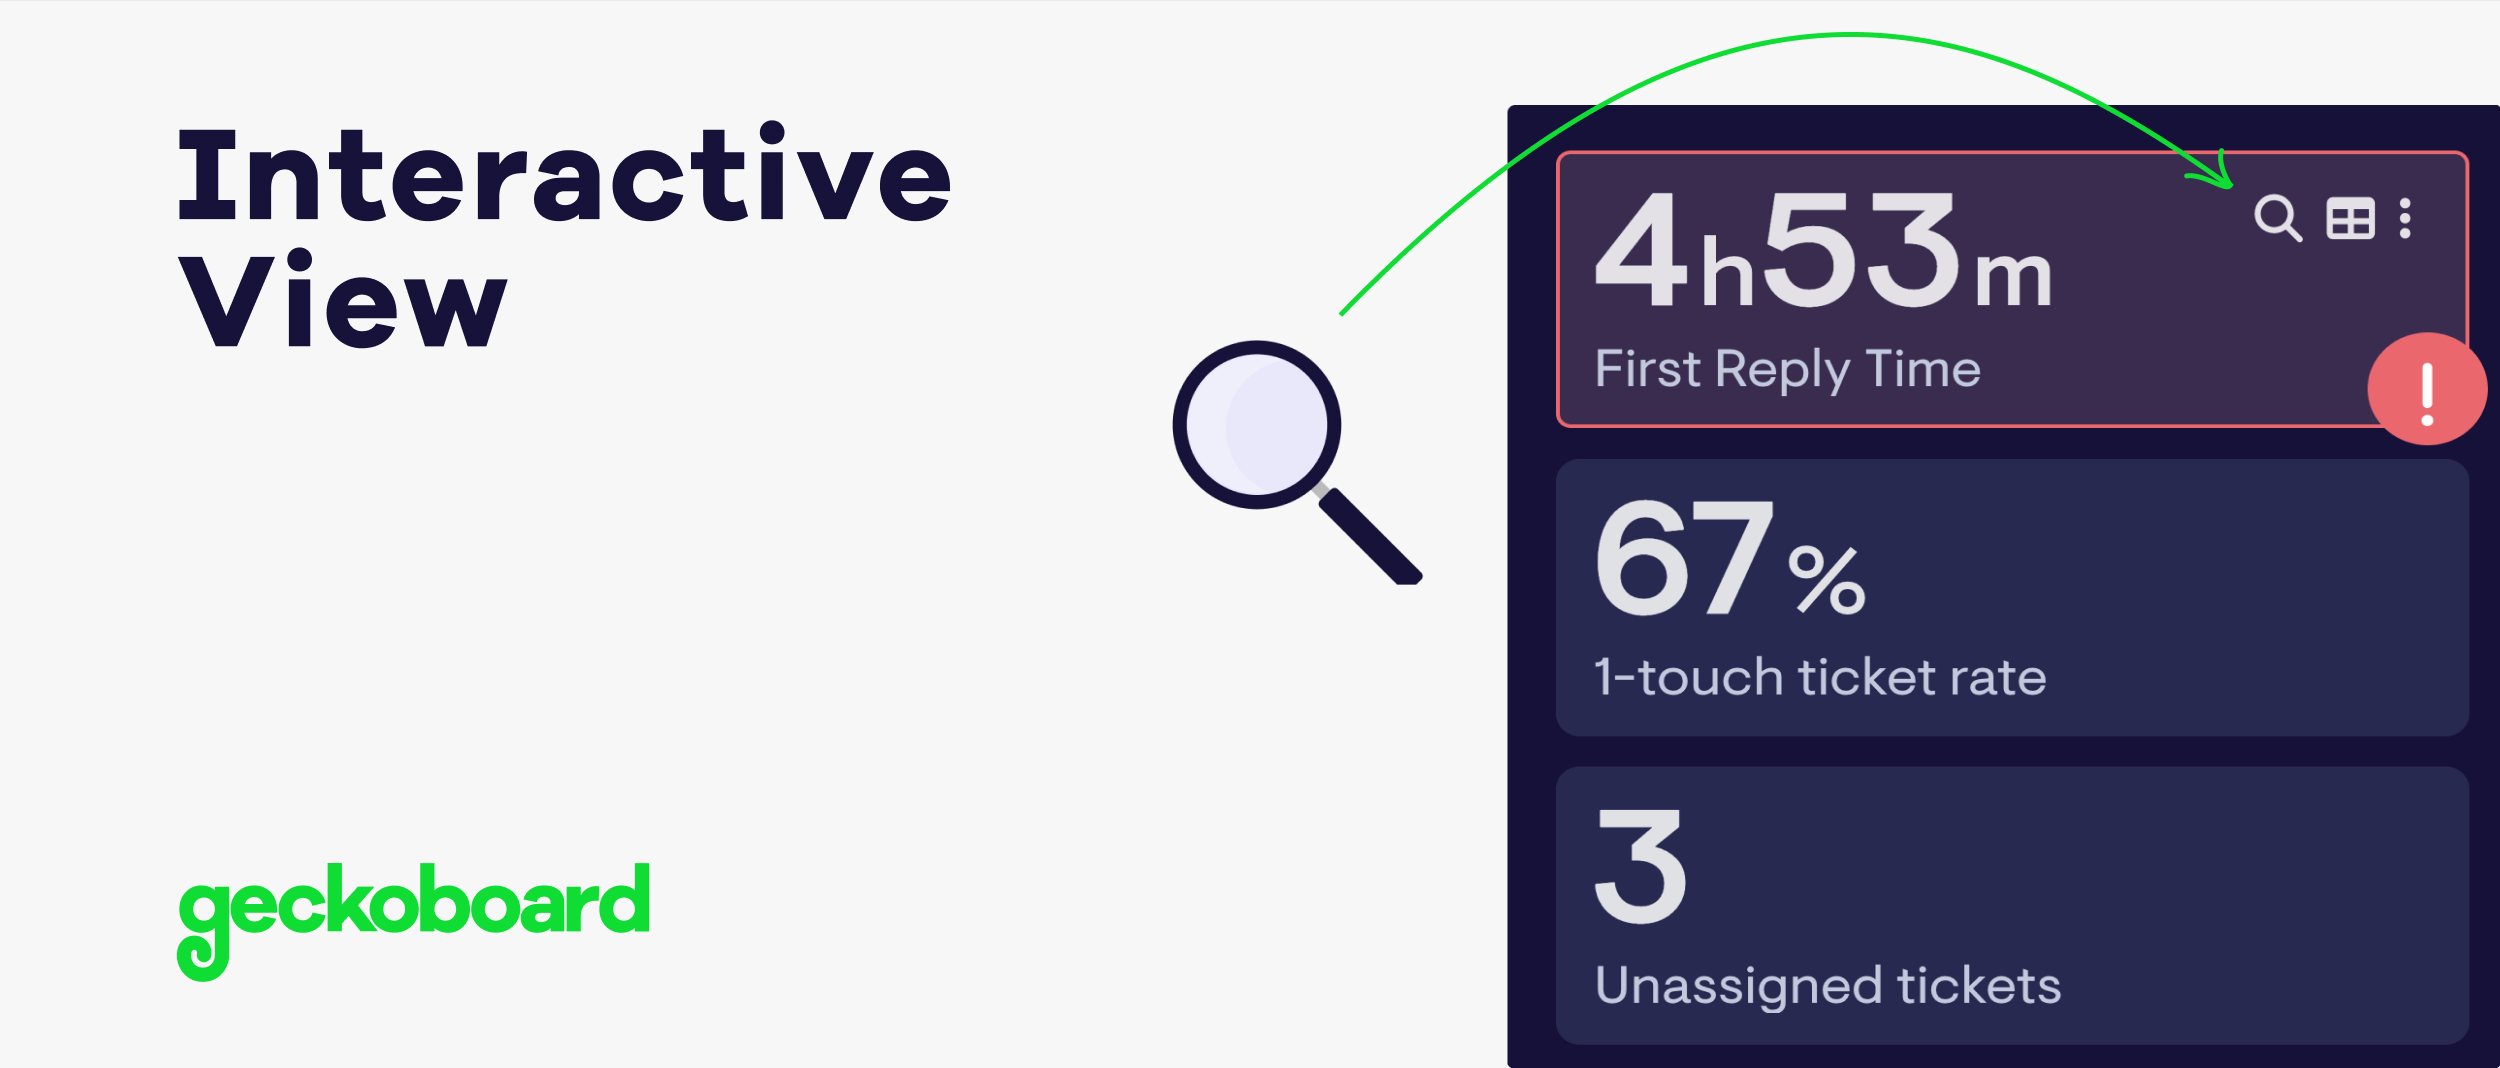
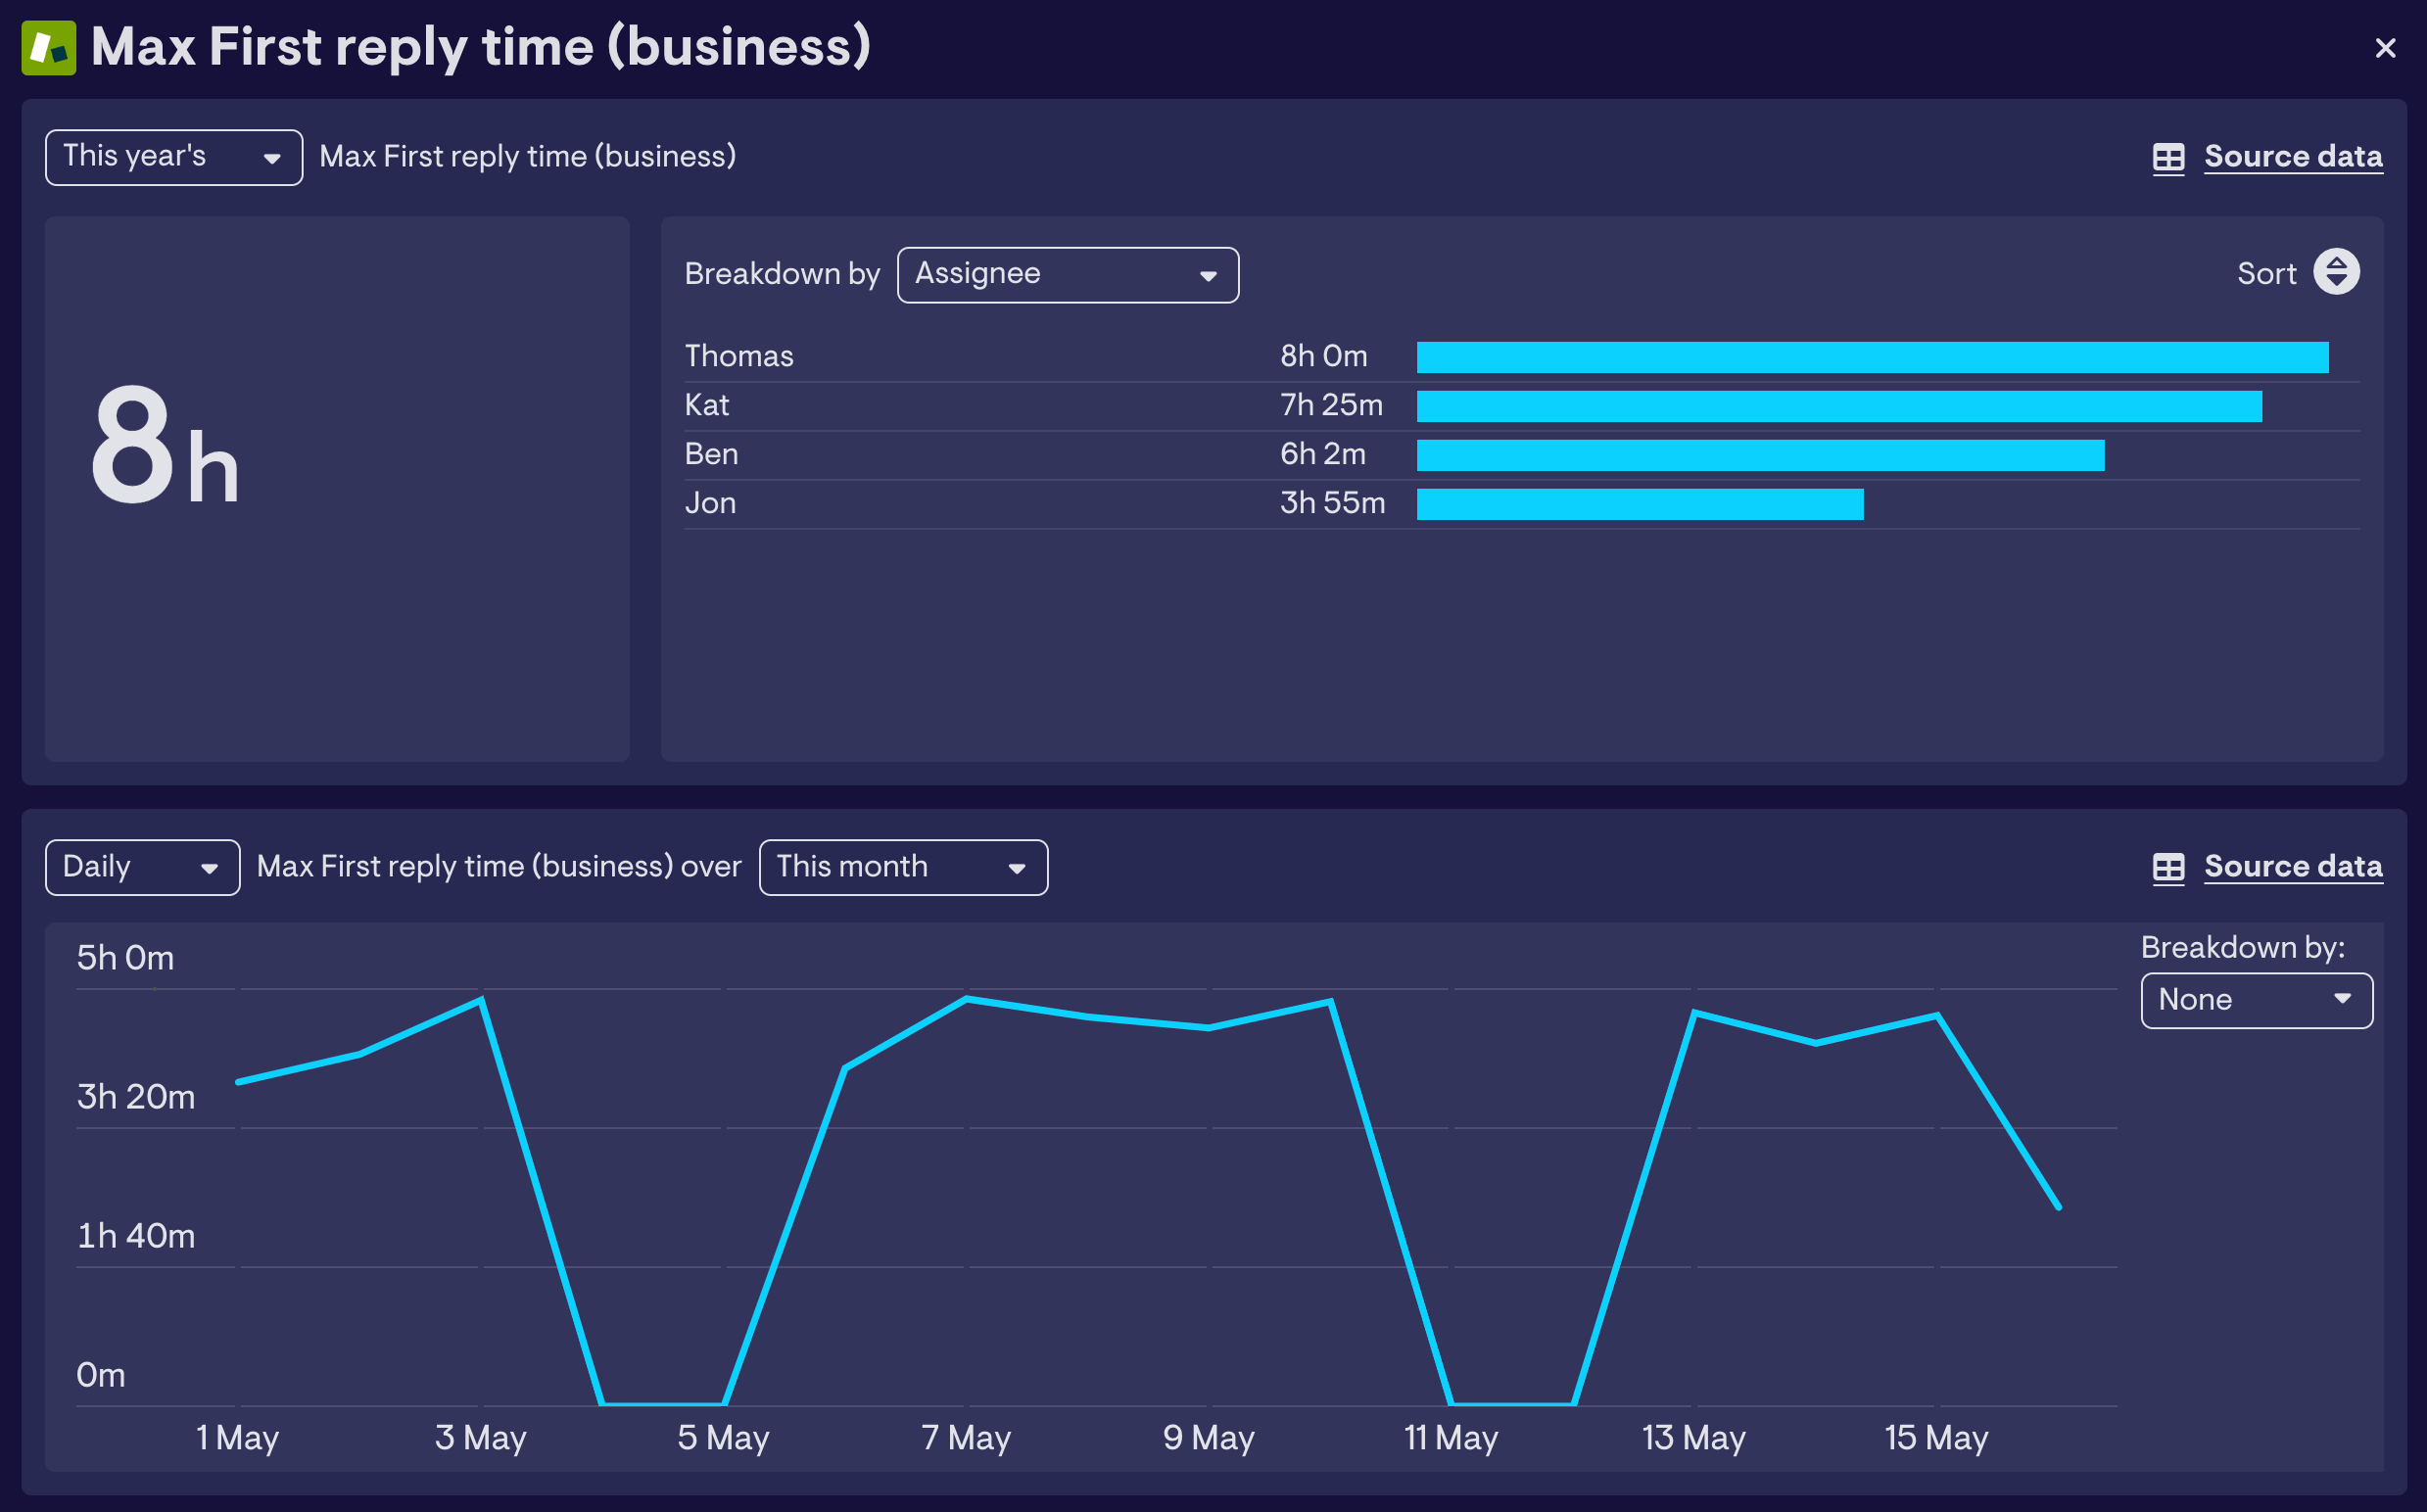
This is where Geckoboard can really save you time. Geckoboard’s newest feature, Interactive View, allows you to drill down into a metric to investigate the underlying numbers and trends.
Say, for example, you are a Customer Support manager monitoring First Response Time, and you notice it’s been increasing, you can drill down into the metric and break it down by assignee, ticket type or channel, to understand why.
Conclusion
Don't be drawn into thinking real-time analytics isn't for you. If you're an SME or a businesses without data specialists, you can still make use of real-time analytics. For many businesses, there are simpler options available to access the insights and KPIs you need to see.
