Continuing our series of Geckoboard customer interviews focused on KPIs, goal setting frameworks and dashboards, we speak to Sandeep Jindal, Head of Customer Support at Furlenco.
In this post we cover how India’s largest online furniture rental company uses Geckoboard dashboards to monitor their most important Customer Support metrics, what they did to increase CSAT from 75% to 85%, how they’ve been impacted by Covid and much more.
Tell us about yourself and Furlenco
I’m Sandeep Jindal and I head up Customer Support at Furlenco. Furlenco is India's largest online furniture rental platform. We provide award winning furniture and home decor on rent. Our products are tailored to the urban Indian, allowing them to live better at home. We offer our services in Bengaluru (also headquartered here), Mumbai, Pune, Hyderabad, Chennai and Delhi-NCR.
I’ve been at Furlenco for over two years now and introducing Geckoboard was one of the first things I did. The Customer Support team now has around 40 members, and the whole team relies on Geckoboard to keep us on track. We’re very happy customers!
What prompted you to build dashboards for your Customer Support team?
It started when I joined Furlenco. I’d not used Zendesk before. Everywhere I’d worked previously had their own ticketing tools. We didn't have any reports set up and I realised many of the team didn’t have a great understanding of how reports and analytics worked inside Zendesk.
Over the course of 3 to 6 months I set up reports in Zendesk which would be emailed first thing in the morning. While this was great, I still felt that in today's world having a real-time view was critical. As the head of department I wanted to have absolute clarity over the current situation.
I wanted to know how we are doing right now. Are calls or emails backing up? Why are customers contacting us today? Do any teams or agents have difficulties? I couldn’t get this from Zendesk because the data was updated once every 24 hours, it wasn't real time.
With Customer Experience I believe if you just can just ensure that every single day is a great day you will eventually have a great week, and a great month.
I wanted a view so that I could ensure we were on top of today. I found Geckoboard in the Zendesk marketplace. I took the trial and I was hugely impressed by how quick it was to set up. In a span of three to five days I had the dashboard fully set up exactly how I wanted.
What dashboards have you created?
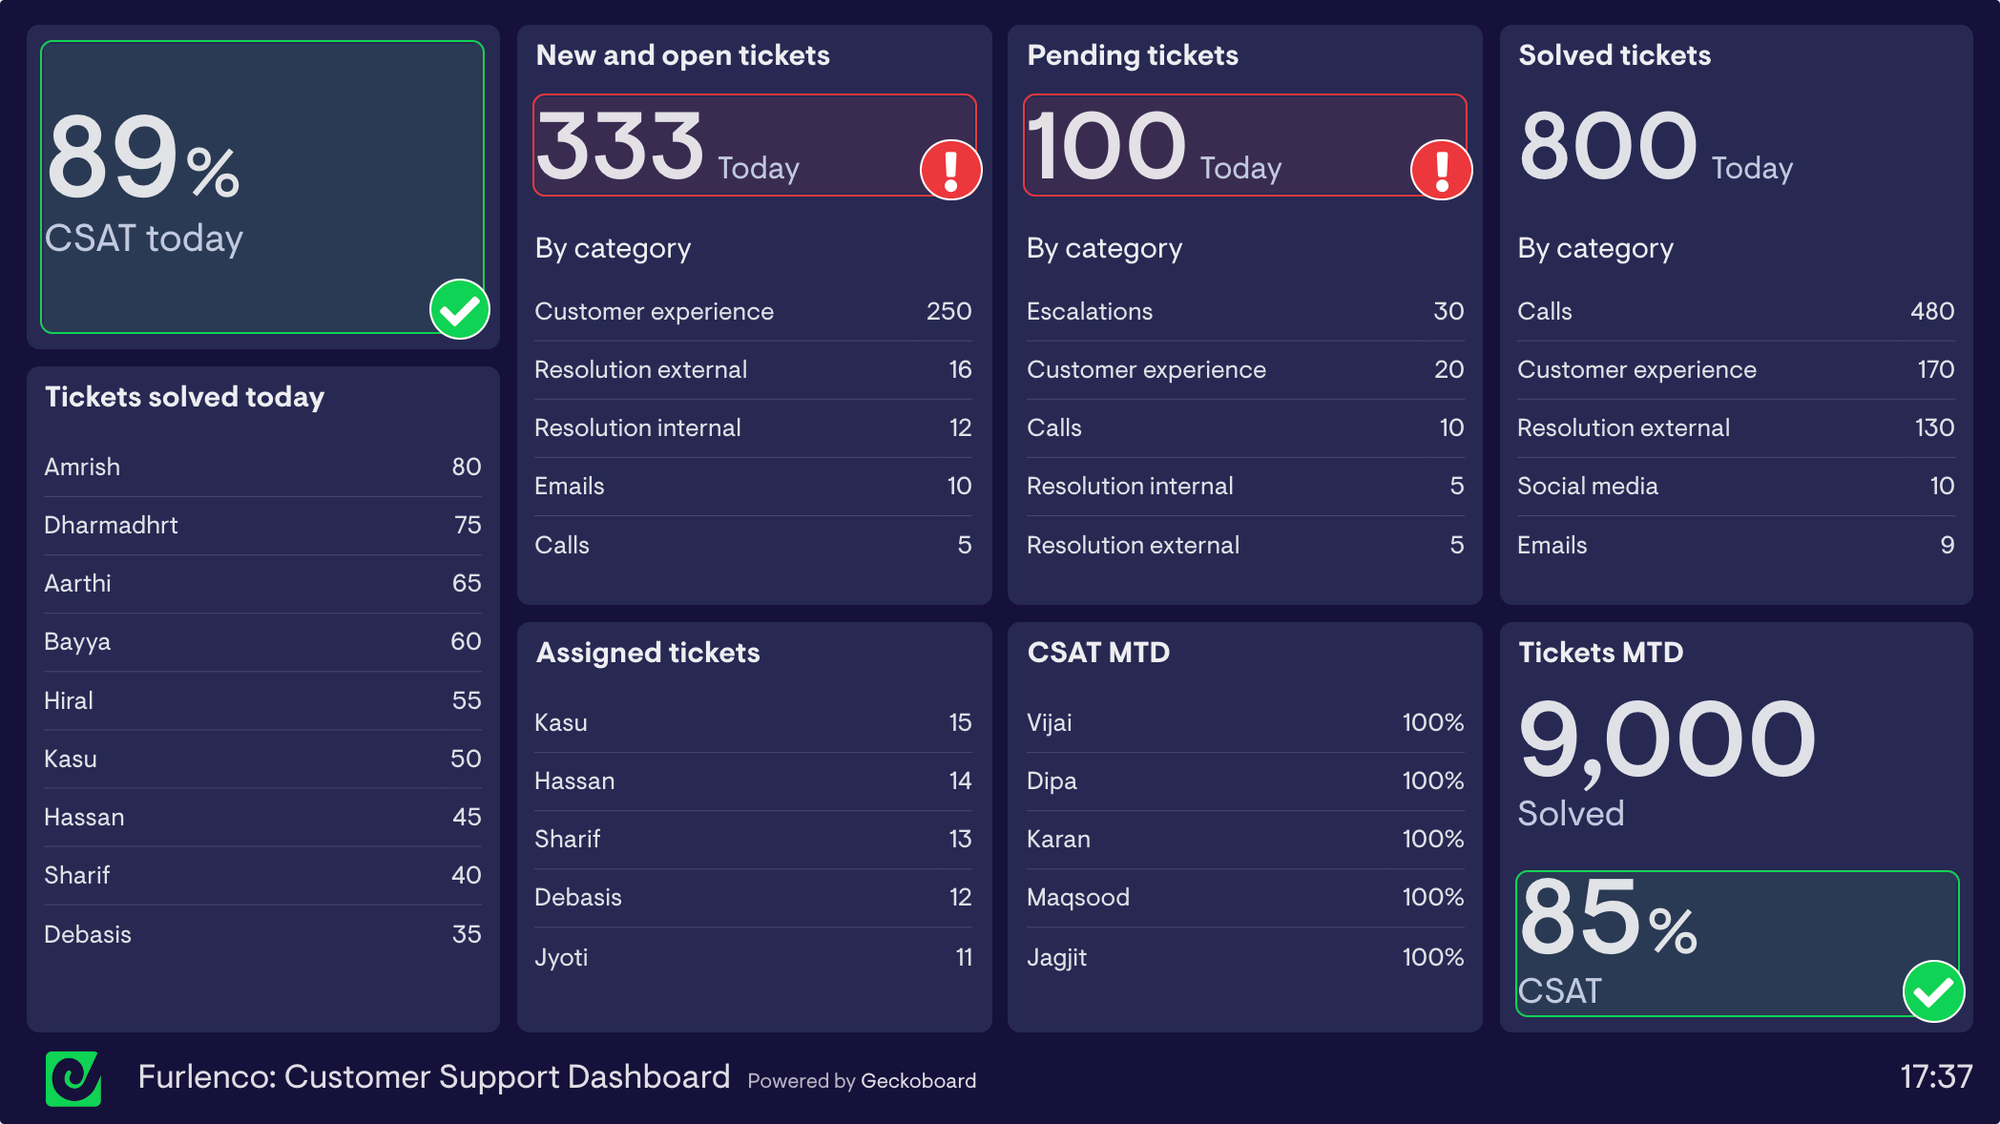
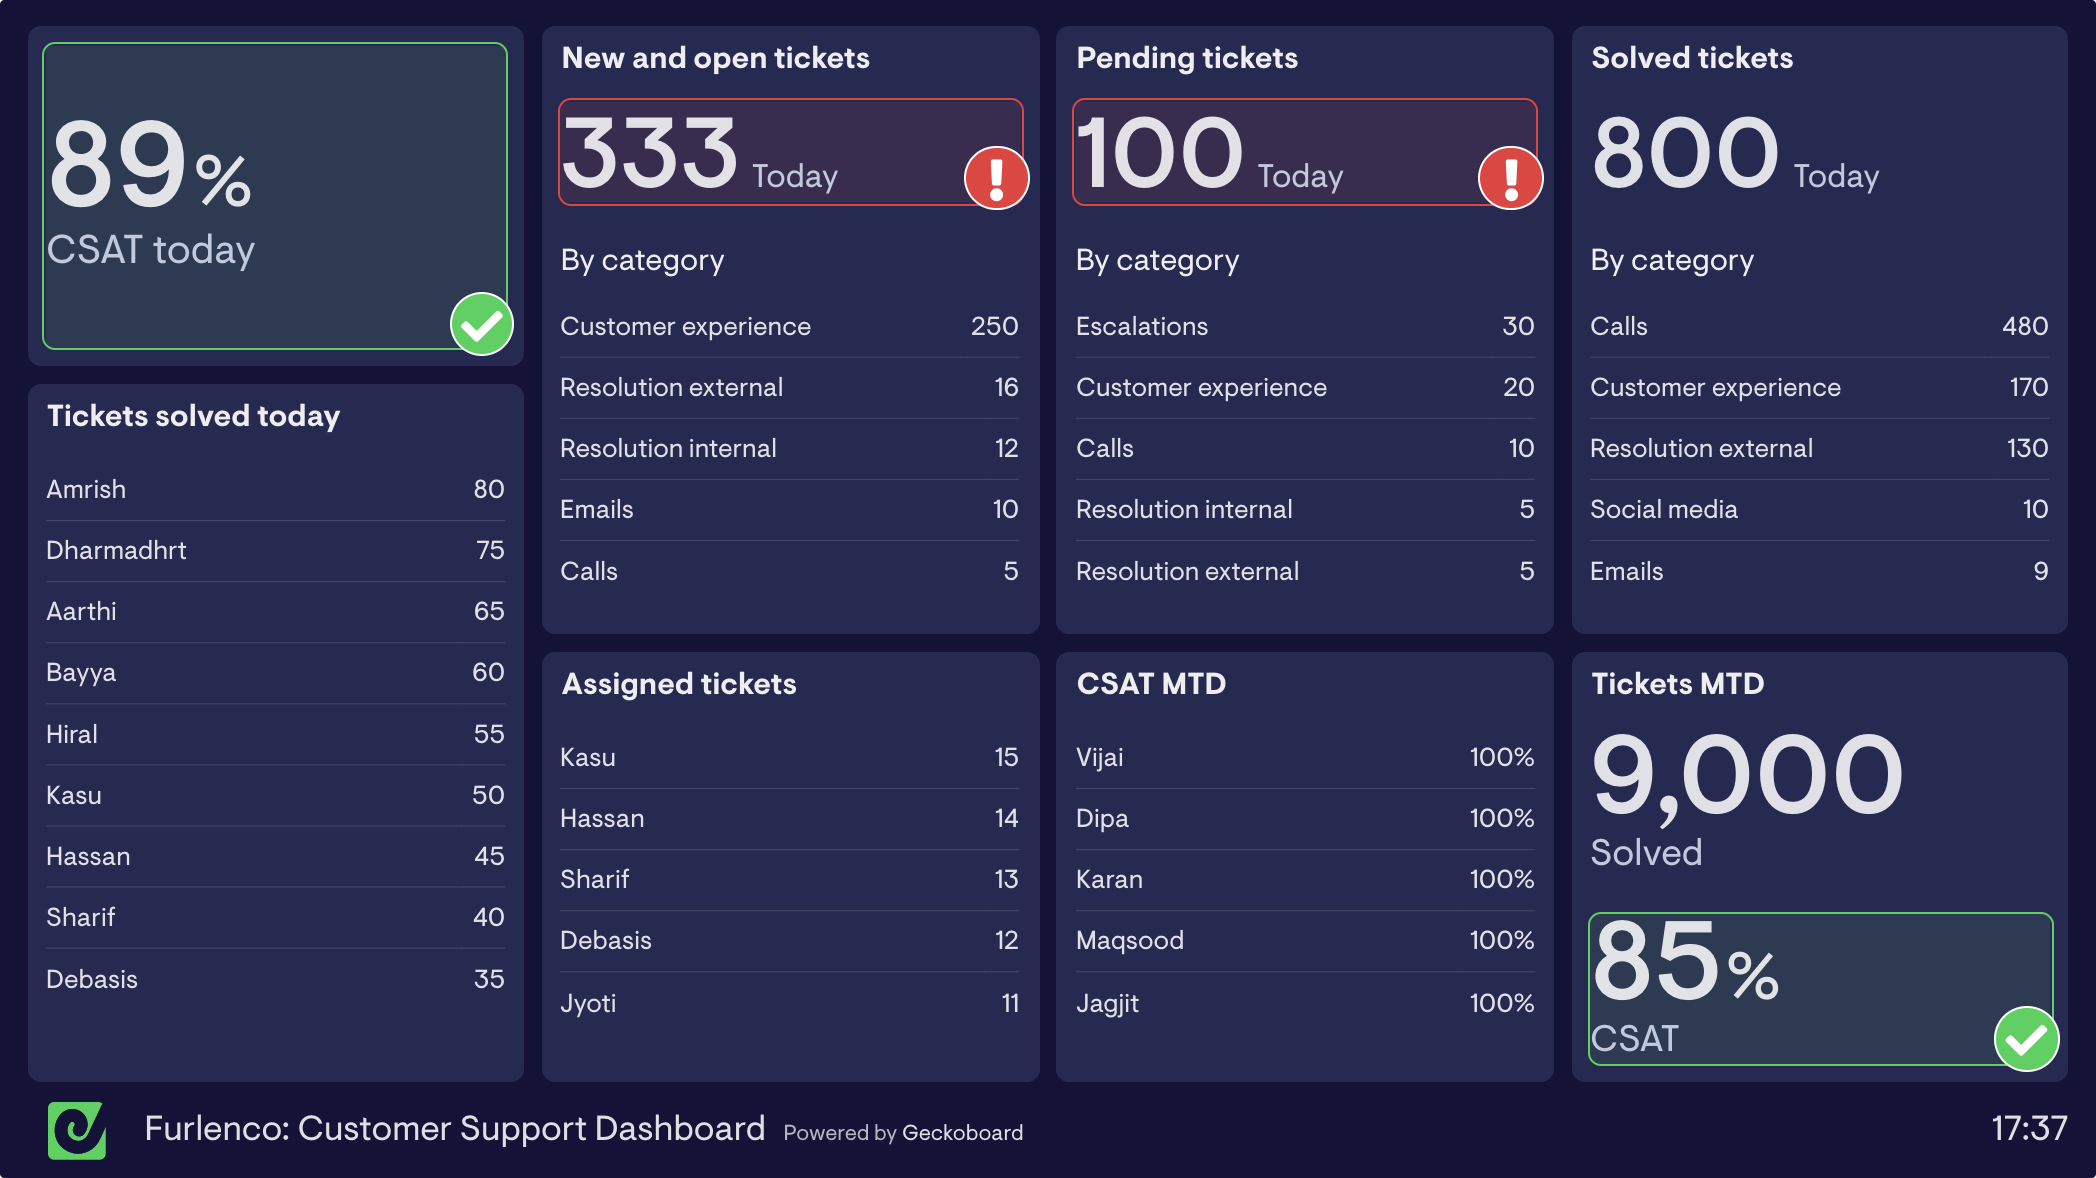
We have two main dashboards. The first dashboard I created is a real-time view of what’s going on right now and contains information about tickets today. This dashboard is primarily for us in the Customer Support team and helps us spot problems as they happen. It’s evolved over time as we’ve added more KPIs and discovered more things we want to track.
Later we added a second dashboard that shows trends week-on-week. This tells us if ticket volumes are increasing, if the backlog is building up and we can see if we are becoming more efficient. We use this dashboard to give other teams an overview of what’s going on in our department, it’s been great for increasing visibility on what our team achieves within the organization.
Who looks at your dashboards and when?
I have Geckoboard permanently open in a browser tab on my laptop, I look at it several times throughout the day to see if I need to jump in and take action. In fact, now I hardly look into the tickets in Zendesk at all.
I just glance at the live dashboard and I’m more or less sorted.
The managers in my team use Geckoboard in a similar way, it enables them to see how their agents are doing.
We also have our dashboards up on two TVs in the office. It really helps us spot issues before they explode. Before Geckoboard there was no same-day visibility around agent productivity, it’s been good to speed up the process of fixing issues and to be more proactive.
I’ve been trying to bring a culture of transparency to the team and Geckoboard really helps with that. It’s really important that everyone can see what’s happening. We use the sharing links so that everyone in the team has access. I’ve also embedded the dashboard on our intranet. We use the intranet extensively, so putting it there ensures it gets seen.
Where does the data on your dashboards come from?
The data on our dashboards all comes from Zendesk and Google Sheets. That’s another thing we like about Geckoboard, it’s really useful to have all the data in one place.
The Spreadsheet integration allows us to include scheduling information on our dashboards. We have a scheduling team for organizing furniture delivery and pickup where all the information goes into a Google Sheet. Unlike someone like Amazon our deliveries often involve a whole truck going to a single customer because we’re furnishing a whole house. Scheduling issues e.g. a failed delivery, are one of the main causes of customer tickets so having visibility of issues is essential for understanding the current situation.
Give your support team a boost
With Geckoboard’s real-time dashboards, everyone knows exactly what’s happening in CS right now.
Find out more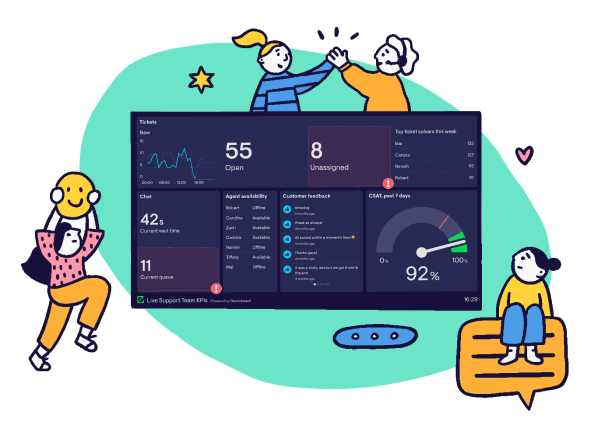
Do you have an example of an issue you might spot on your dashboard and how would you handle that?
Our Customer Satisfaction Score (CSAT) is usually 85% or above. So if I see that at somewhere around 60% to 65% for the day that’s an immediate red flag. We have Geckoboard’s status indicators set up to highlight our CSAT number as red on the dashboard in that situation.
Highlighting this allows me to immediately have a quick word with the managers to make sure they’re aware of the problem and to see if they might know the cause. We’ve got a real-time trigger in Zendesk that alerts the managers anytime an agent gets bad feedback. We can then dive in to understand if there was anything we could have done better and also make sure managers are aware of any issues upfront. We have about 10 different Customer Support metrics that we look at like this.
What’s your most important metric?
CSAT is the metric we care most about. It’s much more important than just resolving tickets.
CSAT is our first priority and is how we ensure that we’re delivering better and better experiences. Customers have very high expectations now and as a company providing excellent customer experience is a core part of our brand.
However, you can’t just focus on CSAT. At one stage we found no matter how hard we tried we just couldn’t get our CSAT score above 75%. I did an in depth investigation into what the main reasons were for the 25% of negative scores. It turned out that a large number were triggered by appliances like refrigerators or washing machines stopping working. We used to take around 5-7 days to provide a replacement. But if your refrigerator stops working that’s not good enough. These are essential items to our customers. Off the back of this we set up an after sales service and within 30 days CSAT jumped from 75% to 80%.
What other metrics do you care about?
Most of the other metrics we care about feed directly into CSAT. We track a number of call metrics including: abandon time, abandon percentage, speed of answer, repeat call rate (number of repeat calls one customer makes), average no. calls to full resolution. For tickets we’re looking at first response time and full resolution time. We also look at one touch resolution rate because multiple touches often leads to a poor customer experience. Generally we maintain a one touch resolution rate of 94-95%.
We also like to keep a close eye on how many complaints we receive on social media and the ratio of positive posts shared. We categorize social posts as either ‘testimonial’, ‘complaint’ or ‘general request’, by tagging these as they come through into Zendesk.
We have not been measuring Net Promoter Score (NPS) of late, but are planning on starting to track that again, as it’s another measure of how satisfied customers are.
How do you set goals at Furlenco?
When it comes to goal setting as a function we look at two main areas. First is efficiency. We are always looking to become more efficient. With this we tend to look at one of our KPIs like average handling time for a call and focus on trying to reduce that by 30 seconds.
We always try and push ourselves beyond our existing boundaries. We set targets at a team level as well as department. If we have a team with very little staff turnover we might set that team more ambitious targets for improving their metrics.
The second type of goal we set are derived from our overall business targets and these tend to be more strategic in nature. For us this is usually focused on customer experience as measured by CSAT.
We set high level goals once a year, but in reality these may change if something unexpected happens. Within my team we review our progress and set new goals every quarter. I’ll set my managers goals and then they set individual team members. Each team member might have a different KPI that they’re focusing on to increase their skills.
There are also regular business review meetings where if we notice a particular metric is down, we’ll go on a fact finding mission to find out why. I like to use the Five Whys to find the root cause. From that we might identify some key areas that we need to work on. We might also notice that customers are facing a particular issue, for example there might be a problem with payments, and in that case we’d raise it with our tech team.
What other ways do you report on your team’s data?
Every so often I download a data dump from Zendesk and put that into Microsoft Power BI. From this I create reports for the leadership team to have visibility of our longer term performance and interesting changes in metrics. I also use Power BI when I need to explore the data and investigate patterns.
Finally, how has Covid affected your team?
Covid had a big impact on everything at Furlenco. Since the 14th March, we’ve been working from home. This was the first time most my team members had worked remotely and it definitely hit our productivity for a while.
On top of this we weren’t able to deliver new furniture or replacements for two months. Nothing was happening so this led to a huge backlog of requests. Almost all our KPIs went red on our dashboard. Before, we’d never had a backlog of more than 500 tickets at any given point in time. Even when we were answering tickets we weren’t able to fix them because we weren’t able to carry out deliveries and pickups.
As lockdown has been relaxed, things are coming back to normal and in another few days I’m expecting most of our metrics to be back to normal. Our dashboards have been a huge help to my team who had never been fully remote before, they allowed us to adapt and get on top of the backlog of work that Covid caused. I rely on Geckoboard literally every single day.
Want to build a Customer Support dashboard like Furlenco? Give Geckoboard a go with a 14 day free trial (no credit card required).
