Felix Starzer, Head of Customer Care at Staffbase tells us how he uses dashboards to motivate and inspire his team to provide the best customer service going. The team endeavour to go above and beyond and as a result, always exceed their CSAT goal.
Please introduce yourself and your team
I’m Felix Starzer, Head of Customer at Staffbase and a passionate customer experience driver.
Staffbase is a global market leader in mobile-first employee communication platforms for enterprise companies such as employee apps or intranets. We work with more than 400 companies all over the world such as Adidas, DHL or Audi.
I joined as a technical consultant and after working with Zendesk for some time, I moved into leading support. Our Customer Care team is now 24 employees across Germany and the US, providing support in both German and English. The team is split into three functions; customer care agents who focus on first and second level support, the tech team who works on integrations and customisations, and finally, the customer onboarding team.
What made you switch from tech to support?
I started working with the Customer Care team a few years ago when there were roughly 30 people in the whole company (we’re now at around 320 Staffpranos after three years - quite some growth). I really liked my technical role in Customer Care, I built a lot of automations, triggers and ways to make the workflow much smoother for everyone. As the team grew I moved into the role to lead the department. My main motivation is to make sure we deliver the highest quality service. I've had a fair share of poor service experiences personally and want to make sure our customers always have the best possible experience.
How do you balance automation with great service?
By building automated workflows it allows us to respond faster to our customers. However, we are completely against automated responses. When we do not have confirmation from the customer that an issue has been resolved we keep that ticket open and gently check in with them. Only with their confirmation we will close a ticket, otherwise we will keep it open until a full resolution has been achieved. We also call all of our customers personally when there has been an incident with one of our products.
Our goal is always going two steps further to make the customer experience the best it can be. It really helps that we have the backing of our CEO and see our efforts reflected in our net retention rate, customer satisfaction and reviews.
A lot of customer reviews mention the Staffbase support as superb which helps to keep the C-Level backing our support organization, helping us to decide and revolutionize processes and tools in a fast manner.
Why did you decide to set up a dashboard?
In the early days when we were going through huge growth, our developers had a big TV screen showing data such as incidents on our servers, and our team sat nearby. Seeing theirs, I started shopping for a tool to display Support KPIs in a really easy way. This is when I found Geckoboard. I signed up for a trial, invested in a tiny PC and got our first dashboard up on a TV within a couple of weeks. [Learn more about displaying dashboards on a big screen or TV]
Now we have Customer Care dashboards up in each of our three offices around the world displaying KPIS on screens right next to the teams. For those who are working remotely, we have dashboard sharing links in the Slack channel descriptions so everyone can always have them open. The distribution team shares their dashboard via scheduled daily snapshots in Slack.
Talk us through the dashboards you use
We have two main dashboards for our team, first is our Overview Dashboard displaying the most pressing KPIs for the frontline team. Second is our Stats Dashboard which looks at trends over time and overall numbers.
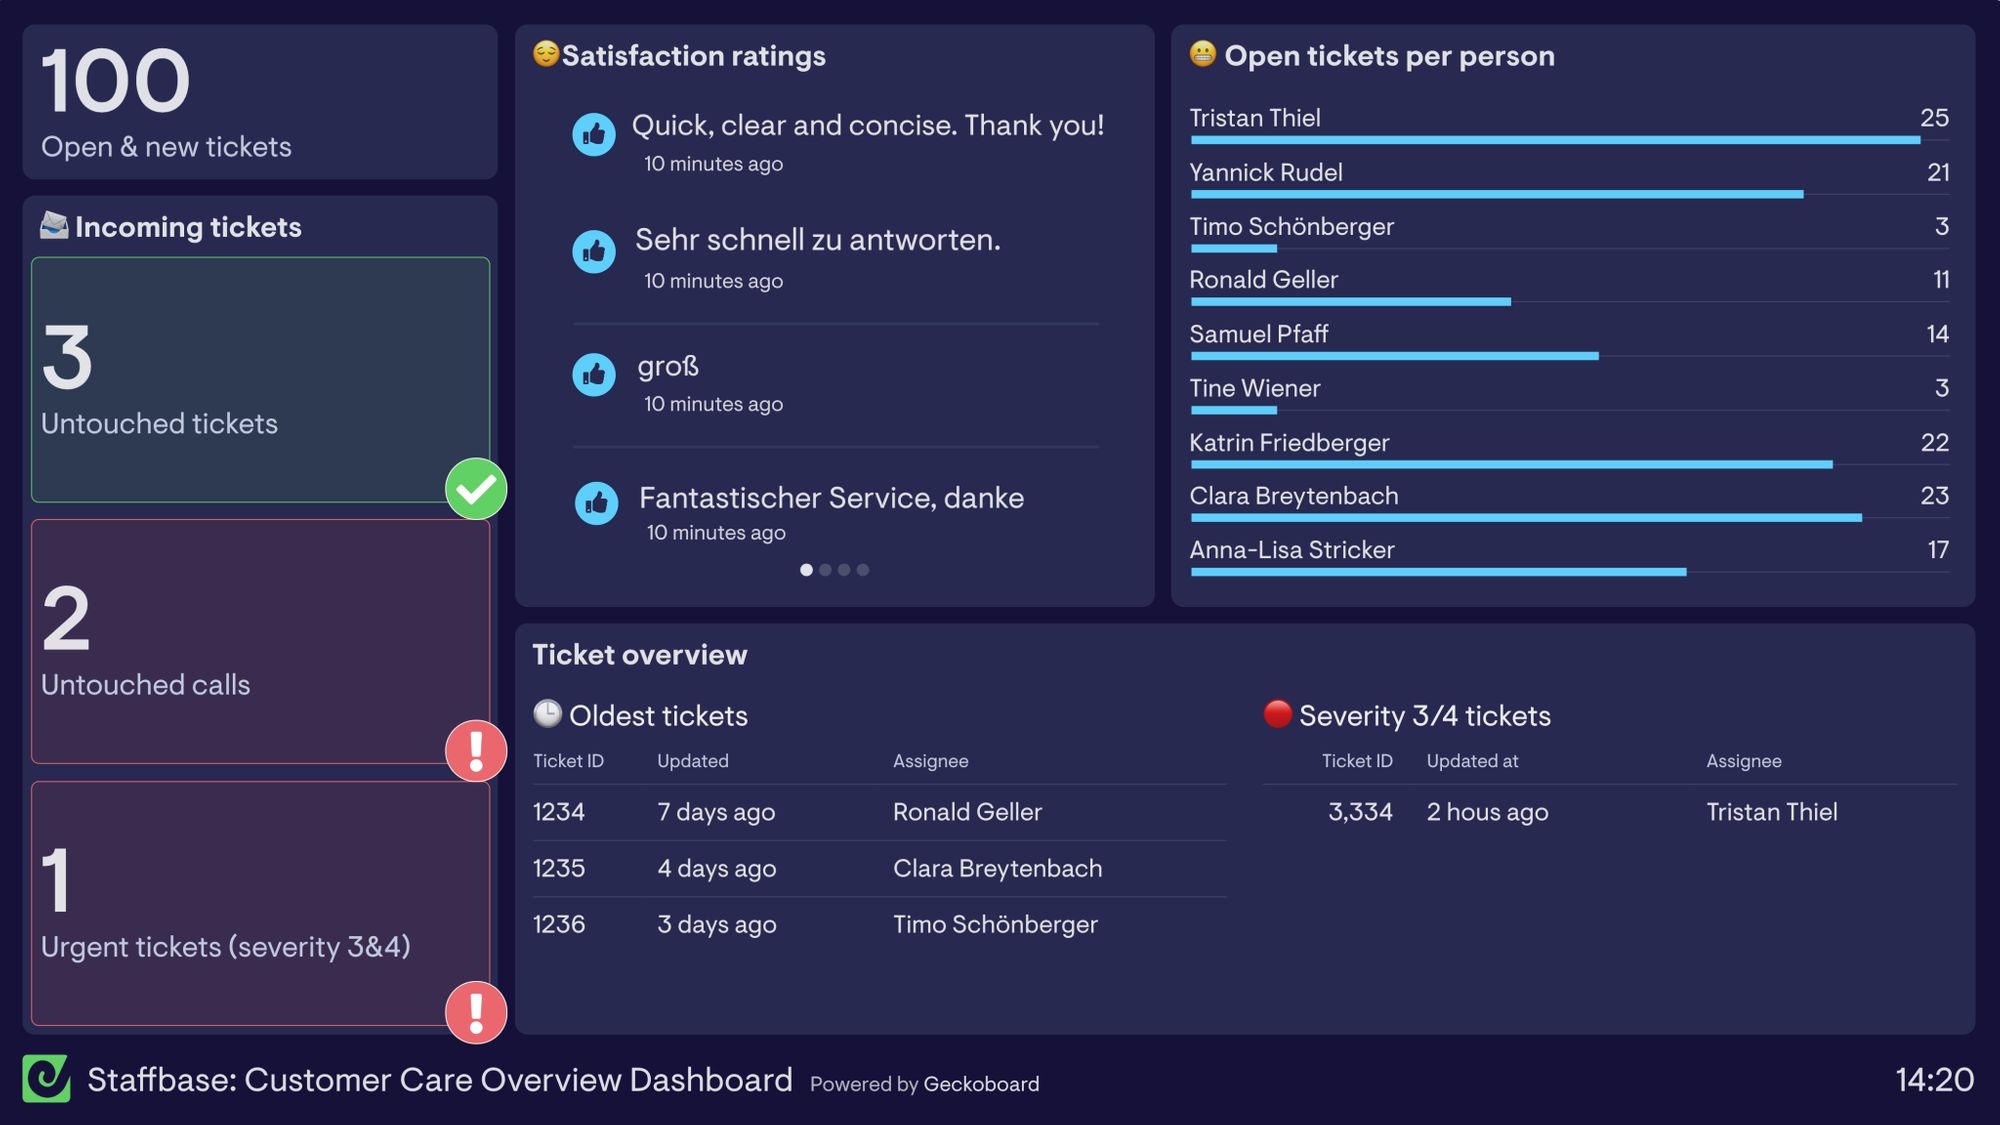
Our Overview Dashboard focuses on the KPIs our frontline team need to know when they are starting and finishing their shifts. This team works in a shift pattern to cover each customer touch point for the whole day and the dashboard allows them to stay on top of Untouched Calls, Untouched Tickets and Urgent Tickets - these are the most important KPIs on this dashboard. We run the shift system to ensure that no backlog builds up and everything is attended to within an hour.
Customer satisfaction is very important to us. We have a scheme where we donate €1 for every positive customer review we receive to a charity chosen by the team. It’s a fair for everyone and we all have something to work towards. Sharing positive ratings agents receive makes sure they get the praise they deserve.
Open Tickets per person is highlighted on our dashboard to ensure that the workload is fairly distributed. Lastly, we show the oldest Open Tickets so that we can make sure nothing is hanging around for more than two weeks and also call out any particularly urgent tickets. The team leads will check in on the older tickets after they’ve been open more than two weeks to check it hasn’t fallen through the cracks and is being worked on.
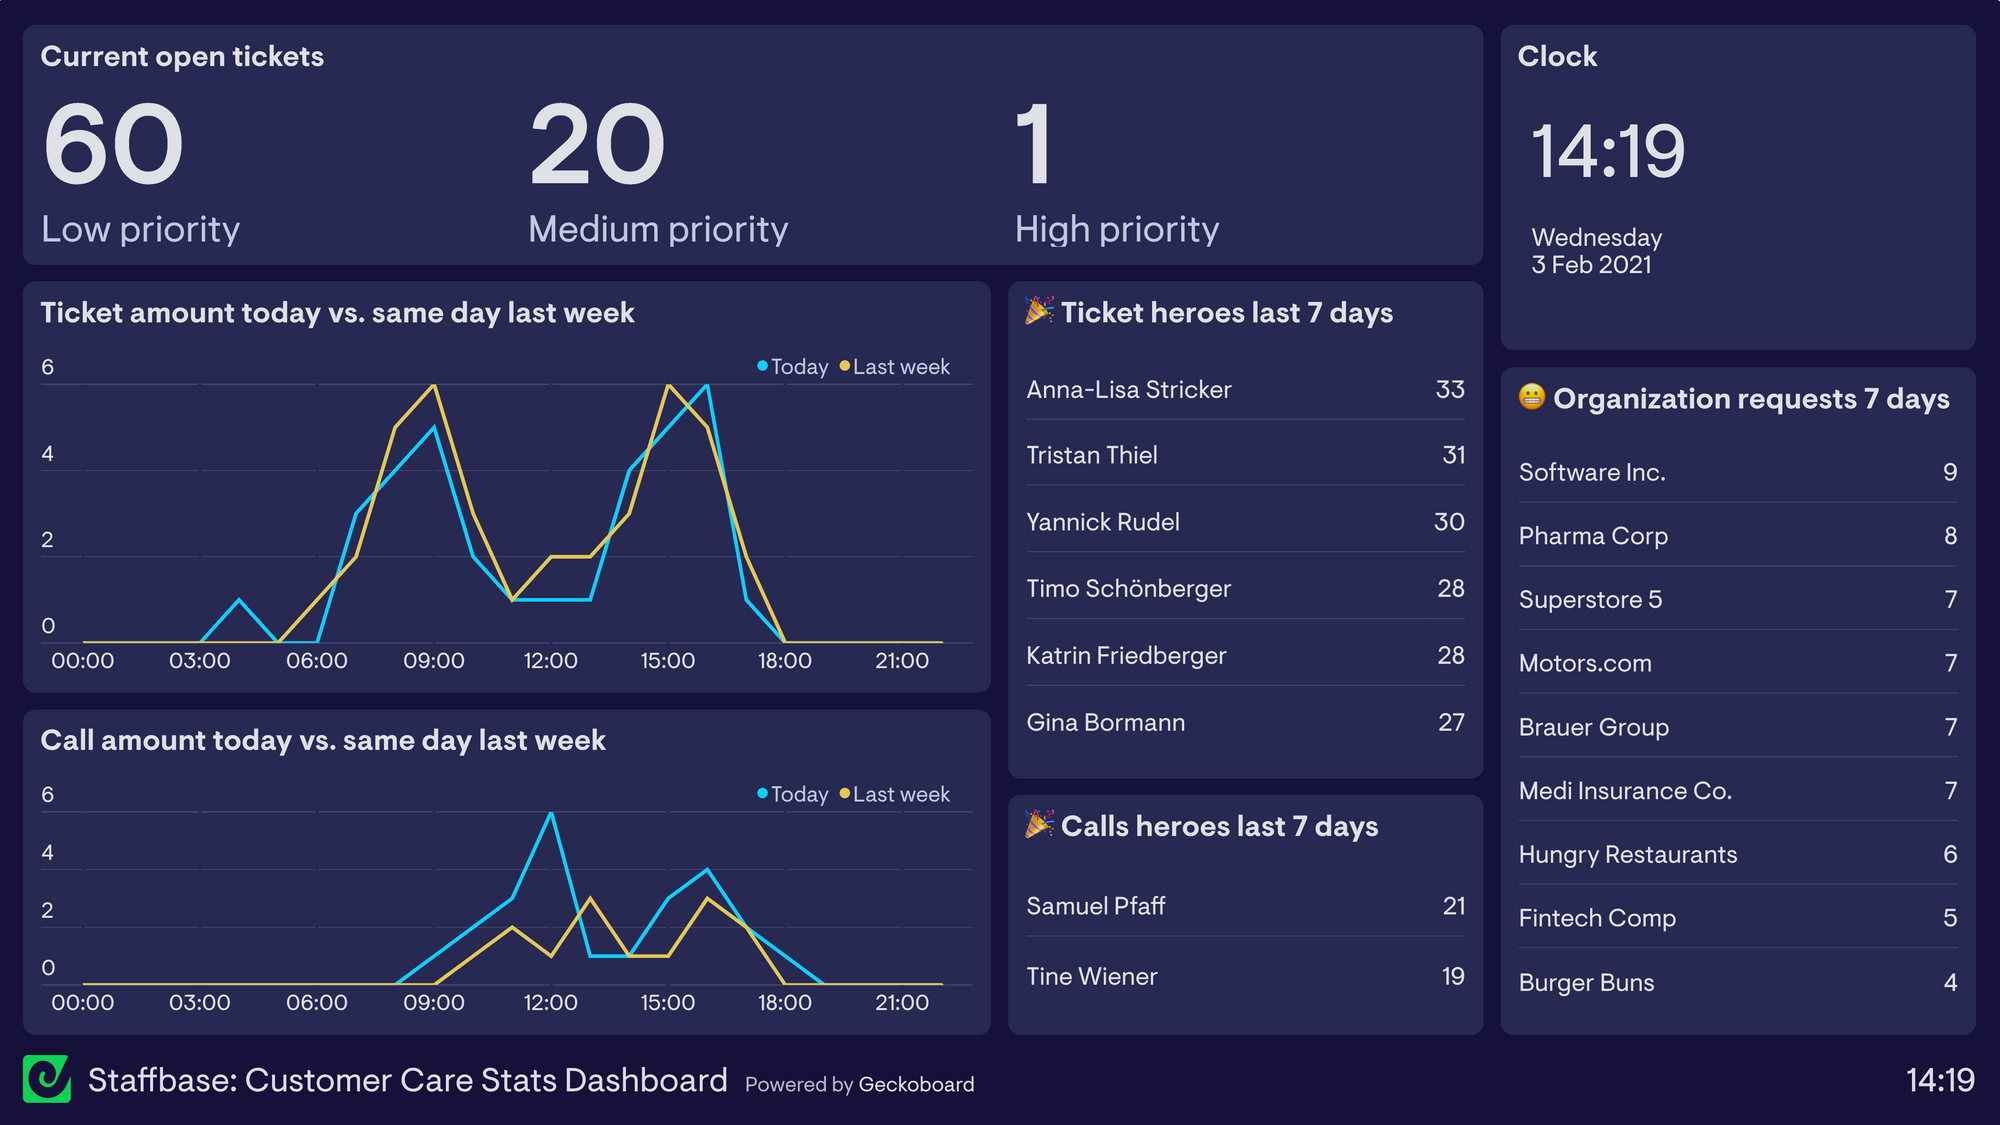
Our second dashboard, the Stats Dashboard displays a general overview of tickets, includes praise for the agents, looks at trends over the past week, and identifies customers who have needed extra support. It is on a loop with our overview dashboard so the TV screen cycles between these dashboards for the team to see everything in one place.
The ticket overview gives me the chance to see at a glance if we have a high load of work at the moment. We break down praise into tickets and calls as these are two different skill sets and someone who is often on the phone may not be solving the same number of tickets as another focused primarily on tickets. We have no KPIs around the number of tickets or calls that need to be taken/solved within a day. We know that these vary based on the customer request and it would just add pressure to the agents to attach goals to something so varied, in the end causing the customer satisfaction to potentially drop, which we want to avoid.
Our Organization Requests comes from customers who have reached out to the Support team most often. This list highlights any customers requesting information, the list is useful to help identify if we need to provide anyone with additional training.
Our distribution team also has their own dashboard which covers app related data, feeding information from an API into a spreadsheet (so that they can adapt the data) and then from the spreadsheet into Geckoboard.
Why haven’t you included CSAT on your dashboard?
Although Customer Satisfaction Score (CSAT) is our most important metric, it doesn’t appear on either of our dashboards because we consistently exceed our CSAT goal of 97%. If we had a drop in our performance then we would likely add it to one of the dashboards to help inspire the team to get the score back to where it should be. But for now, I share CSAT in our monthly stakeholder newsletter and have a KPI channel within our own app where agents can review our CSAT for the past 12 months alongside more in-depth data.
How have your dashboards changed over time?
Our first version of the dashboard was very simple. It included just a few key KPIs such as First Response Time (FRT), Tickets (created, untouched, solved), CSAT, Full Resolution Time, Top Ticket Solvers, and recent feedback. We were focused on First Reply Time and the number of tickets we had to solve.
We’ve since professionalised our KPIs. We have more appropriate visualizations and have dropped KPIs which were just being tracked but with no real purpose from the dashboards so that the team is focused on the most important metrics. Now we have two dashboards instead of one to display KPIs and further information.
If you were to describe Geckoboard to a peer what would you say?
A straightforward, easy to use tool for displaying support metrics.
I actually had a conversation like this when members of our development team asked me about our dashboards. They wanted to know how they were set up and were amazed when I showed them how simple it was. They were expecting code running in the background but seeing how you can select a data source and build something with a few clicks blew them away.
Any final comments?
Empathy wins. That's how Customer Care rolls and how we overcame being a supplier of Support towards being a loyal partner for our customers. During my last three years at Staffbase I've had the chance to help our product grow, but also my team and responsibilities. Everything is in a constant change and we're ready for this change - with tools, people and mindsets.
