With so many moving parts and different ways of assessing performance, monitoring online ad campaigns is rarely frustration-free, whatever platform you’re using. LinkedIn Ads might not be the worst offender (looking at you, Meta), but it still suffers from the main issues that make life difficult for anyone wanting to quickly check in with key LinkedIn campaign data:
The fighter-pilot-precision needed to click and scroll to that one number you want.
The lack of truly up-to-the-minute data.
Limited options for sharing data without opening up access to your account.
But we’re not here to discuss everything that’s wrong with the LinkedIn Ads interface. We’re here to explore a more streamlined way to monitor the numbers you care about from LinkedIn Ads and beyond, in real-time.
In this article we’ll cover how to build custom LinkedIn dashboards that…
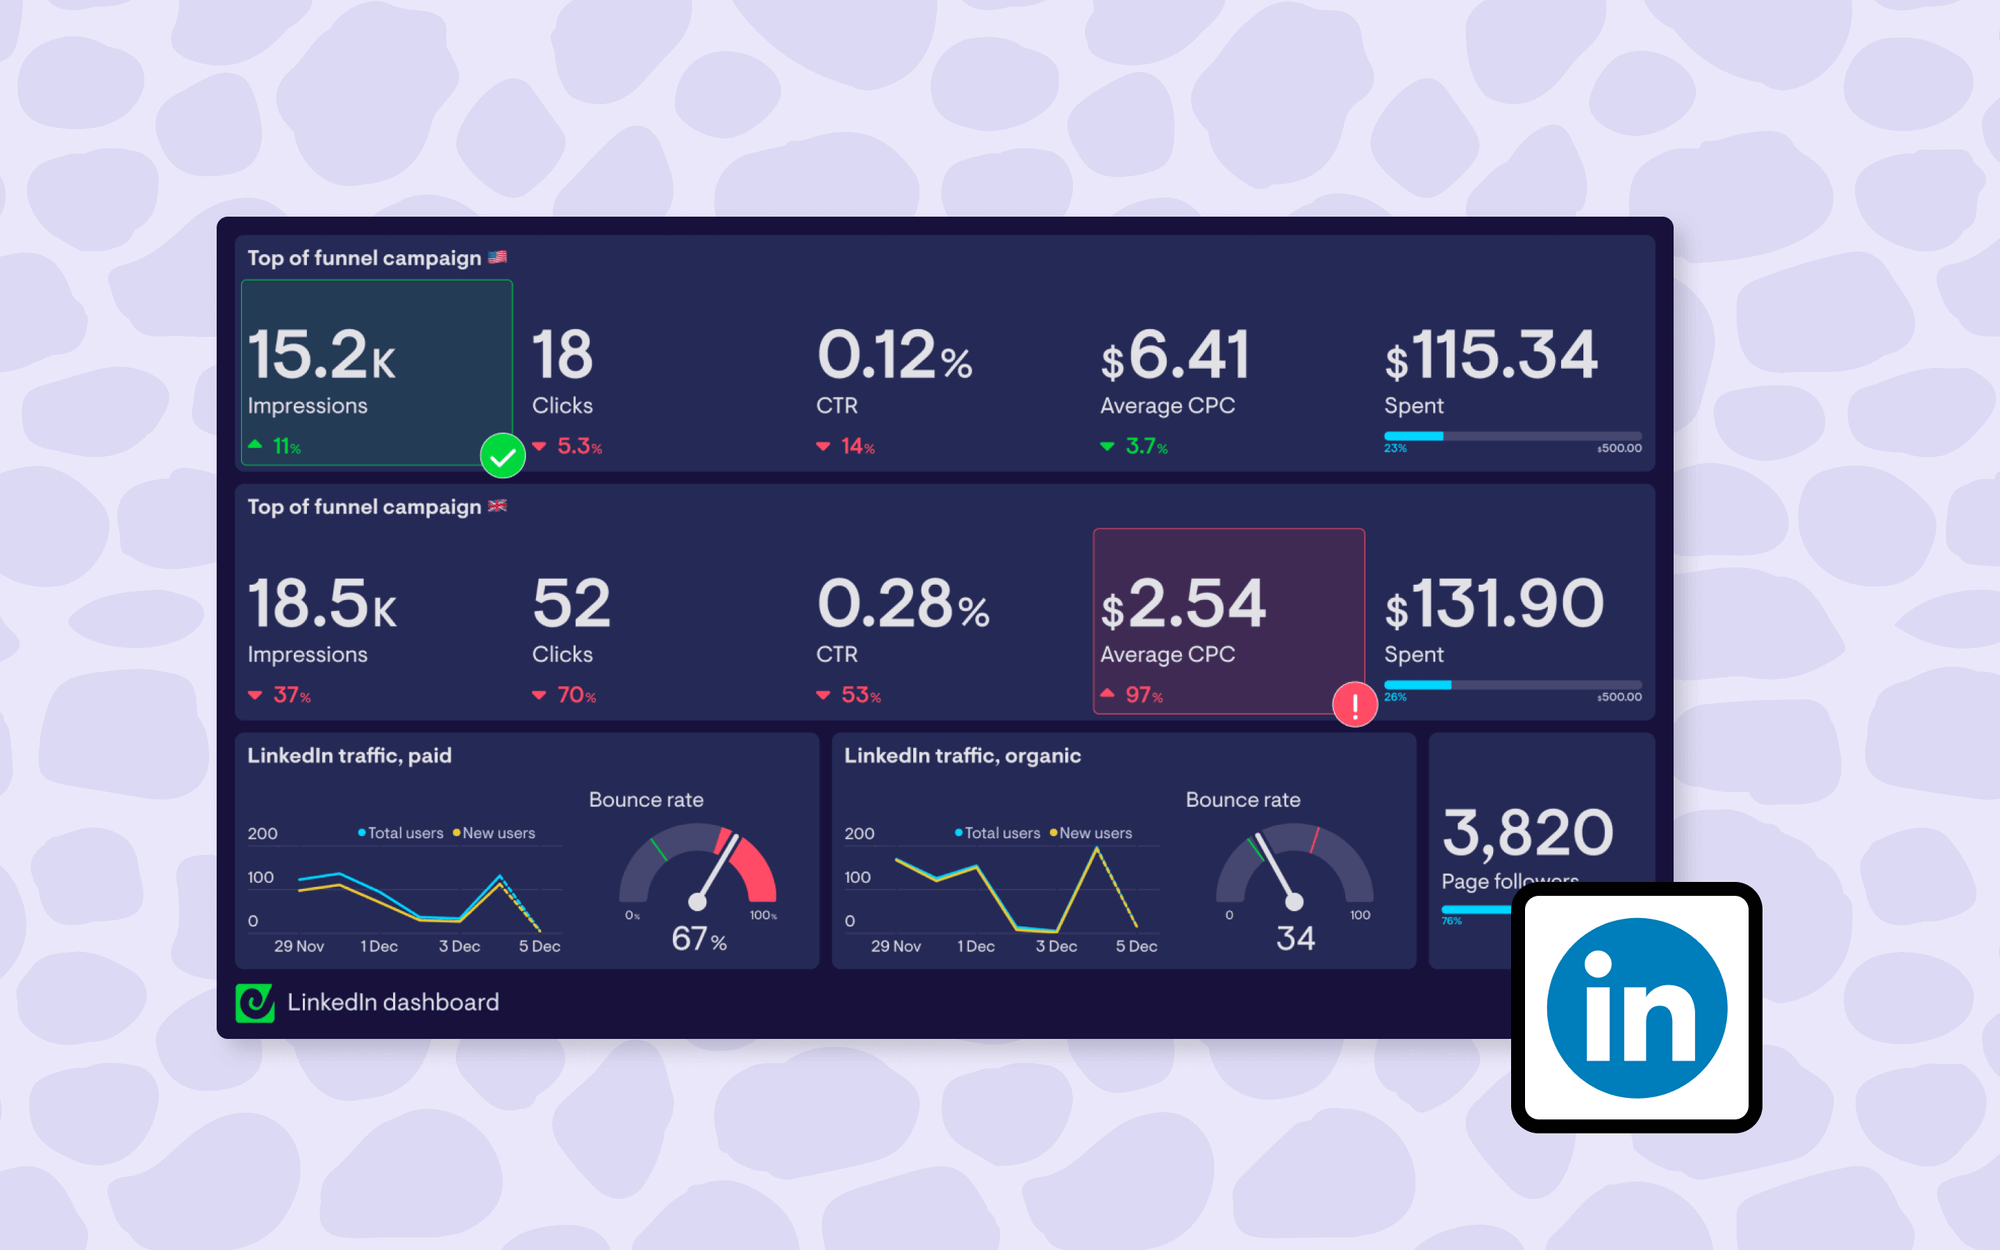
- Show a live view of key LinkedIn Ads metrics such as campaign impressions, clicks, CTR, CPC and spend
- Let you monitor live KPIs from over 90 other sources, including other ad platforms, Google Analytics and spreadsheets
- Can be send out automatically every day, week or month to make LinkedIn campaign reporting easier
- Are easily shared with teammates or stakeholders with a link or displayed on office TVs
Interested? Read on!
Building a custom LinkedIn dashboard: what you’ll need
For this quick guide we’re going to walk through how to build a custom dashboard for your LinkedIn Ad campaigns using Geckoboard. Geckoboard is standalone KPI dashboard software that integrates directly with over 90 different business tools, and we just happen to make it.
Unlike heavyweight BI tools, Geckoboard is designed so that anyone can get up and running with a professional real-time dashboard in about 15 minutes, without any coding skills or big budget, making it a great choice for busy marketers who need to pull something together quickly.
To get started you will need:
- A LinkedIn Ads account: This should contain data for at least one campaign
- A Geckoboard account: You can set one up free for 14 days using this link, no payment details required.
- About 15 minutes.
Making a LinkedIn Ads dashboard: step-by-step guide
The first thing to do if you haven’t already, is to create a Geckoboard account, which will make it possible to connect to various data sources and build dashboards in your web browser.
Once you’ve created your account, the next step is to connect your LinkedIn account to your Geckoboard account so you can start visualizing your campaign data. From Geckoboard’s list of data sources, select the LinkedIn & LinkedIn Ads data source to get started.
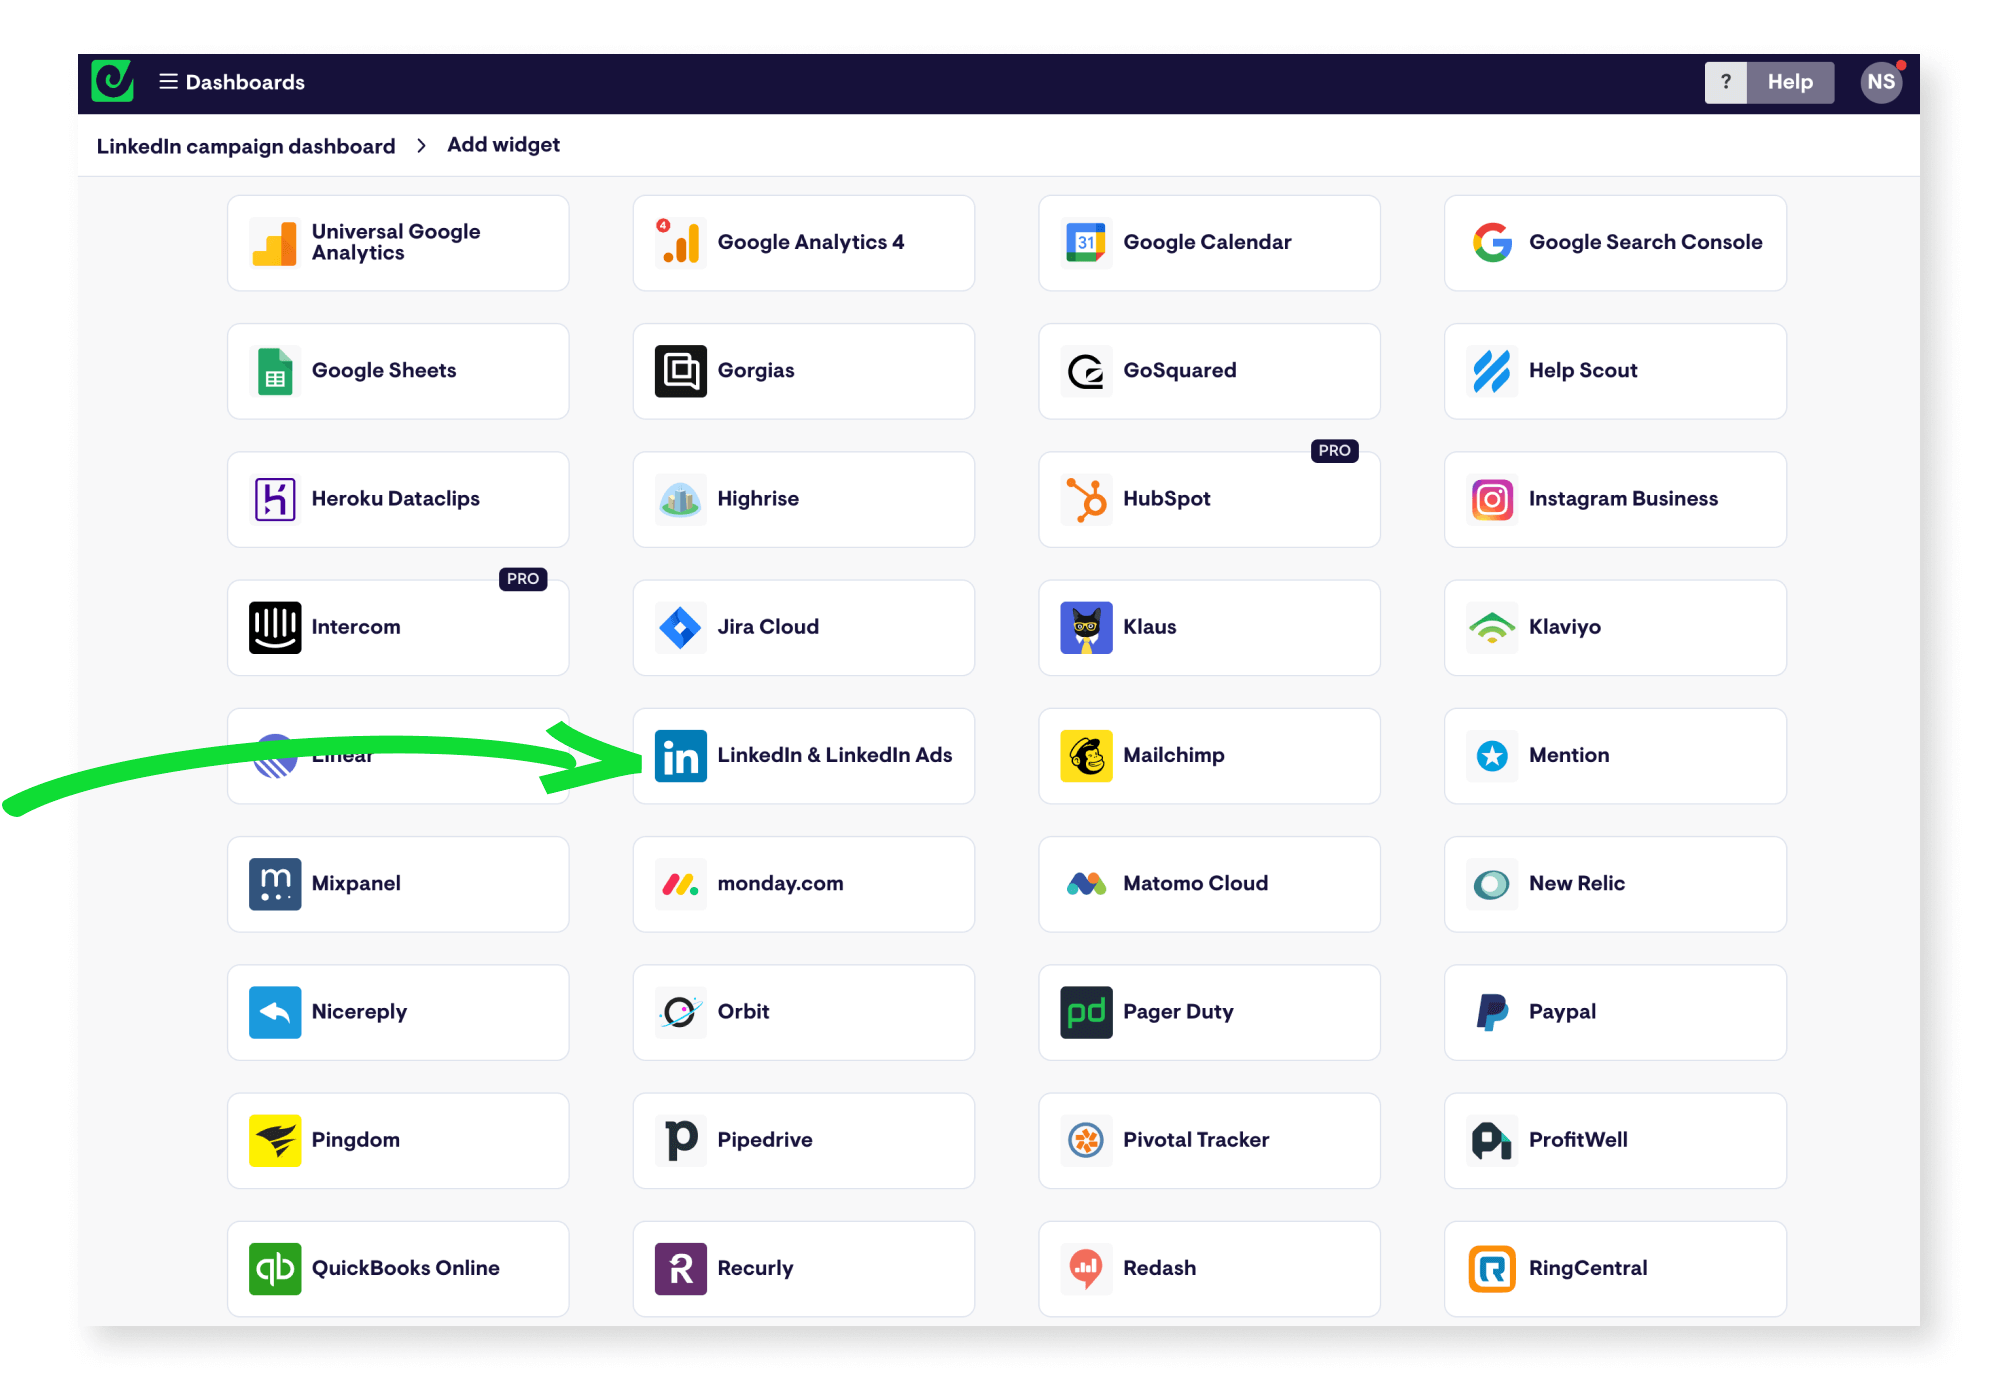
Next, you’ll need to pick which category of data you’d like to visualize:
- Company follower count
- Post stats
- Ad performance
The first two options allow you to visualize some high-level metrics related to how your profile is performing organically. In this example though, we’ll pick Ad performance to access a selection of LinkedIn Ads KPIs.
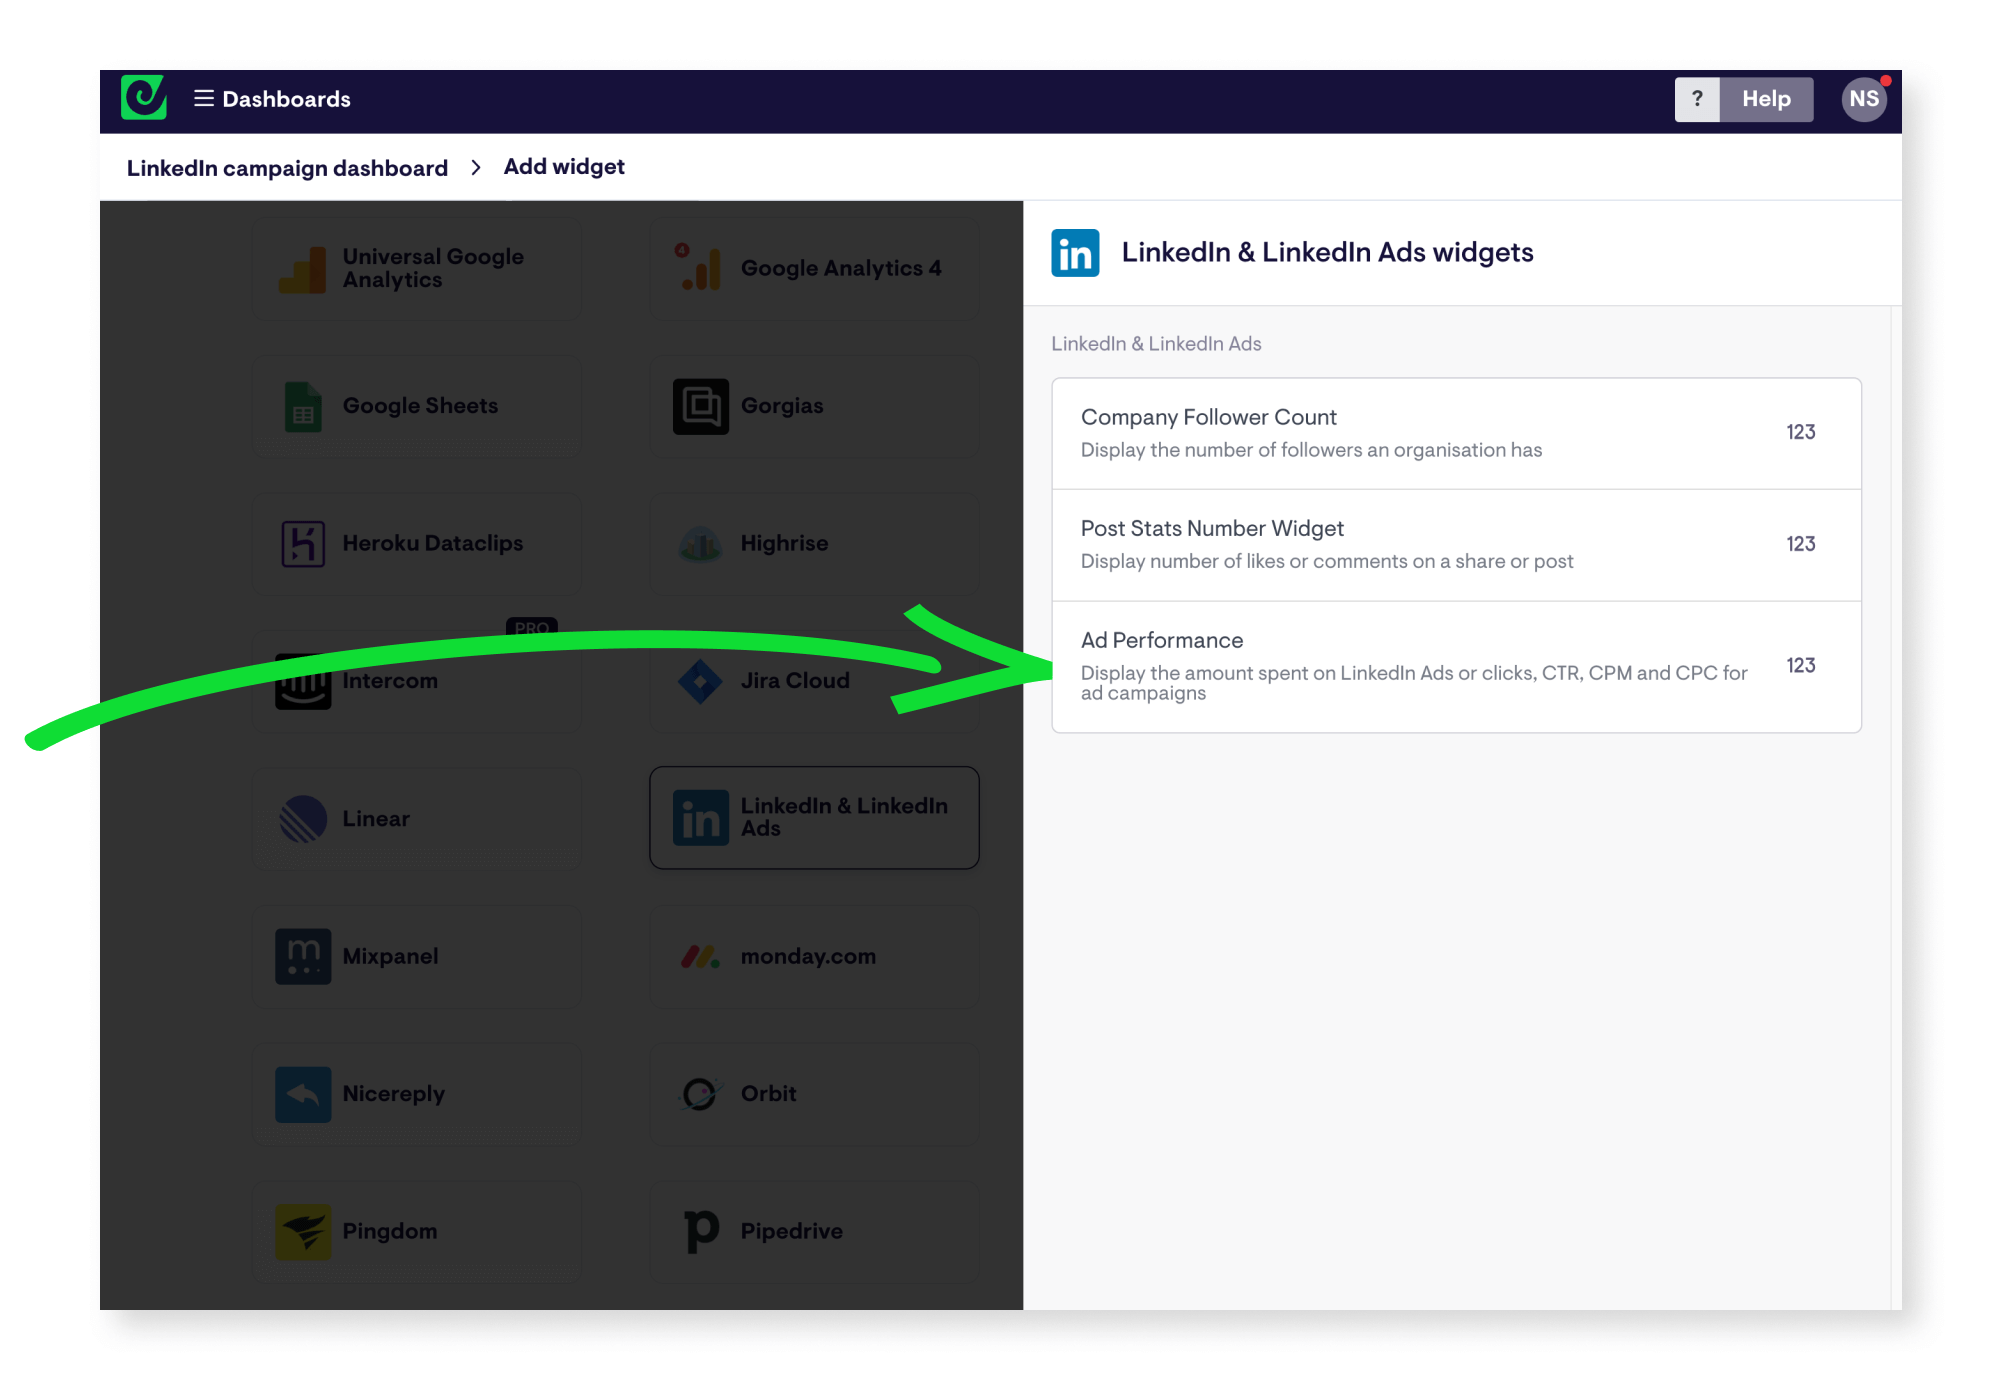
The first time you do this, you’ll be asked to set up a secure connection between Geckoboard and LinkedIn Ads by logging in with your LinkedIn account.
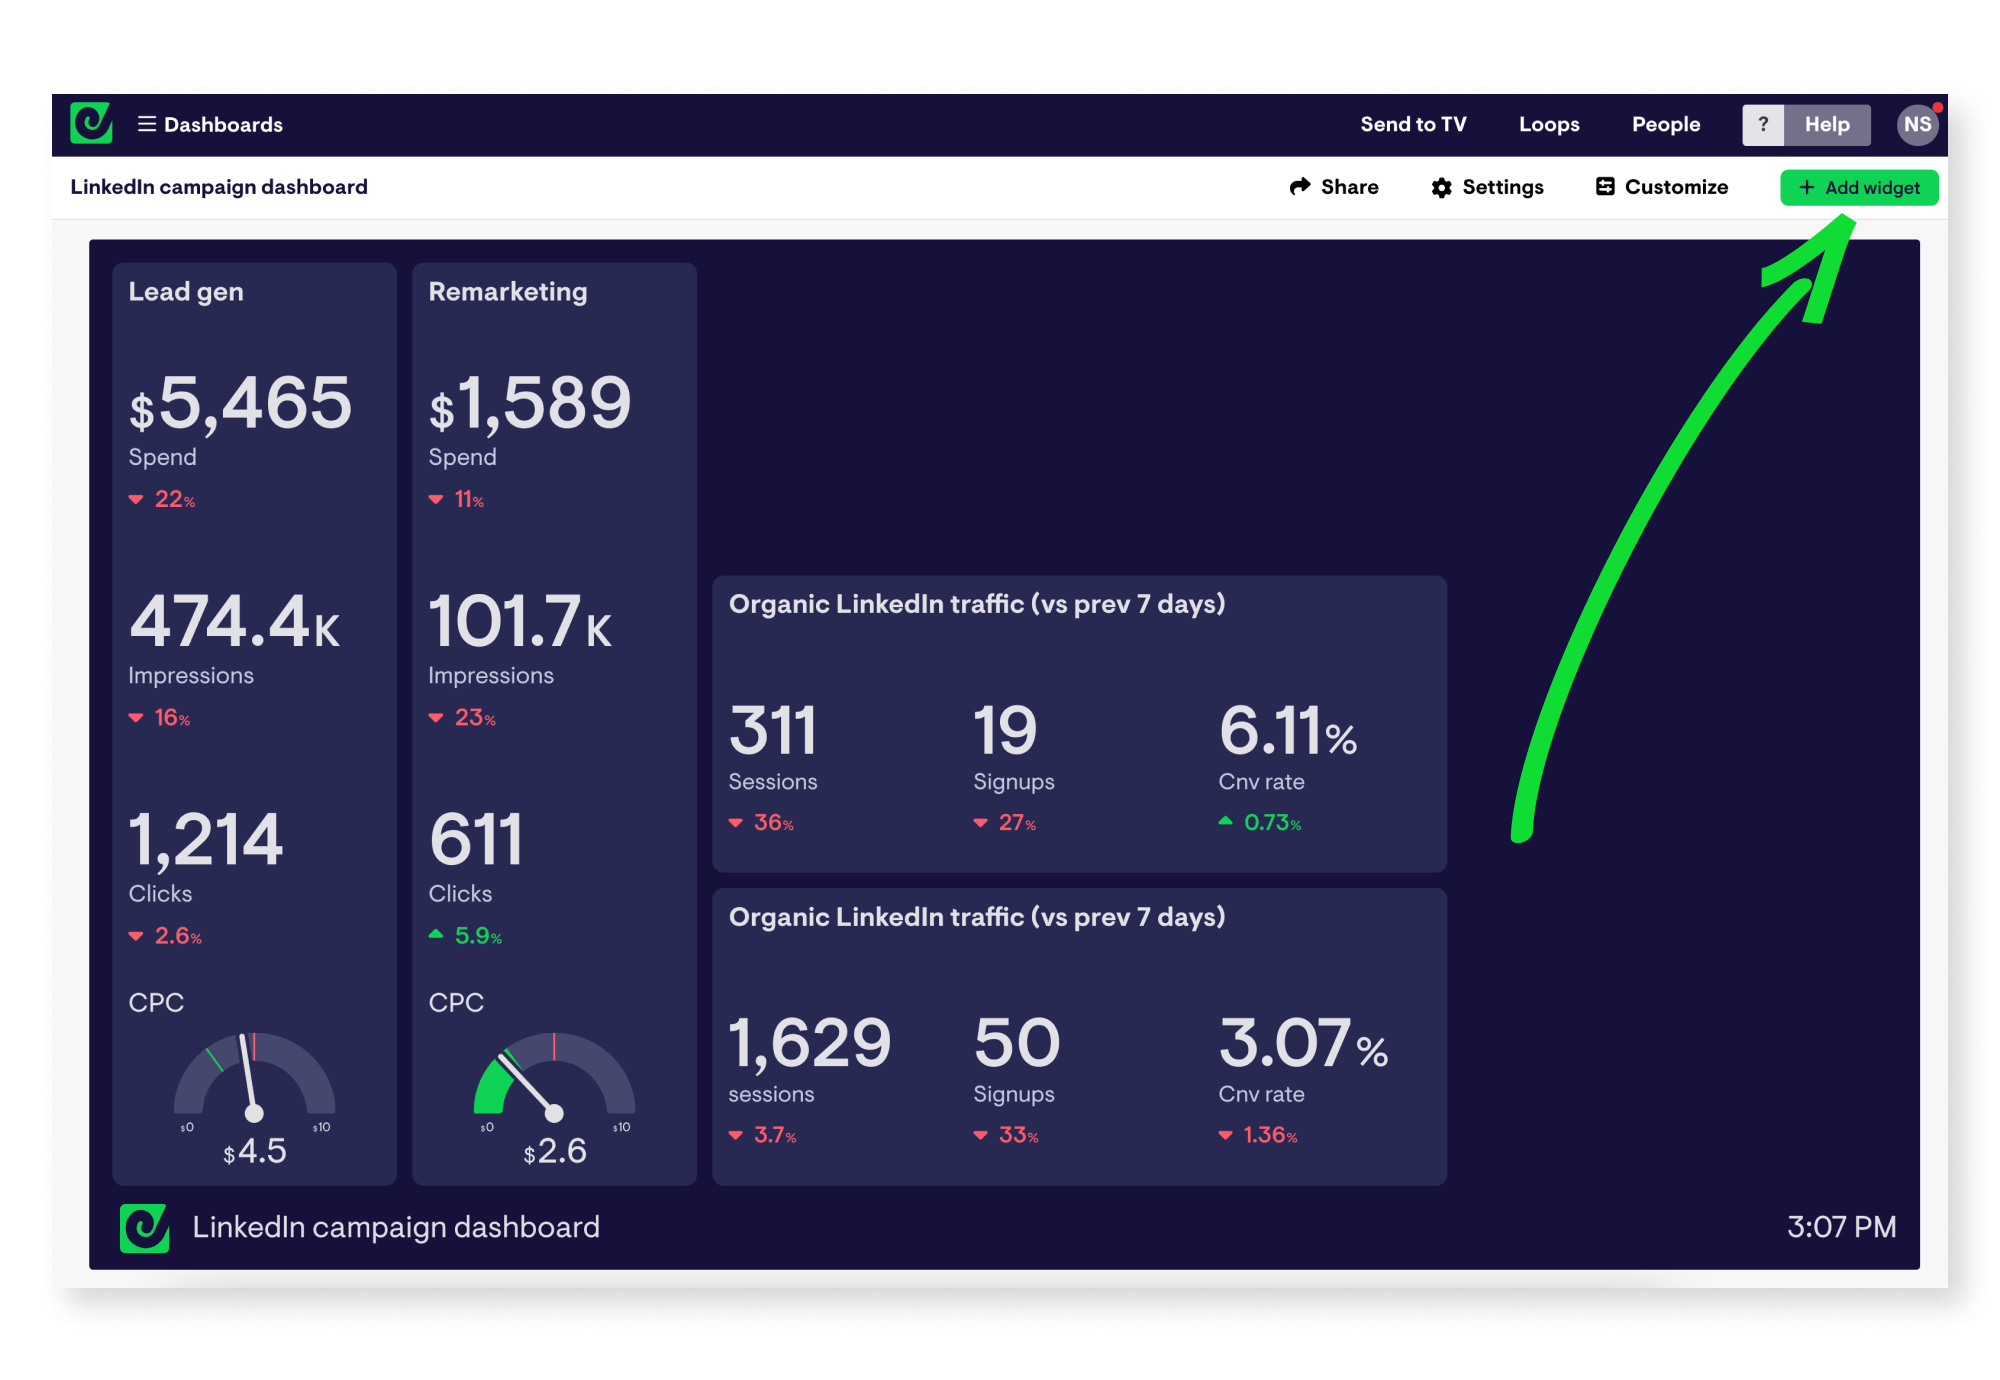
Continue to set up your first widget by working through the options presented, selecting which metric you’d like to visualize, setting a time period to show, filtering by ad status or group.
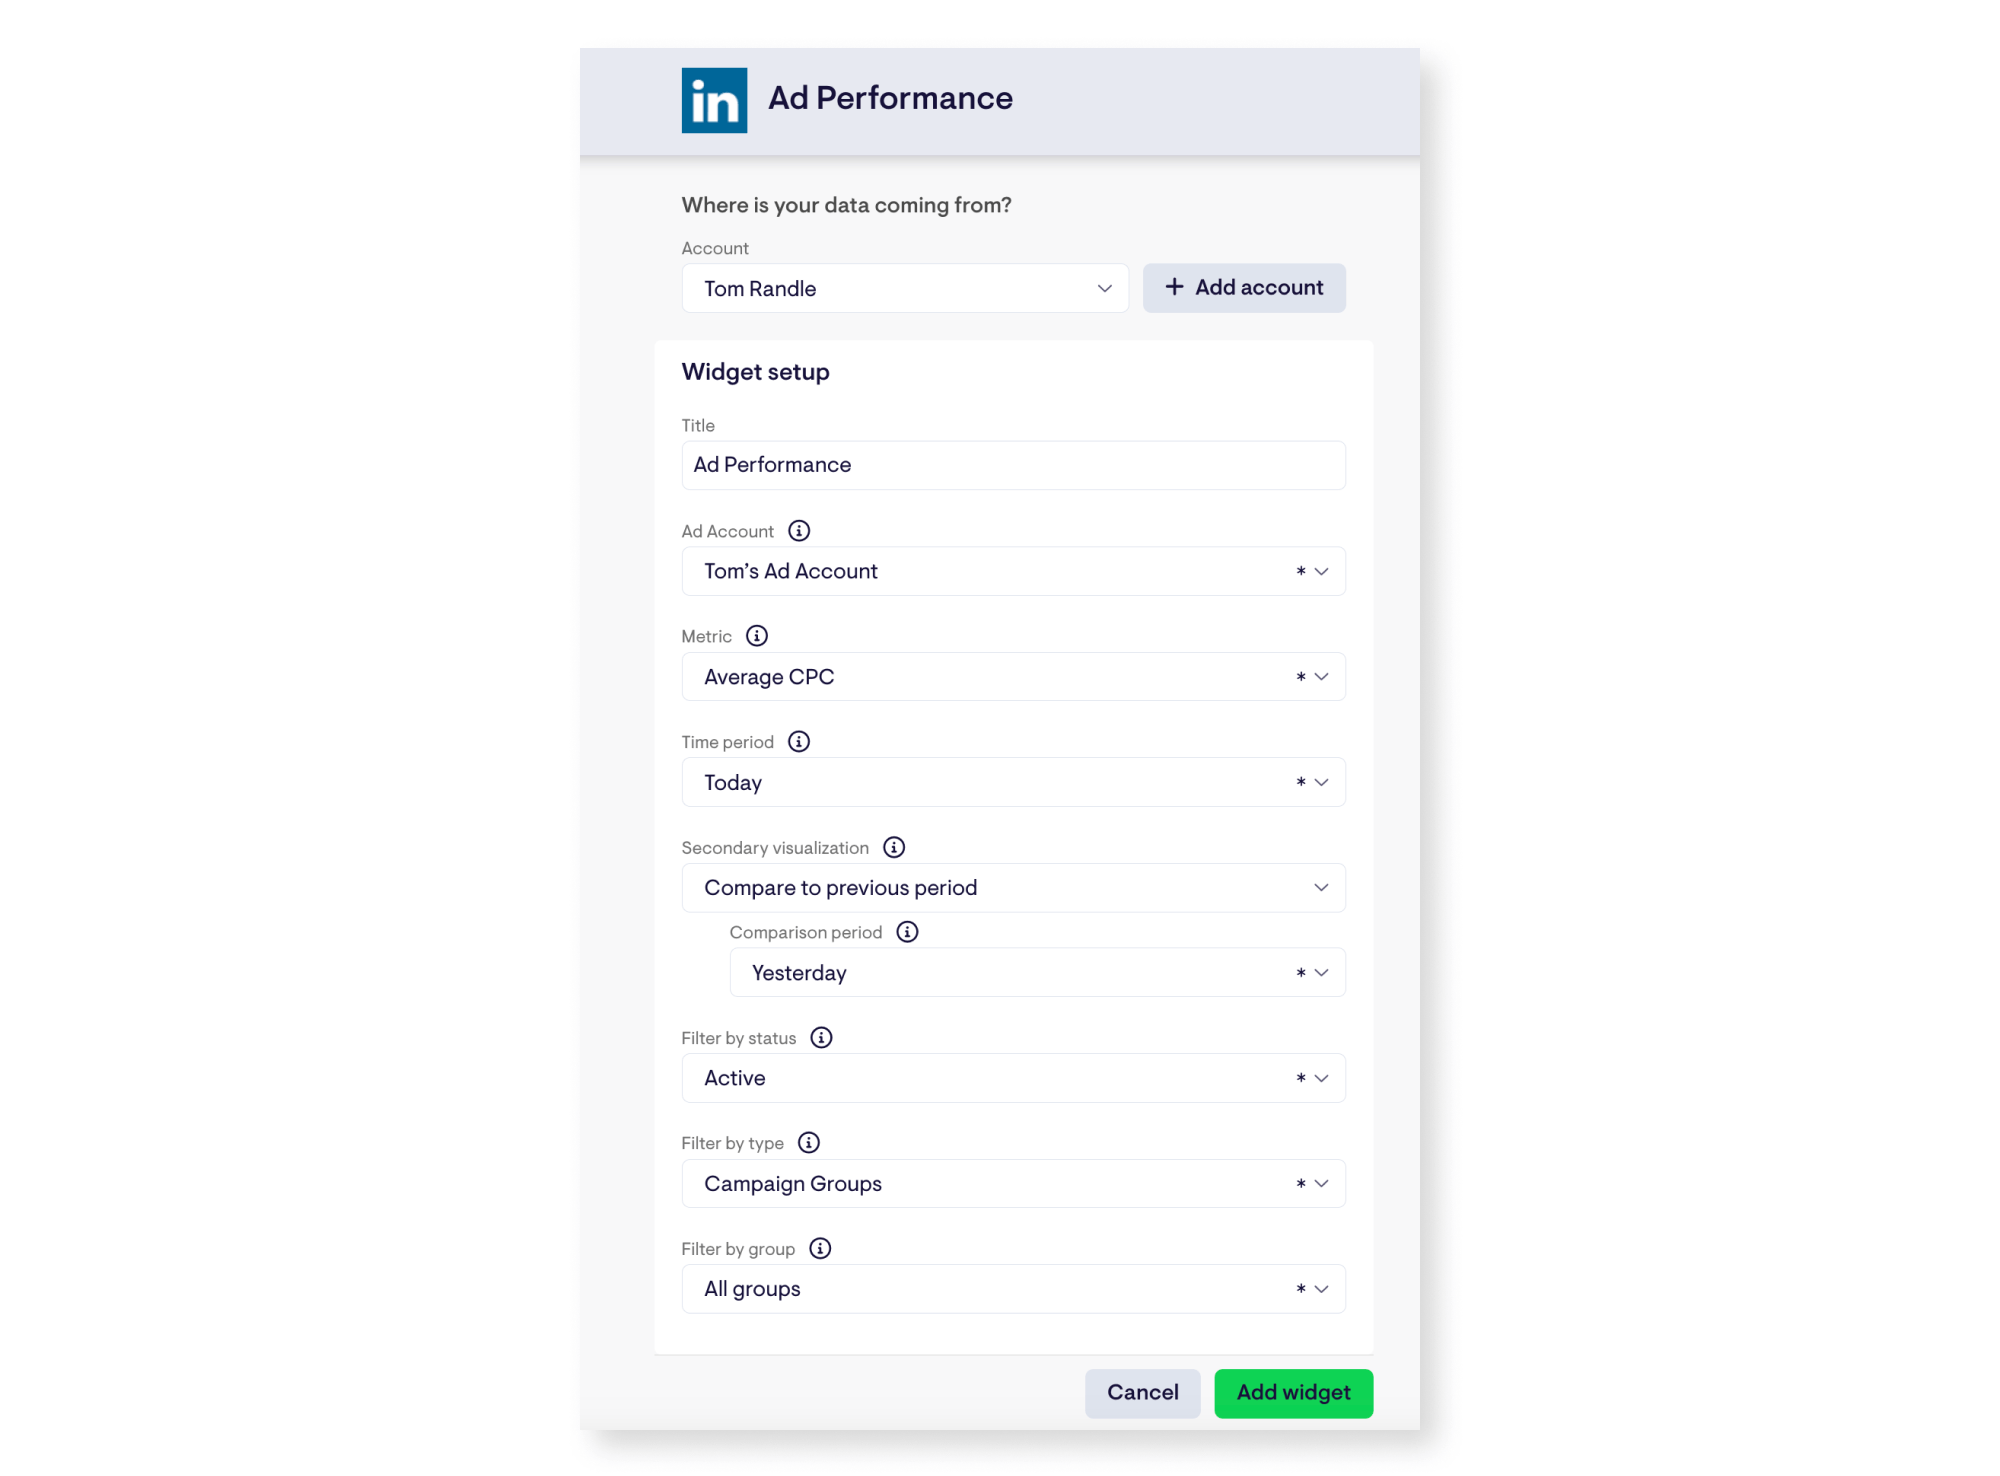
When you’re happy, click ‘Add widget’ to jump to your dashboard, which will now contain your first block of live data, called a widget.
Geckoboard’s LinkedIn Ads widgets refresh every 5 minutes automatically, so your dashboard will always display up-to-date information for whoever looks at it.
Adding data from other sources
Geckoboard’s LinkedIn Ads integration allows you to add a range of metrics from LinkedIn Ads, impressions, clicks, average CTR, average CPC, average CPM and amount spent. You’re not limited to seeing just these on your dashboard though. You can also connect to 90+ other sources, such as Google Ads, Google Sheets, Excel, Salesforce, HubSpot, MailChimp, and Facebook Ads, to create dashboards for monitoring every aspect of your digital marketing activity.
These work in much the same way as the LinkedIn integration; from your dashboard click ‘Add widget’, select a data source, and follow the instructions to set up a connection and build a widget.
It’s also worth mentioning - you can also connect several LinkedIn accounts to your Geckoboard account, meaning if you’re managing campaigns spanning different accounts - for different clients or brands for example - you can pull metrics together into one view for easy access.
Speaking of easy access...
How to access and and share your LinkedIn dashboards
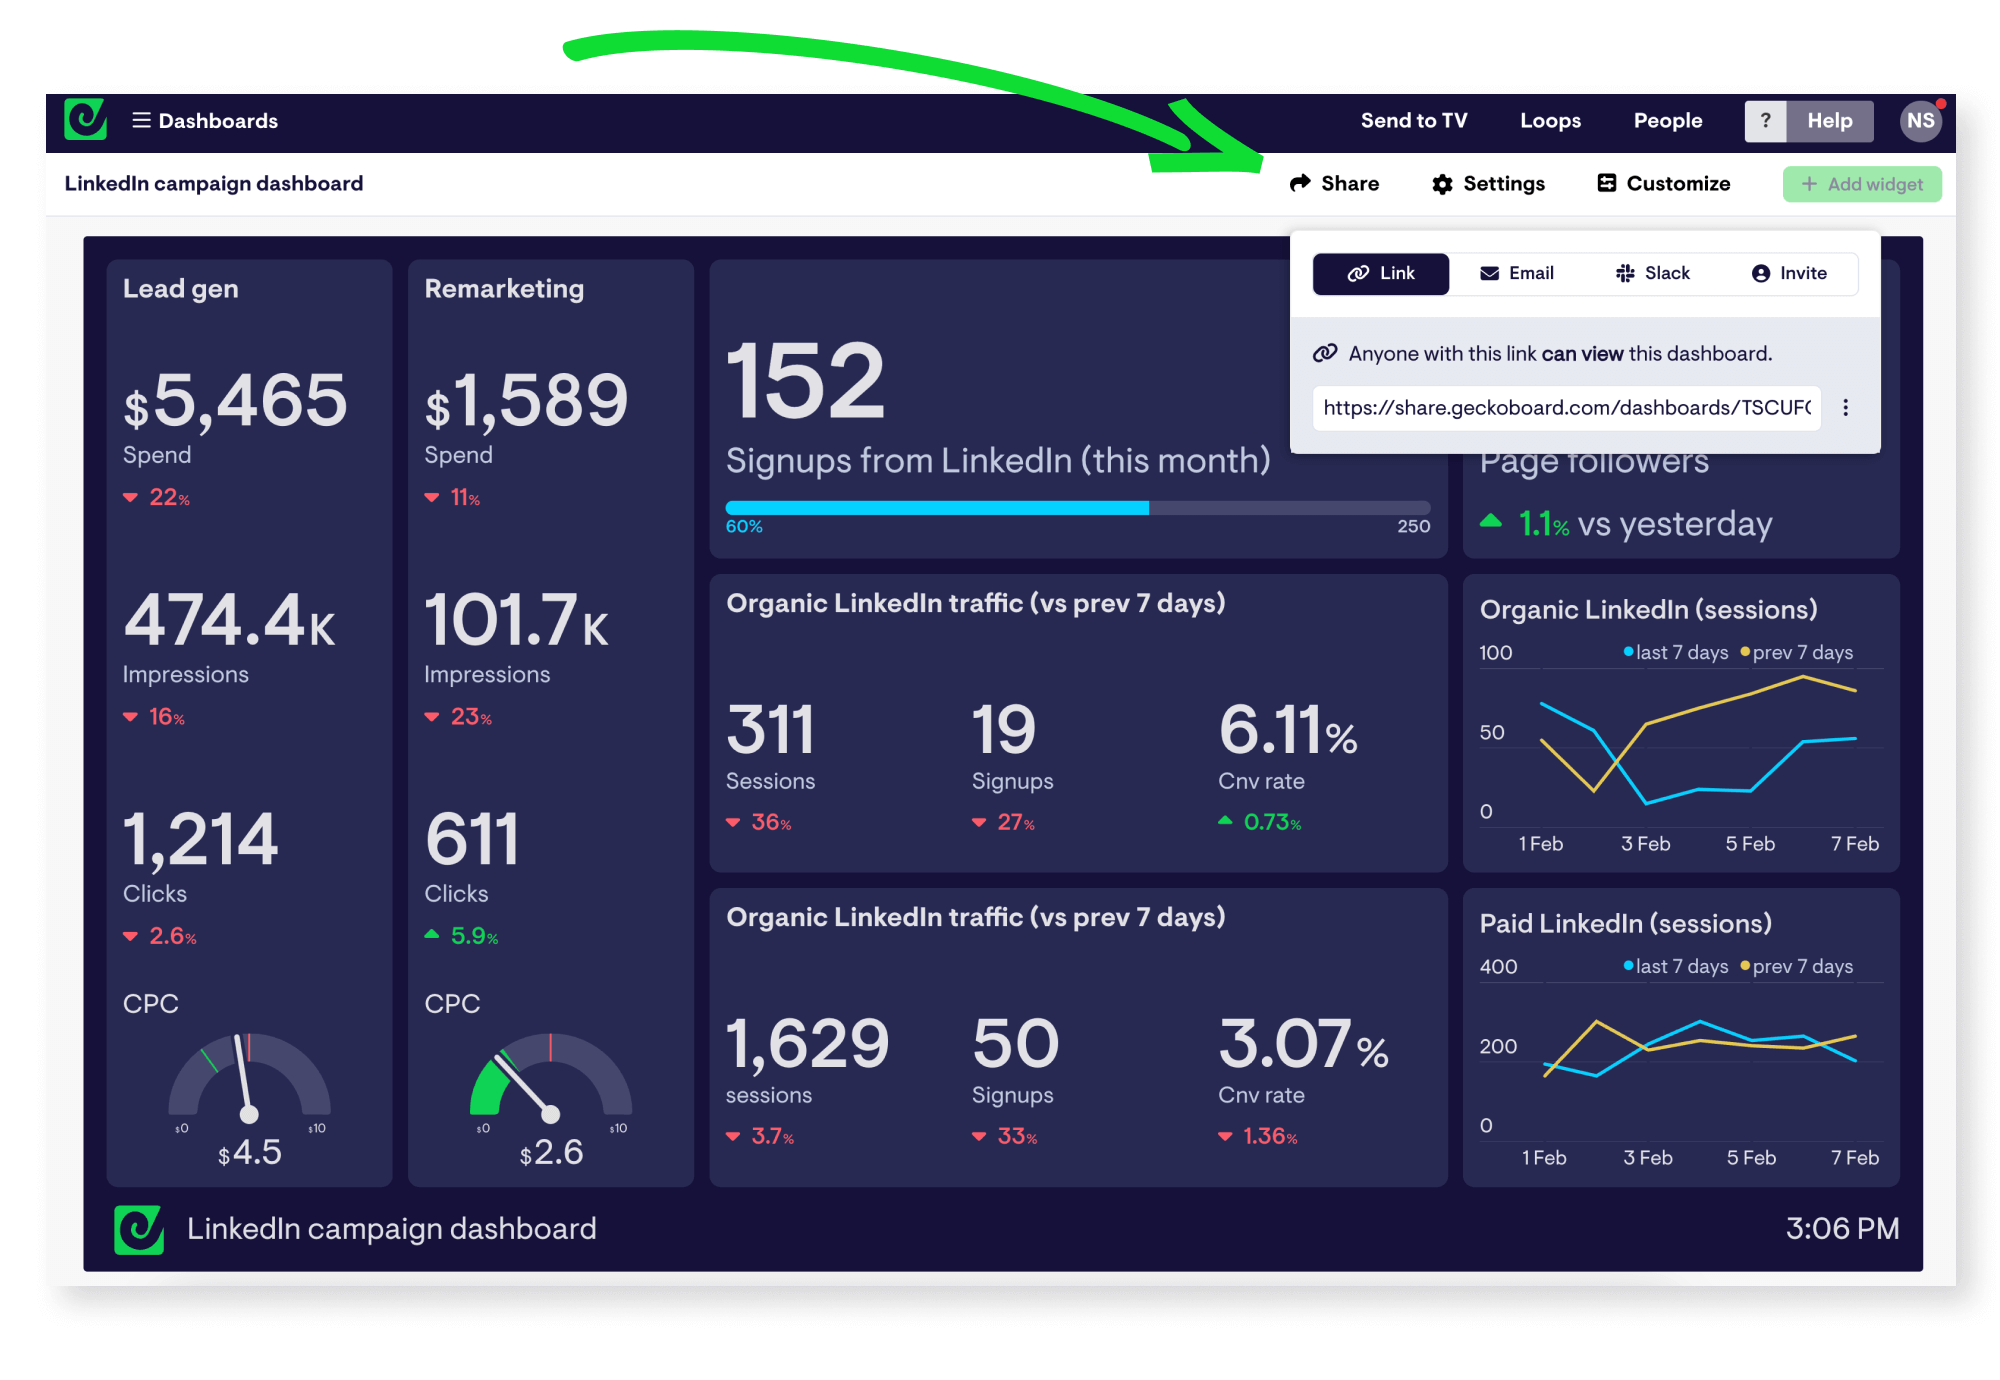
Once you’ve built out a dashboard you’re happy with, there are a few ways you can make it easy to access whenever needed, whether that’s for you, your team, stakeholders in your organization or your clients.
Click the ‘Share’ button in the top right of your account to find options to share your dashboard as a link, or schedule snapshots of your dashboard to be sent automatically to Slack or over email. From here you can also invite others to join your account to view dashboards on mobile devices.
You also have the option to display your LinkedIn Ads campaign dashboard on a TV or large screen in your workspace - something Geckoboard is especially suited for. To learn more about how to get your own live TV dashboard up and running, check out the overview here.
Hopefully this guide has given you a quick overview of how easy it is to create a custom LinkedIn Ads dashboard that will make life a lot simpler for anyone who needs to regularly check data from LinkedIn.
If you’re looking for a bit more dashboard inspiration, have a browse of these marketing dashboards, or if you feel ready to build your own, start a free Geckoboard trial using this link.
