If you want to build a world-class Customer Service team, you need to be data-driven.
Data-driven Customer Support teams have an awareness of their Key Performance Indicators (KPIs) – they understand how these important metrics behave over time. If CSAT drops, or FRT increases, they are the first to realize. They can investigate the underlying causes and respond quickly.
If you use Zendesk to power your Customer Support function, then you have access to a rich source of data, KPIs, support tickets and customer feedback. But getting this data in front of your teammates isn’t straightforward. You may have struggled with manual reporting and communication, and thought: there must be an easier way?
Fortunately, for Slack users, there is a much easier way.
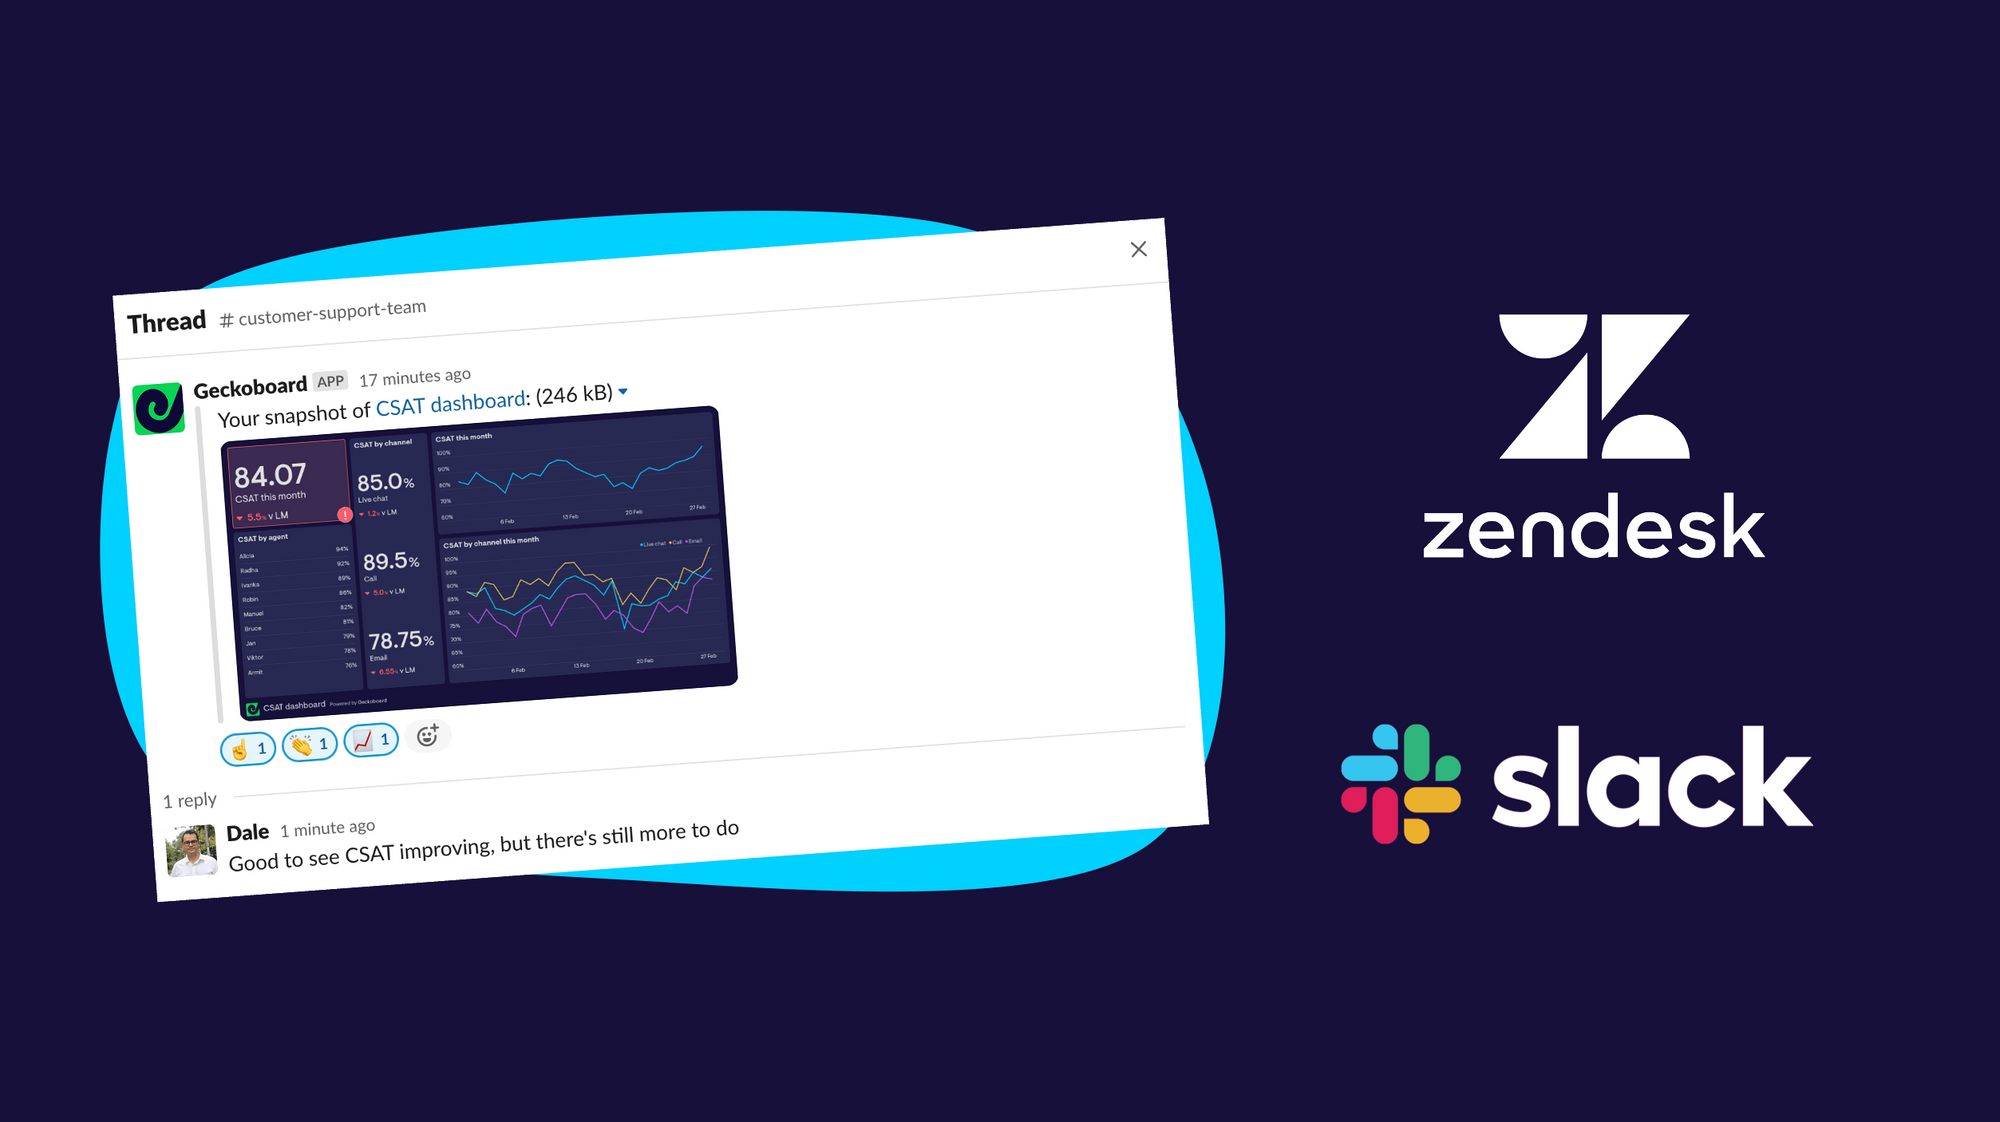
In this guide, we’ll show you how to quickly and easily create live Zendesk KPI dashboards, which regularly and automatically post to your Slack channels, using Geckoboard’s Slack integration.
This will ensure you colleagues never miss a metric, and build their understanding of key metrics over time.
Step 1: Sign up to Geckoboard and connect your Zendesk account
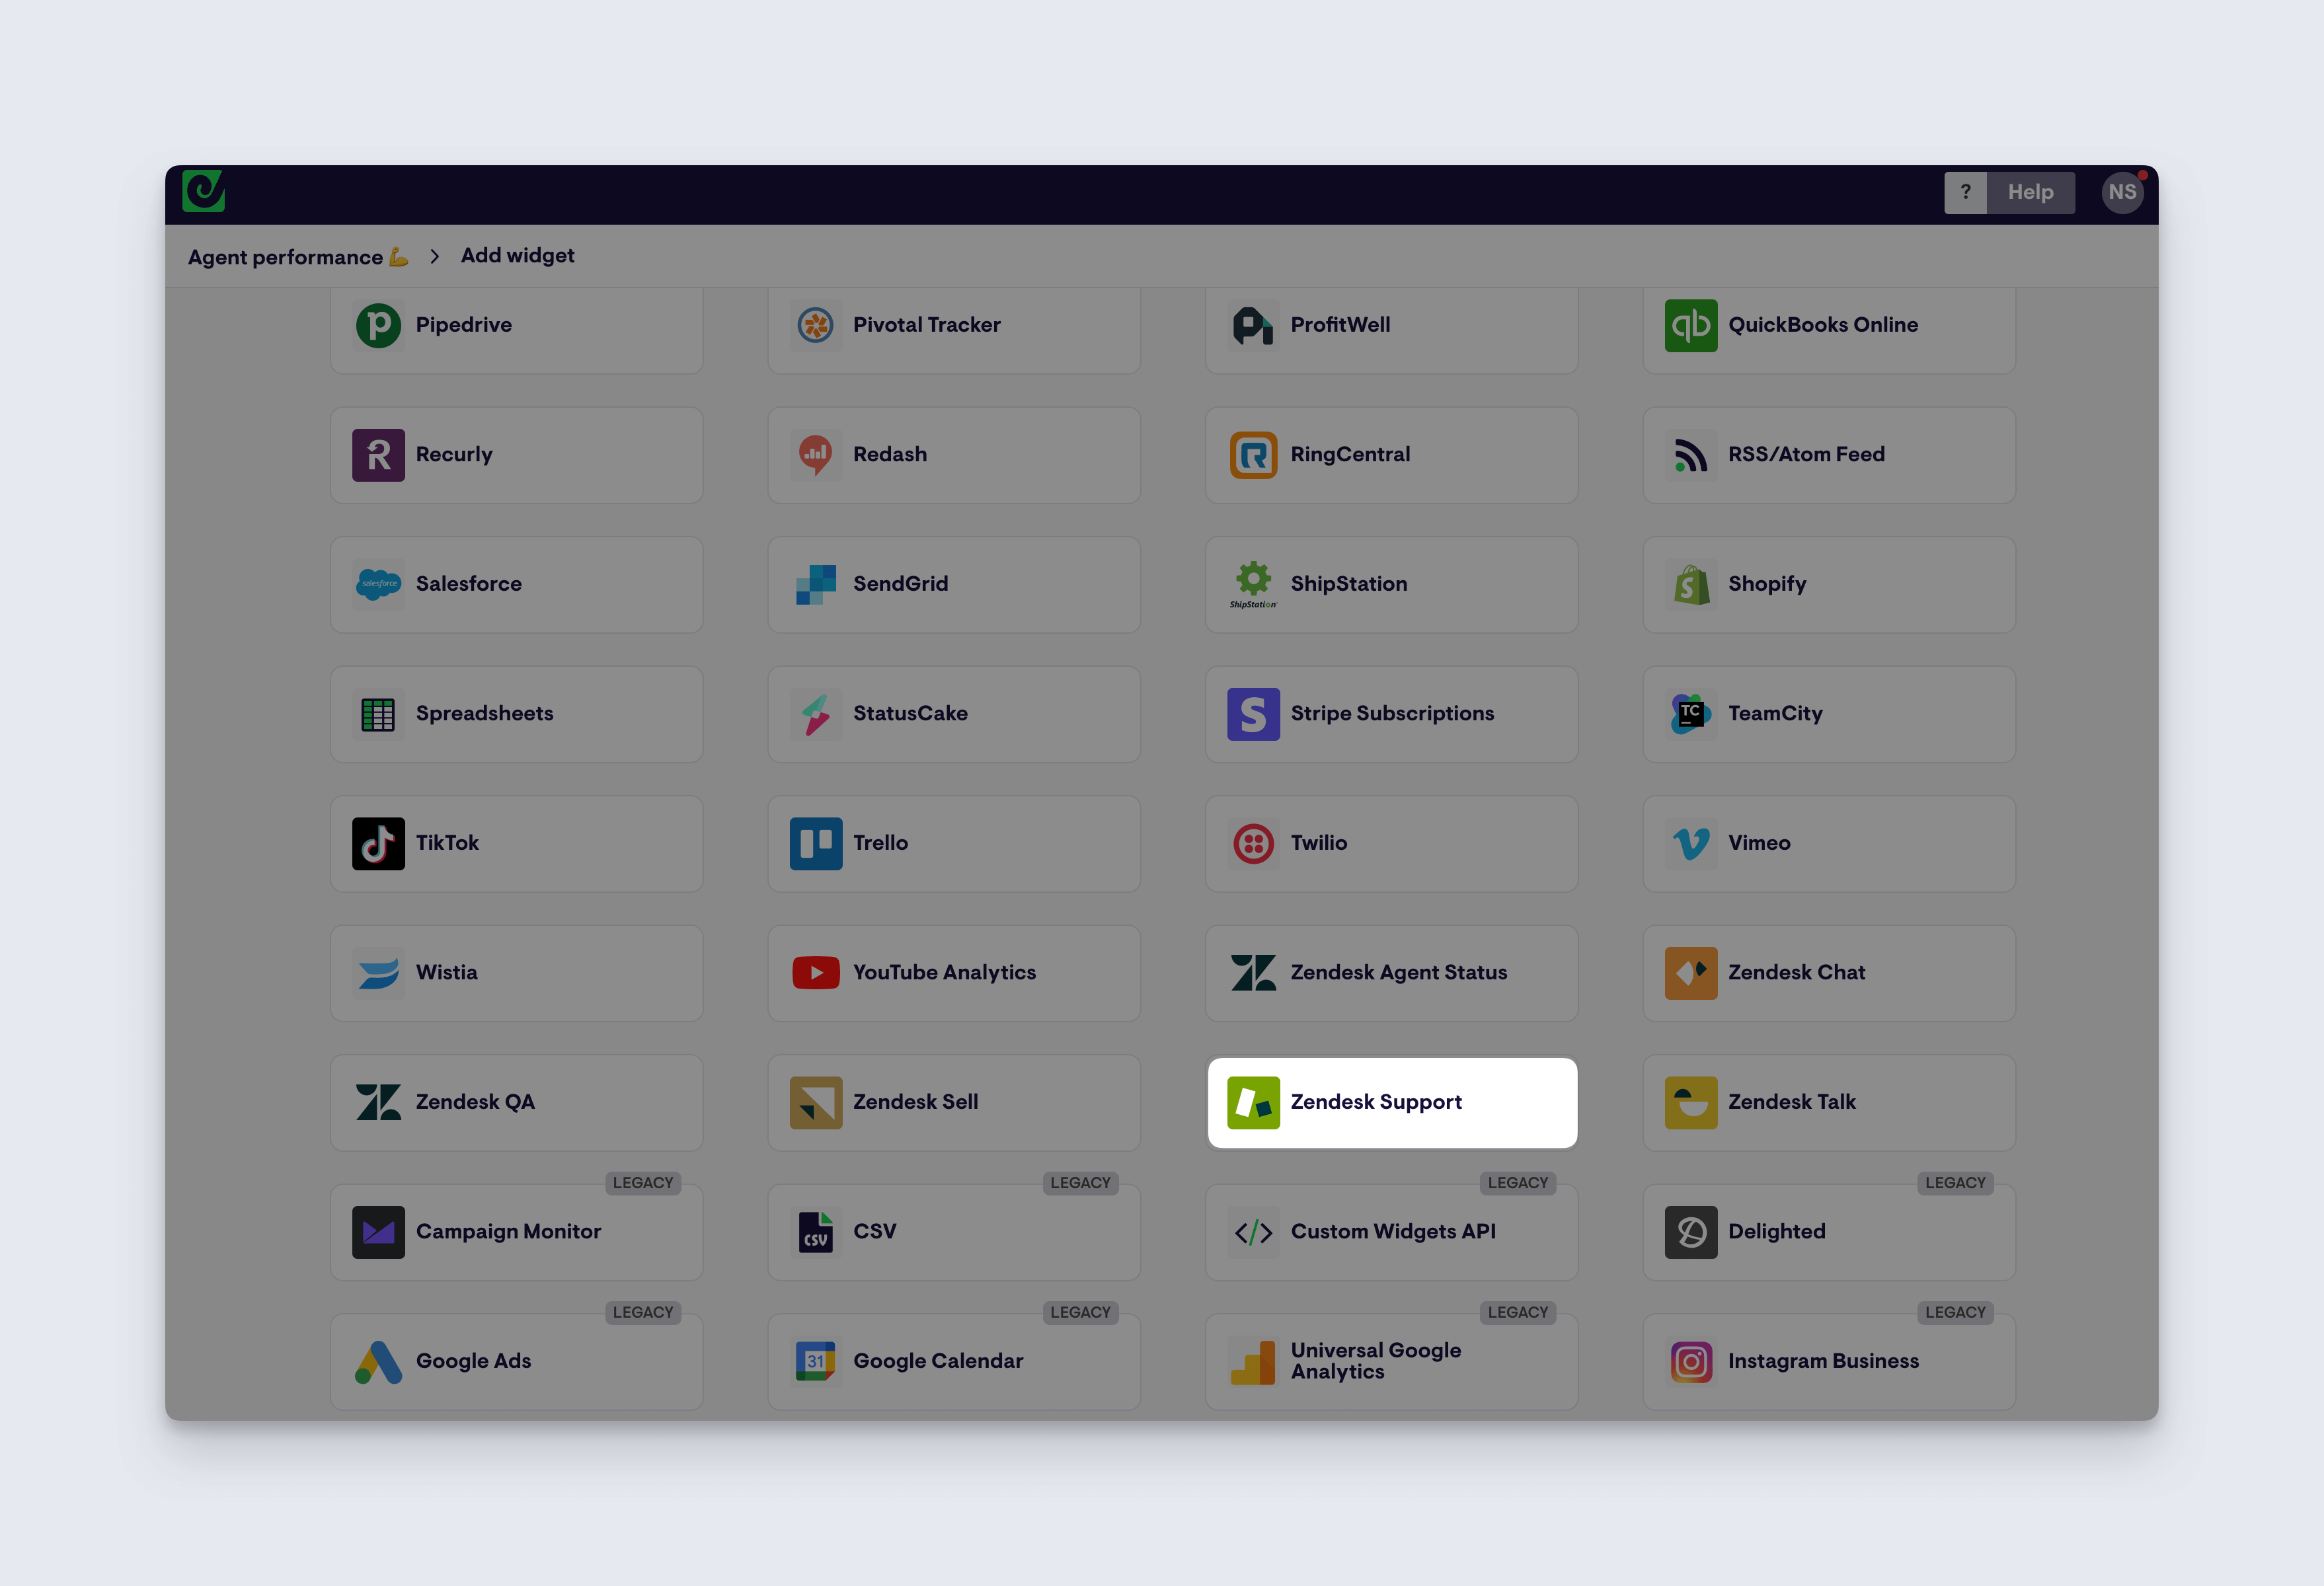
Once you’ve signed up for a free trial with Geckoboard (no credit card required), you can start building your dashboard by selecting either Zendesk Chat, Zendesk Support, Zendesk Talk or Zendesk Sell.
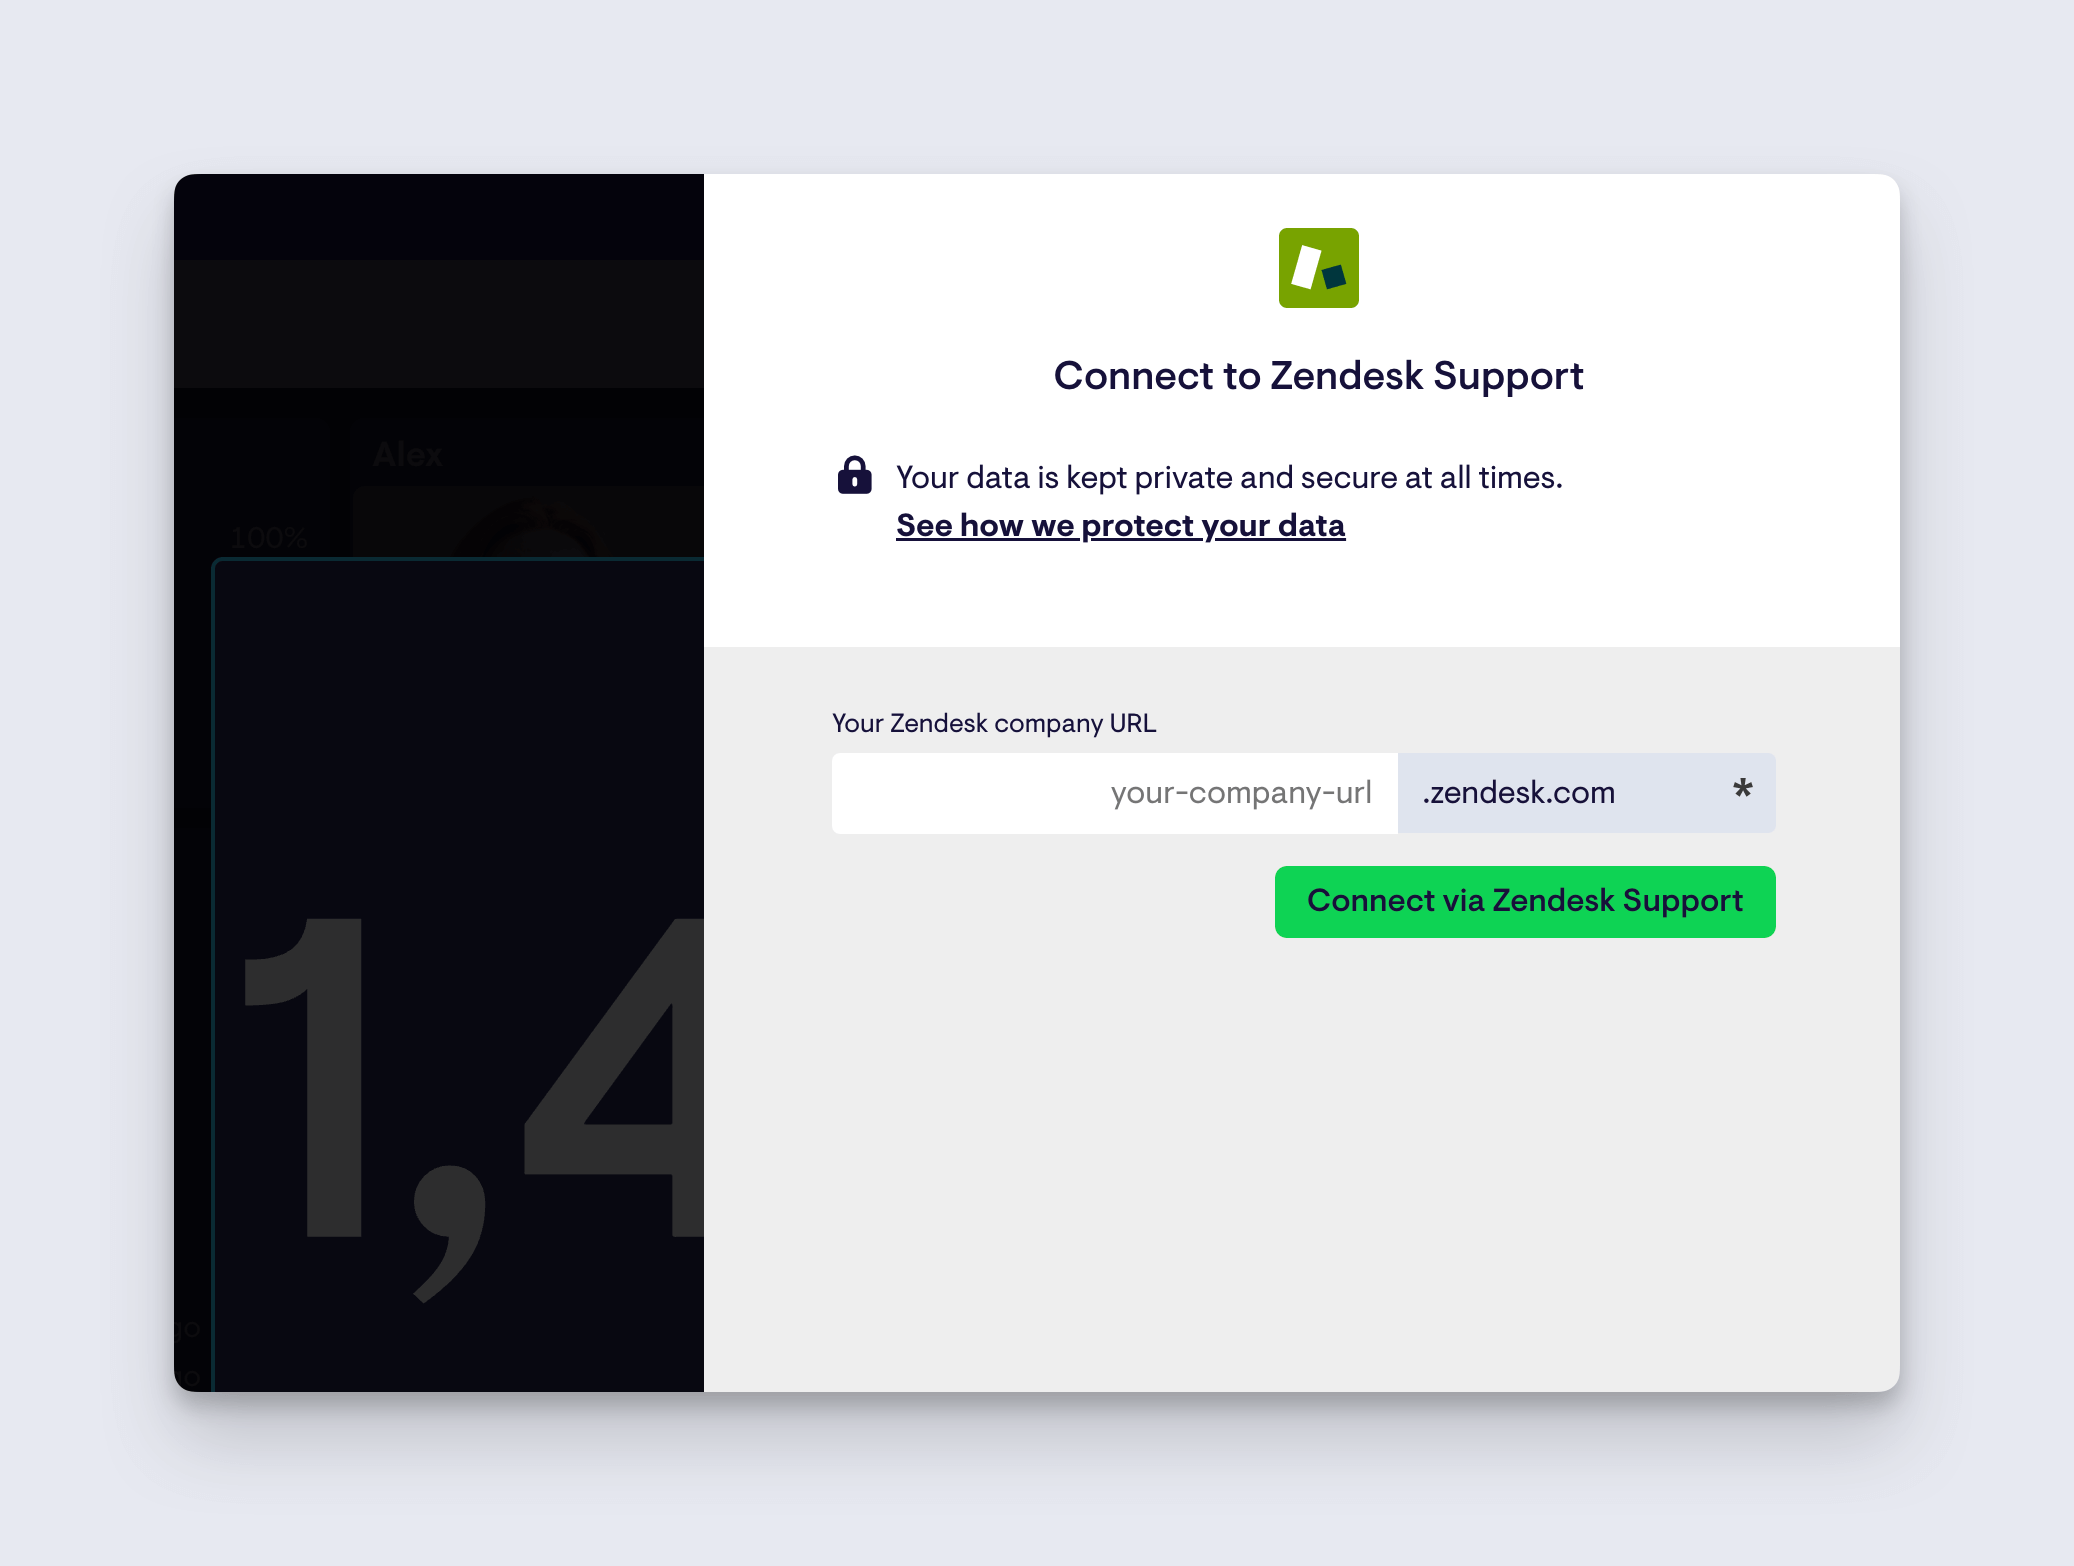
Just connect your Zendesk account by entering your company URL and selecting the connect option.
Step 2: Create a widget and add it to your dashboard
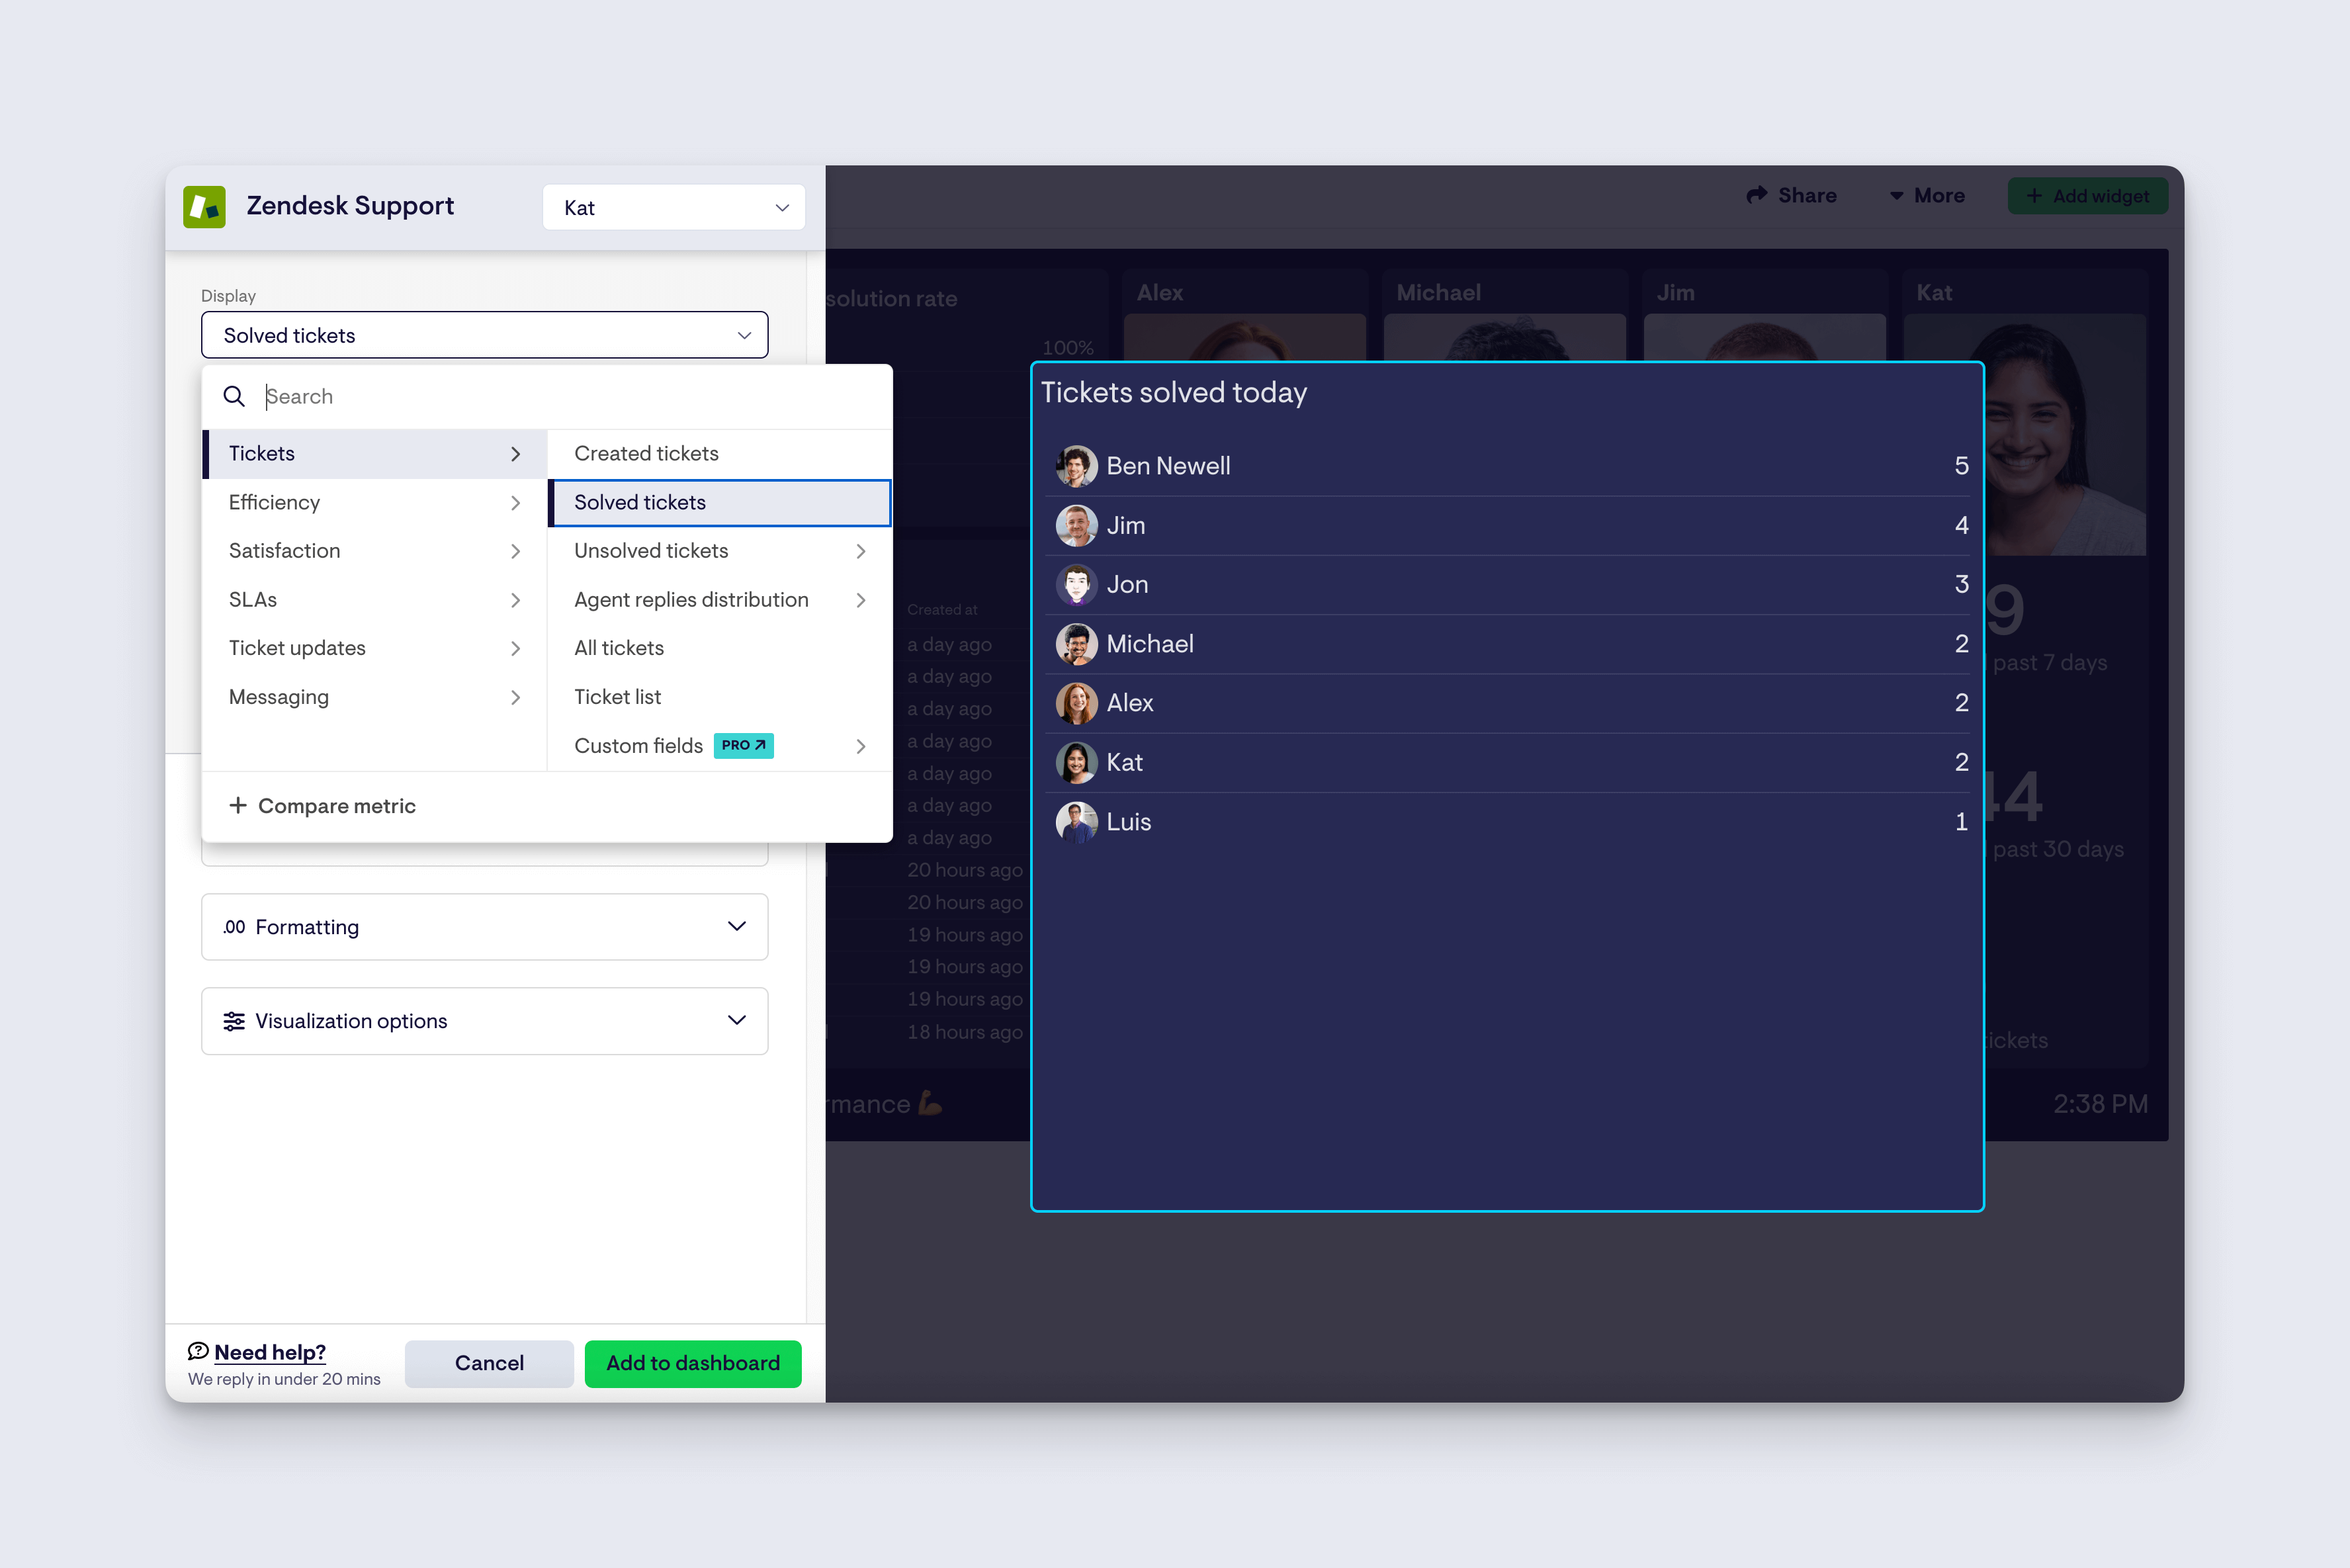
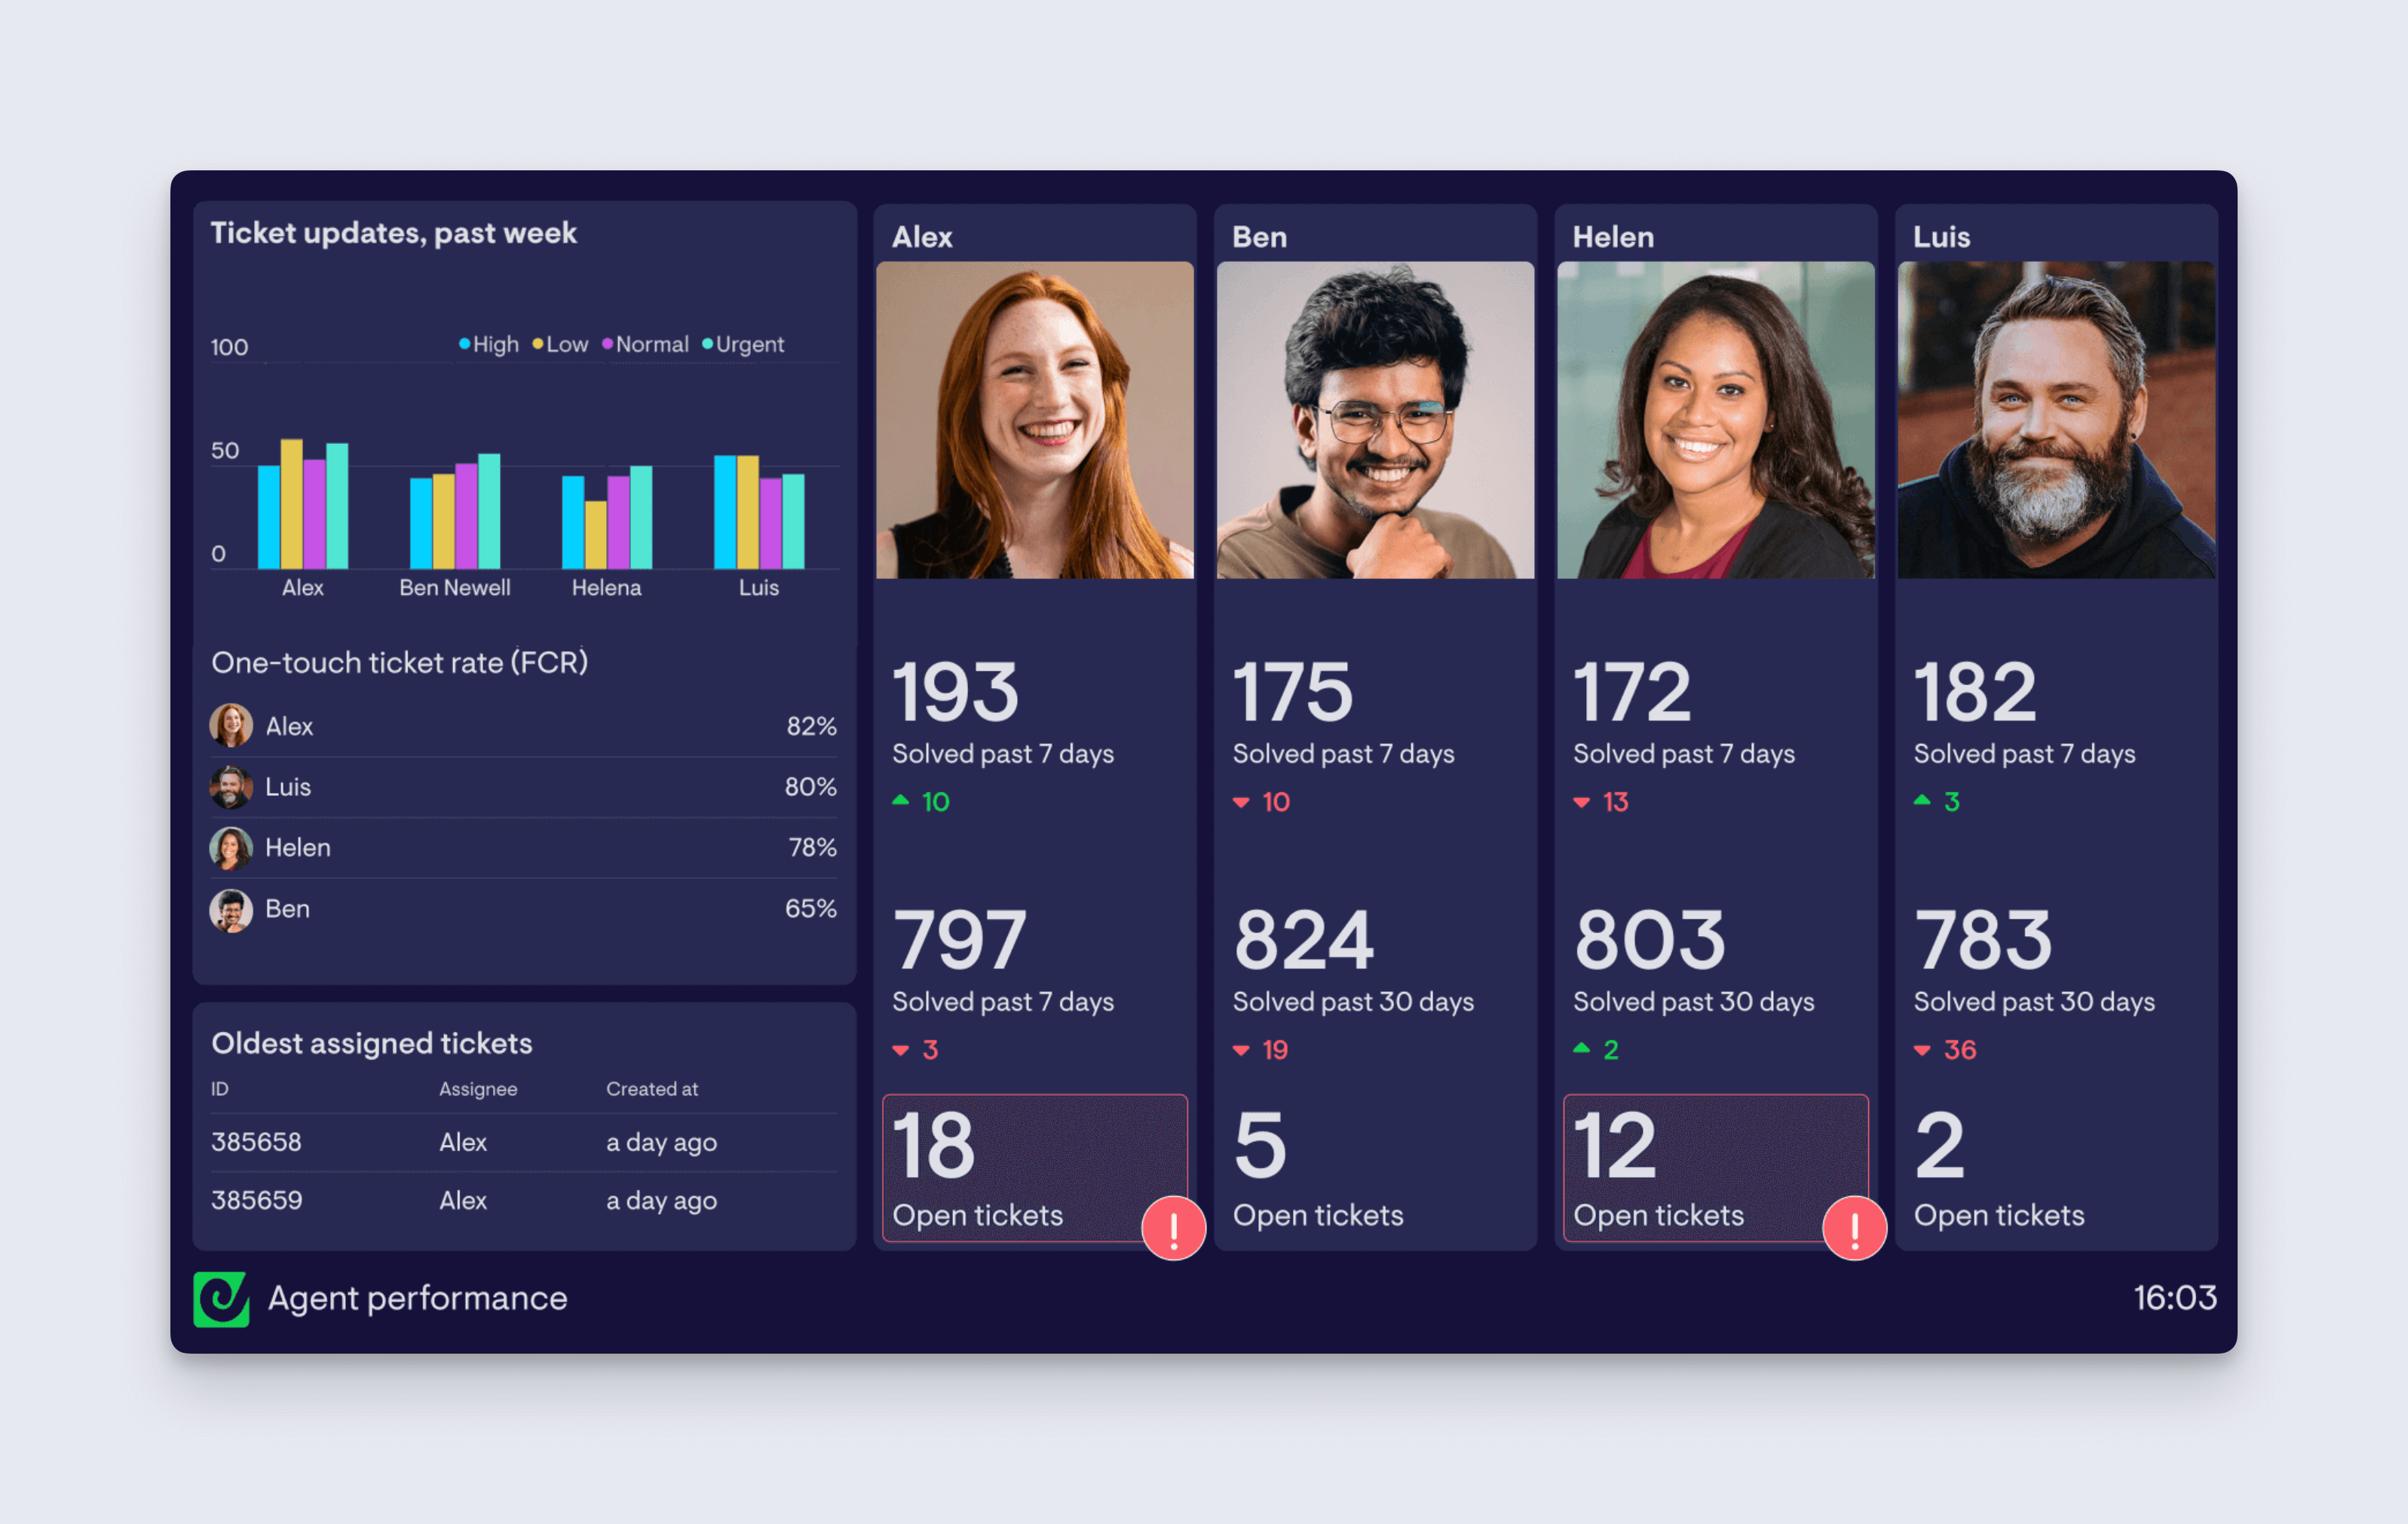
Start by building a widget (a widget is simply a data visualization, such as a number, a gauge or a bar chart) then add it to your dashboard. With each widget, you can choose which data to display, what type of visualization you want, and how to label the information.
You might choose to display metrics related to Customer Satisfaction (CSAT), First Response Time (FRT) or number of support tickets created.
You can also add goals, comparisons and status indicators, which give your metrics valuable context. This helps people viewing the dashboard in Slack to understand whether the metrics are good, bad or have recently changed.
Step 3: Continue adding widgets to build up your dashboard
Once you’ve built your first widget, you can add more to build up a dashboard that displays all your most important metrics. With Geckoboard, it’s easy to drag and drop widgets or resize them, to create a layout that works for your team.
For more advice on dashboard design, take a look at our guide.
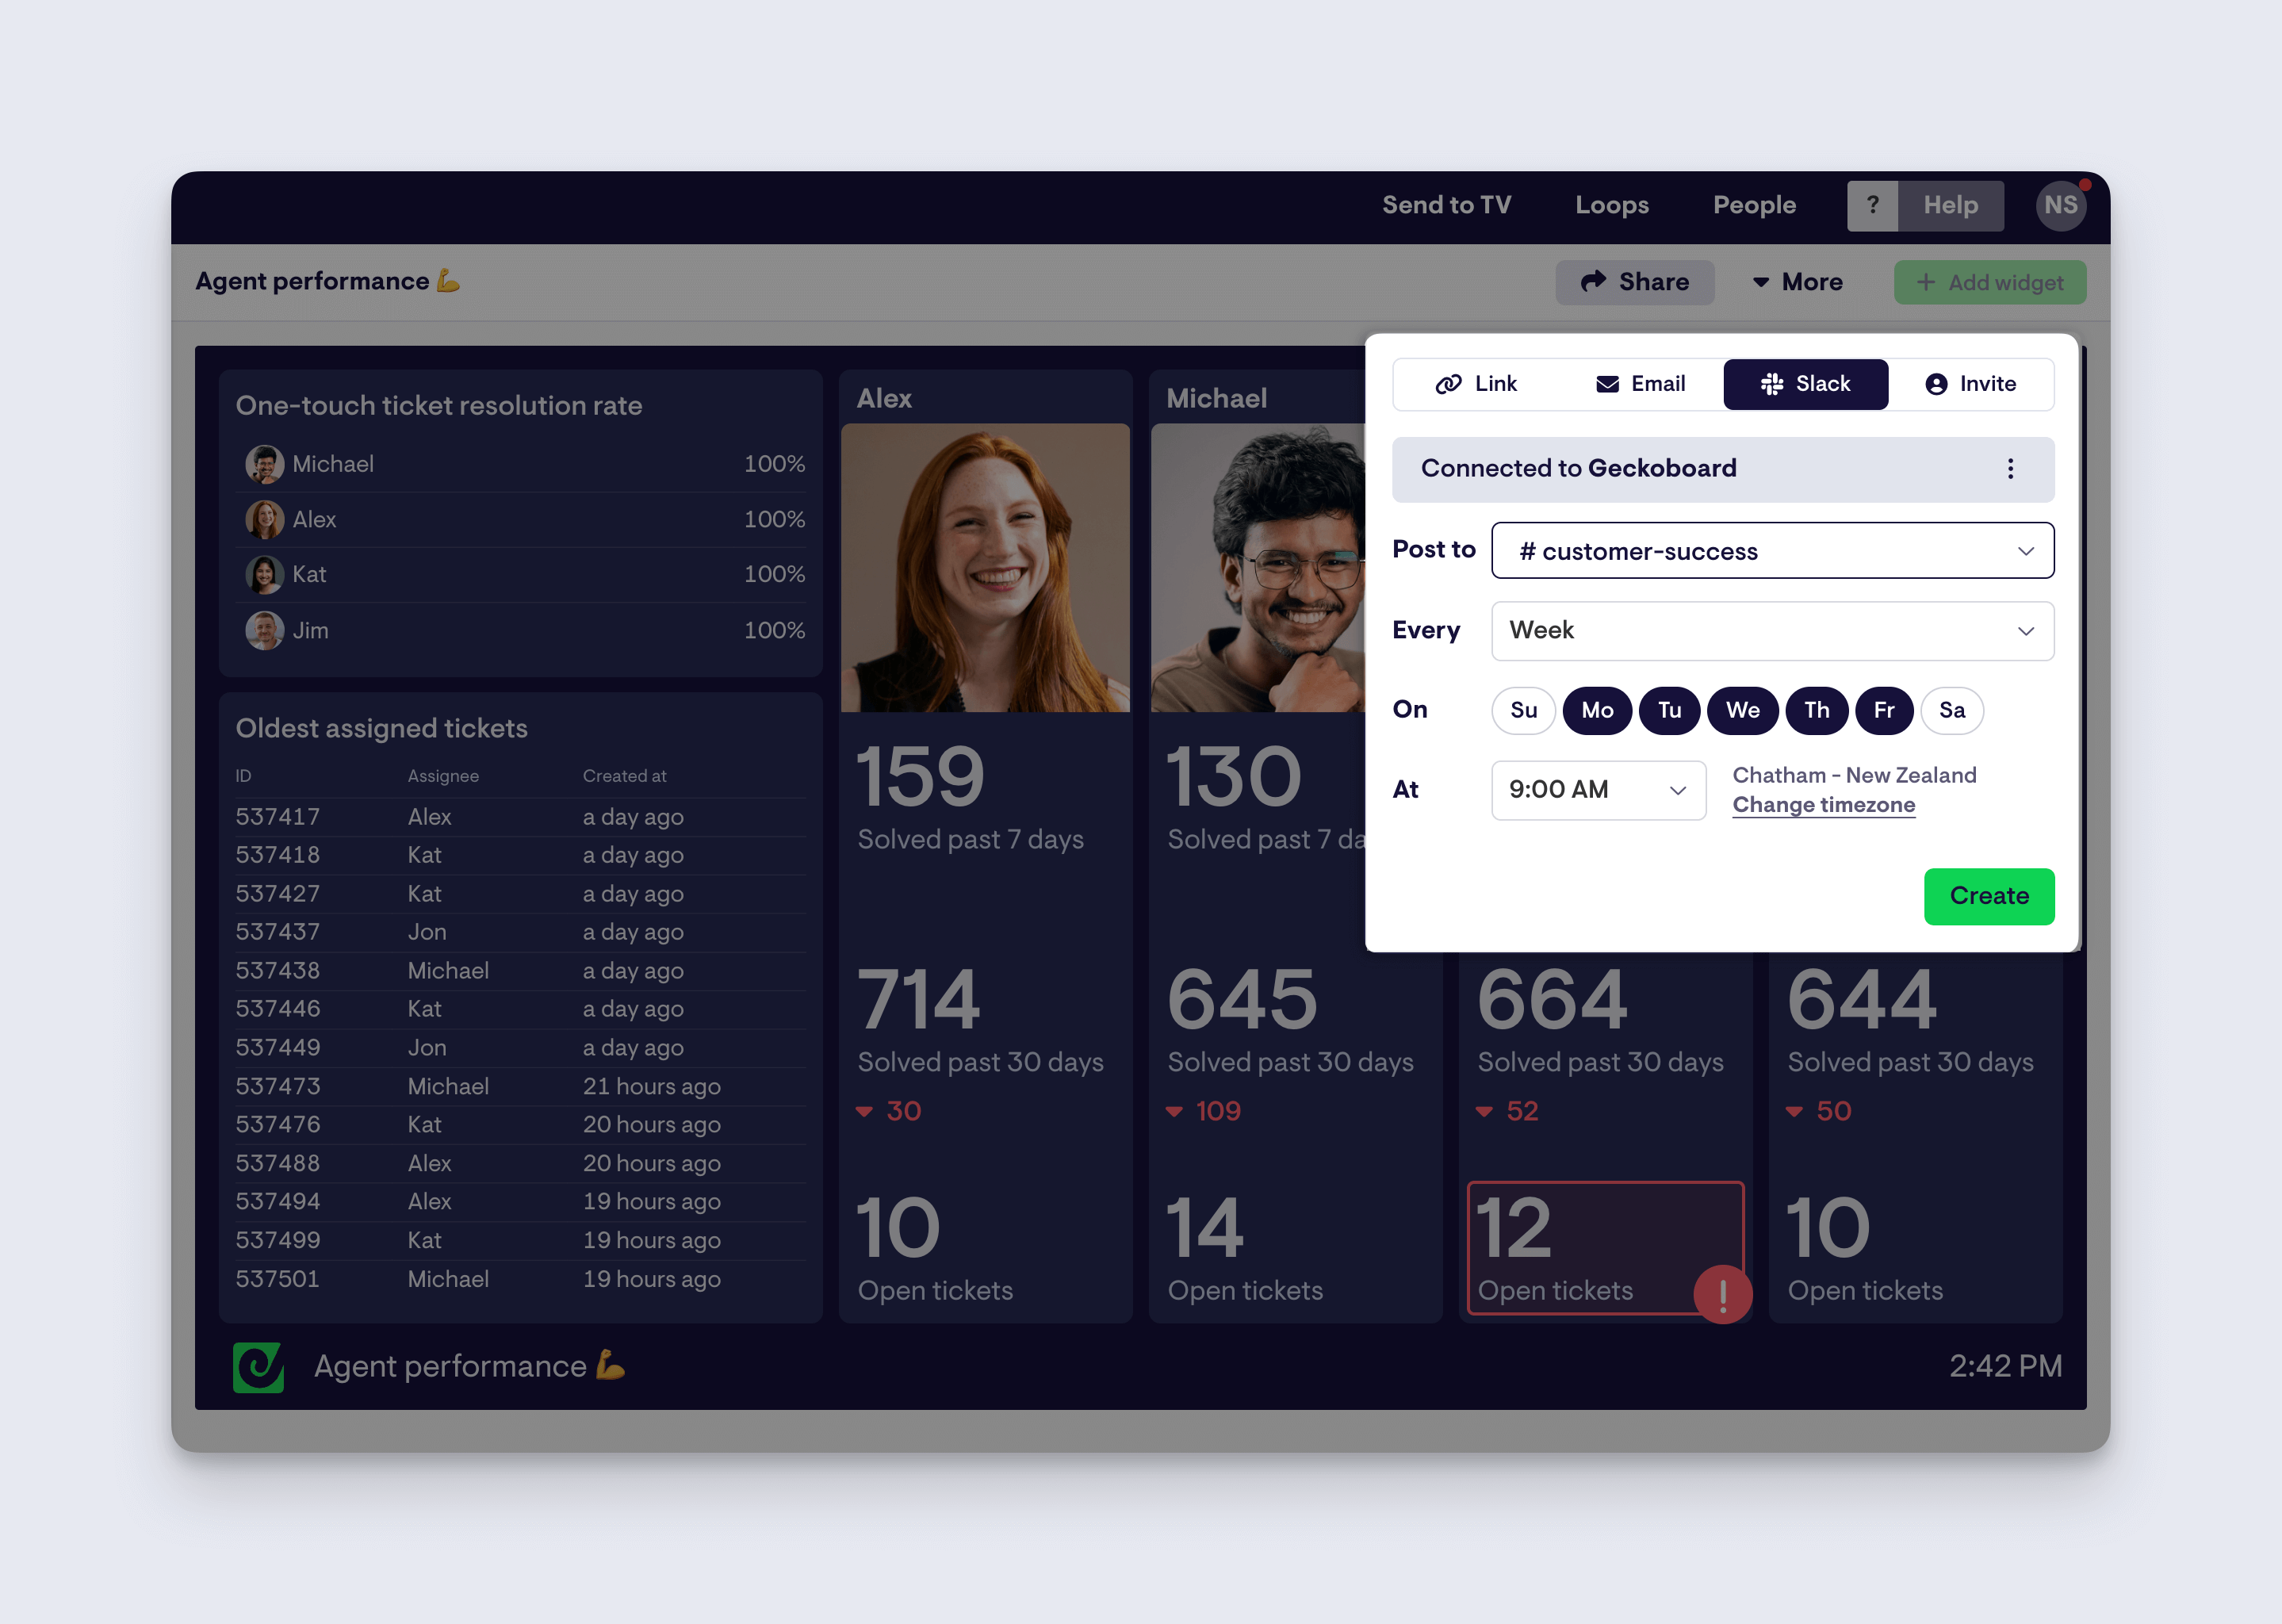
Step 4: Connect your Slack account and automate regular snapshots
Now you’ve built your dashboard, just connect your Slack account and schedule regular snapshots to appear in your Slack channels daily, weekly or monthly. In time, your team will start to incorporate data-driven decision making as they become more aware of their KPIs.
Step 5: Make data part of everyday work habits
Too often, we only examine key metrics when something is wrong and needs investigating, or when we are in a period of planning and review. And for team members who aren’t part of this process, KPIs (and their significance) can easily pass them by. They may only really get to spend time thinking about KPIs during monthly meetings when metrics are presented in reports.
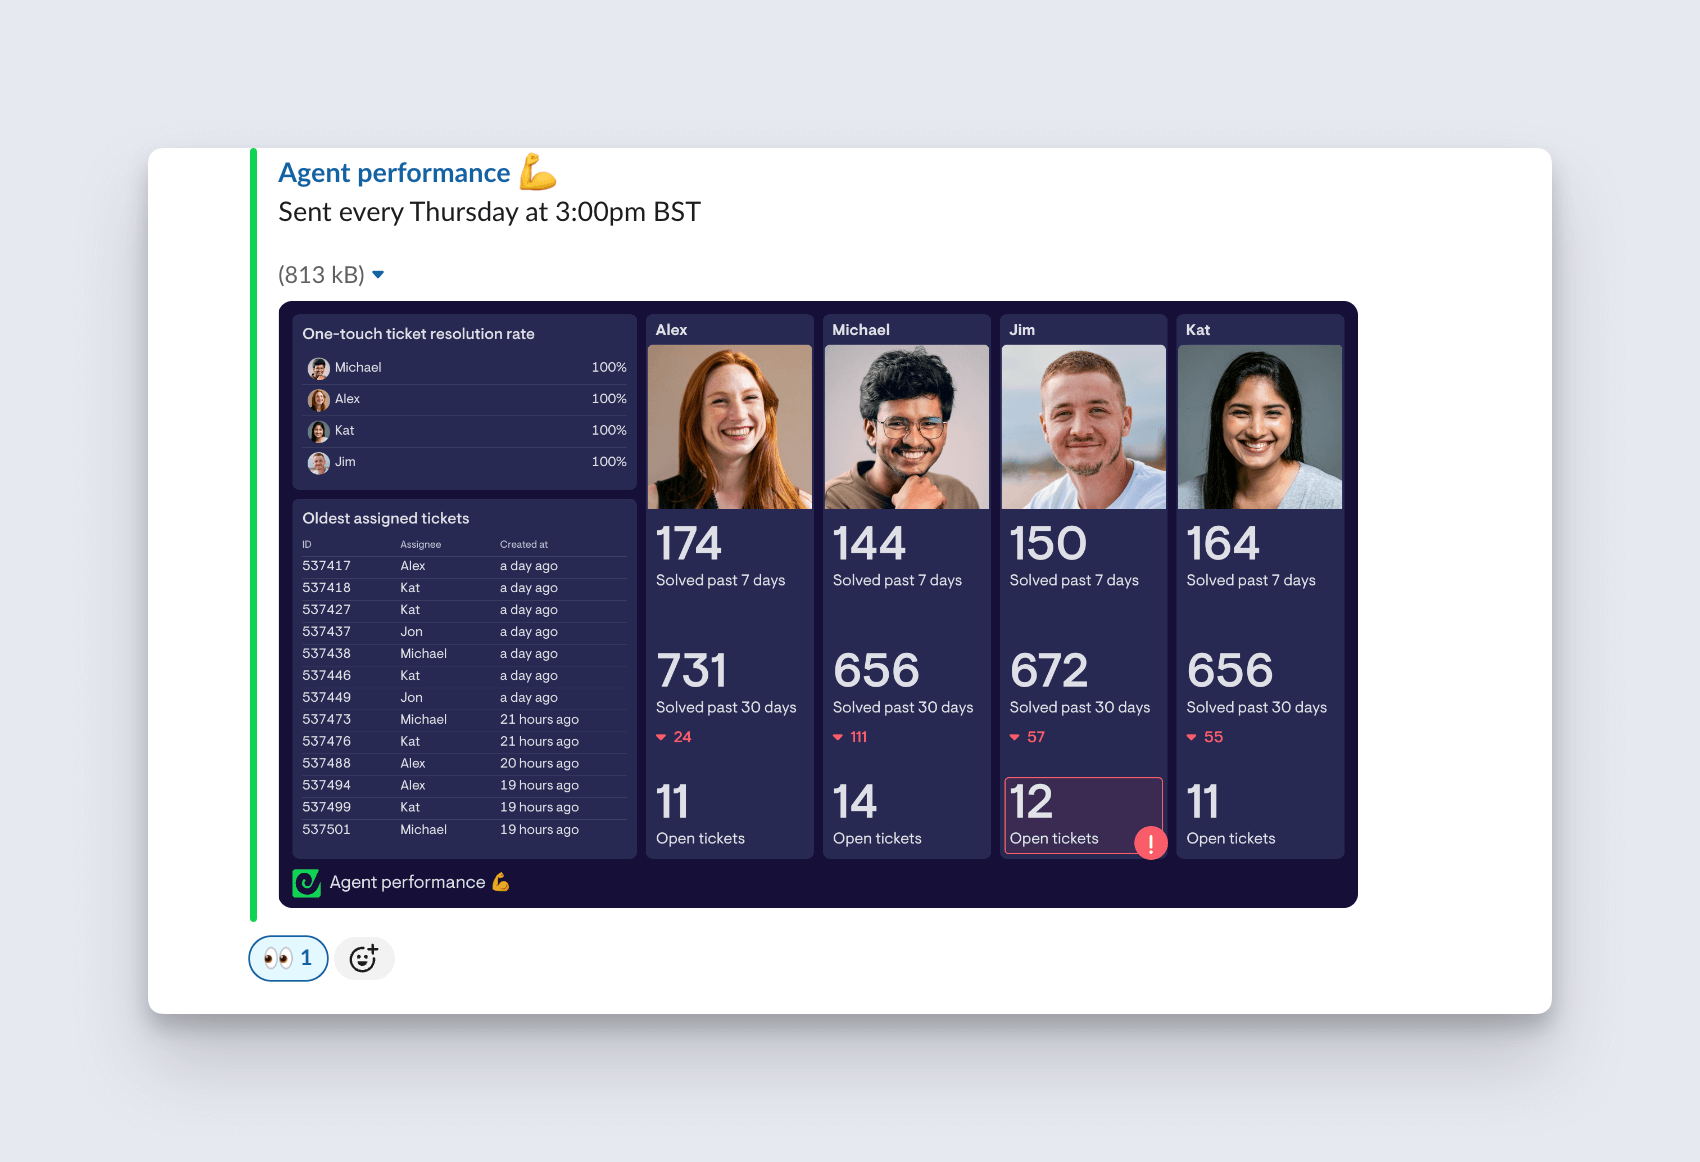
However, when data and dashboards become a regular feature of the Slack workspace, you can encourage team members to engage with data in a more casual, conversational way. Eventually the dashboard will become an important part of your collaboration tool, informing everyday conversations and decision making.
Try Geckoboard for free and start building your first Zendesk dashboard for Slack, today.
